$TMUS Earnings and Technical AnalysisUndercut and Reverse Pattern Observed in TMUS
On October 23rd, T-Mobile US (TMUS) released its earnings report, surpassing analyst expectations. Despite the positive results, the stock initially experienced a sell-off and closed down approximately 3.3%. The overall downward movement exceeded 5%, with trading on October 24th pushing the stock below its June lows. However, the following day saw a positive shift, as the stock closed higher and rallied past the previous June low. This price action meets the criteria for an Undercut and Rally formation.
Trading Strategy and Position Management
After observing these developments, I waited until today to confirm a potential follow-through day. When the stock rallied above yesterday’s high, I initiated a new position at half of my typical size, setting a stop-loss just below the most recent low to manage risk. Despite this move, TMUS remains under all of its key moving averages. It is currently attempting to reclaim the 5-day moving average (DMA). The next targets for the stock would be the 10-day and then the 20-day moving averages. Should TMUS successfully move above the 20 DMA, I plan to consider adding to my position.
Q3 2025 Earnings Performance
On Thursday, October 23, 2025, at 6:58 AM ET, T-Mobile US reported earnings of $2.59 per share for the third quarter ended September 2025, with revenue totaling $21.96 billion. These results exceeded consensus estimates of $2.42 per share in earnings and $21.73 billion in revenue. The Earnings Whisper number was $2.56 per share, indicating that TMUS beat expectations by 1.17%. Additionally, revenue increased by 8.90% compared to the same period last year.
Disclaimer
Readers are strongly encouraged to conduct their own analysis and to adhere to their personal trading rules. Investing in the stock market always carries risk, and it is essential to make informed decisions with your own capital.
Trade ideas

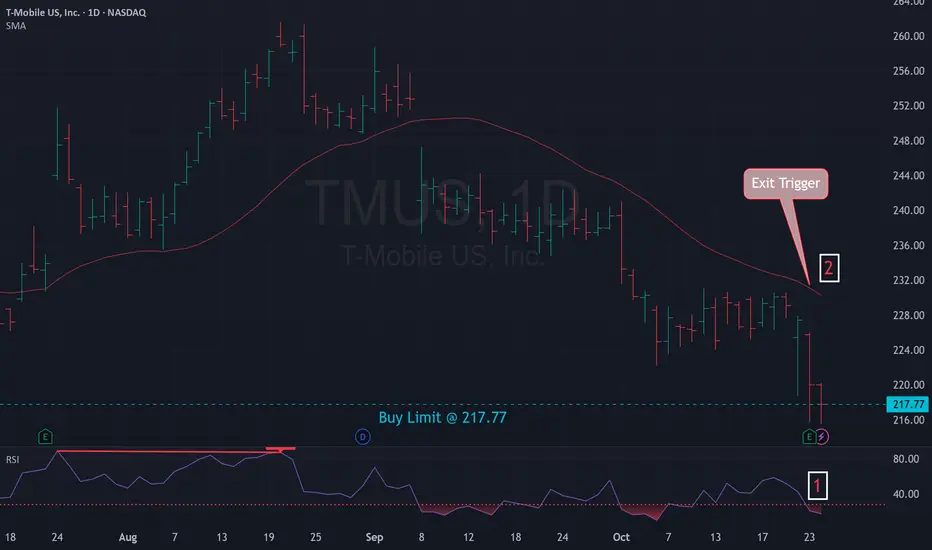
Mean Reversion Setup: TMUS1. RSI in oversold region
2. Price likely to rebound back the the mean
Trade Rules:
Entry Trigger - RSI has cross below oversold region, enter limit buy at close price
Exit Trigger - Close at market when close price cross above exit trigger (Red Line)
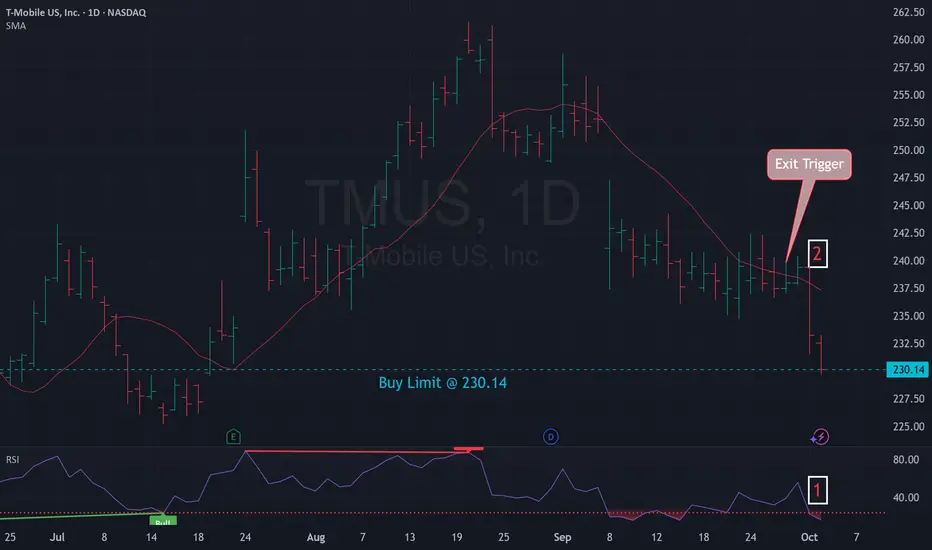
Mean Reversion Setup: TMUS1. RSI in oversold region
2. Price likely to rebound back the the mean
Trade Rules:
Entry Trigger - RSI has cross below oversold region, enter limit buy at close price
Exit Trigger - Close at market when close price cross above exit trigger (Red Line)
T-Mobile: Weak in a Strong Market?T-Mobile USA has limped as the broader market hits new highs, and now some traders may see downside signals emerging.
The first pattern on today’s chart is the gap lower on September 8. (The drop came after SpaceX’s Starlink purchased wireless spectrum licenses with plans to compete against carriers like TMUS.)
Second, the wireless company failed to rebound from the drop. That may suggest few investors saw an opportunity in the pullback.
Third, TMUS made a series of lower highs while closing above August 1’s weekly close of $237.20. However yesterday it seemed to break that descending triangle to the downside.
Next, recent consolidation below the 200-day simple moving average may suggest the long-term trend is growing more bearish.
Finally, MACD has been falling and the 8-day exponential moving average (EMA) is below the 21-day EMA. Those signals may reflect short-term bearishness.
TradeStation has, for decades, advanced the trading industry, providing access to stocks, options and futures. If you're born to trade, we could be for you. See our Overview for more.
Past performance, whether actual or indicated by historical tests of strategies, is no guarantee of future performance or success. There is a possibility that you may sustain a loss equal to or greater than your entire investment regardless of which asset class you trade (equities, options or futures); therefore, you should not invest or risk money that you cannot afford to lose. Online trading is not suitable for all investors. View the document titled Characteristics and Risks of Standardized Options at www.TradeStation.com . Before trading any asset class, customers must read the relevant risk disclosure statements on www.TradeStation.com . System access and trade placement and execution may be delayed or fail due to market volatility and volume, quote delays, system and software errors, Internet traffic, outages and other factors.
Securities and futures trading is offered to self-directed customers by TradeStation Securities, Inc., a broker-dealer registered with the Securities and Exchange Commission and a futures commission merchant licensed with the Commodity Futures Trading Commission). TradeStation Securities is a member of the Financial Industry Regulatory Authority, the National Futures Association, and a number of exchanges.
TradeStation Securities, Inc. and TradeStation Technologies, Inc. are each wholly owned subsidiaries of TradeStation Group, Inc., both operating, and providing products and services, under the TradeStation brand and trademark. When applying for, or purchasing, accounts, subscriptions, products and services, it is important that you know which company you will be dealing with. Visit www.TradeStation.com for further important information explaining what this means.

Mean Reversion Setup: TMUS1. RSI in oversold region
2. Price likely to rebound back the the mean
Trade Rules:
Entry Trigger - RSI has cross below oversold region, enter limit buy at close price
Exit Trigger - Close at market when close price cross above exit trigger (Red Line)

A+ Setup with 5:1 at Key Support```markdown
# 🎯 TMUS: The Perfect Storm - 8 Signals Screaming "BUY" at Critical Support
## **The Setup That Has It All**
When the stars align in trading, you take notice. When EIGHT technical indicators converge at the same price point? You take action.
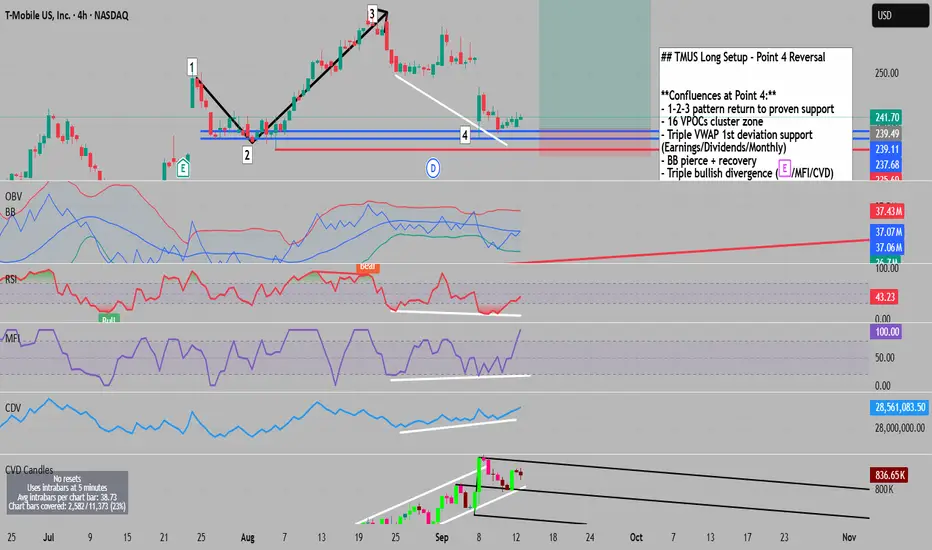
TMUS just delivered what might be the trade setup of the month - a textbook 1-2-3 pattern completion with more confirmation signals than a NASA launch sequence.
## **The Magic Number: $239.11**
Here's where things get interesting. Point 4 of our pattern isn't just another retest - it's a confluence supernova:
### **📊 Volume Speaks Volumes**
• 16 consecutive VPOCs stacked like a fortress at support
• Institutional footprints all over this zone
### **📈 The Triple VWAP Crown**
• Earnings VWAP 1st deviation ✓
• Dividends VWAP 1st deviation ✓
• Monthly VWAP 1st deviation ✓
All three kissing the same support level - coincidence? I think not.
### **🔄 Divergence Trifecta**
While price made a lower low from Point 3→4:
- RSI said "higher low"
- MFI said "higher low"
- CVD said "accumulation time"
### **💎 The Cherry on Top**
• Bollinger Band pierce and instant recovery (capitulation complete)
• OBV hitting extreme oversold on its own BB
• Reverse pitchfork perfectly catching Point 4
• CVD maintaining its uptrend channel through the chaos
## **The Trade Blueprint:**
**Entry:** $239.11
**Stop Loss:** $235.69 (below Point 2 - the proven floor)
**Target:** $257.71 (measured move to new highs)
**Risk/Reward:** 5.1:1 🎰
## **🎬 Action Plan:**
Watch for the trigger above $239.11. If it holds, we're looking at a potential 10.74% move with clearly defined risk. Q3 earnings on Oct 23 could be the catalyst, but the chart is already telling the story.
TMUS watch $227.03-227.69: Key support zone to end downtrend? TMUS has dropped a lot from its ATH a few months ago.
Currently testing a key support zone at $227.03-227.69
Look for a clean bounce to signal end of the downtrend.

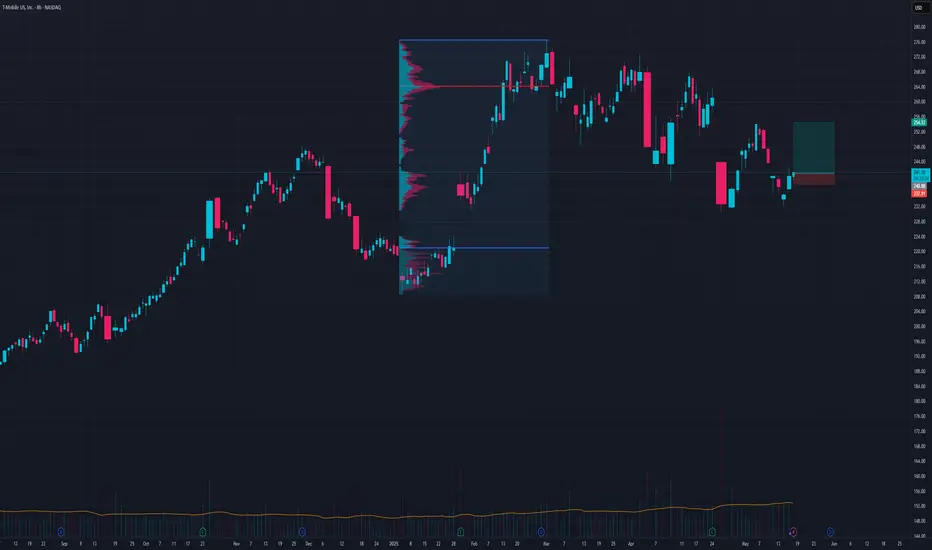
TMUS shortT mobile run seems to been exhausted and setting up. Weekly and Daily setup so anticipate a lot of head spin but on my radar. For now short seems to be my bias. 242.25 shows to be POC before 220 target of max pain. 218-209 is the area of interest for base bullish harmonic.
My View On Longing the $NASDAQ:TMUS NASDAQ:TMUS
always increase the 20% share equity at the best time, when it is cheap.

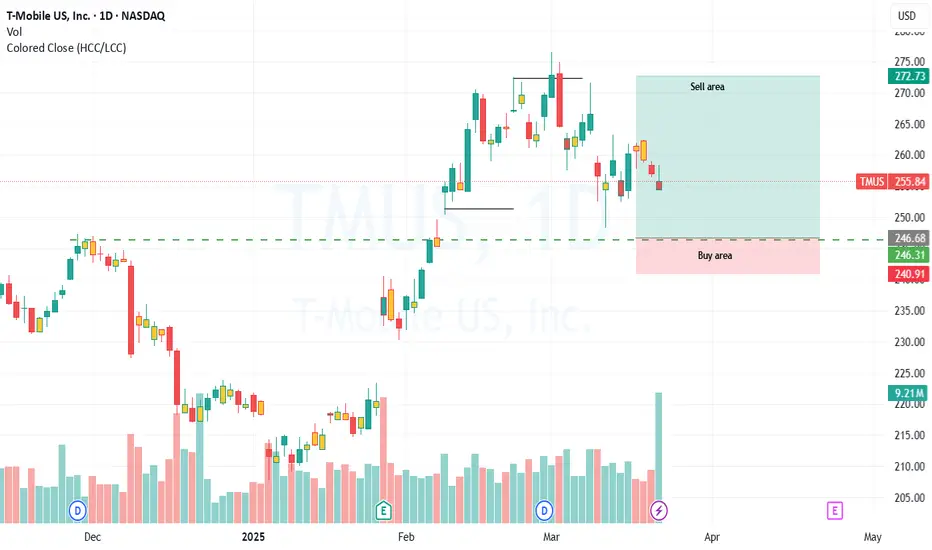
TMUS Long HereContinuation here into POC
Great risk to reward with this stop loss
SL 238
TP1 254
TP2 262
TMUS eyes on $248: Key Support for next leg of Recovery Wave TMTMUS has got trashed on last Earnings Report.
Recovery wave is dancing on a support zone.
Good spot for longs with Stop loss just below.
$ 247.73-248.13 is the exact zone of interest.
$ 243.99 below will be first support if dips.
$ 265.63-266.41 will be major target above.
========================================
.

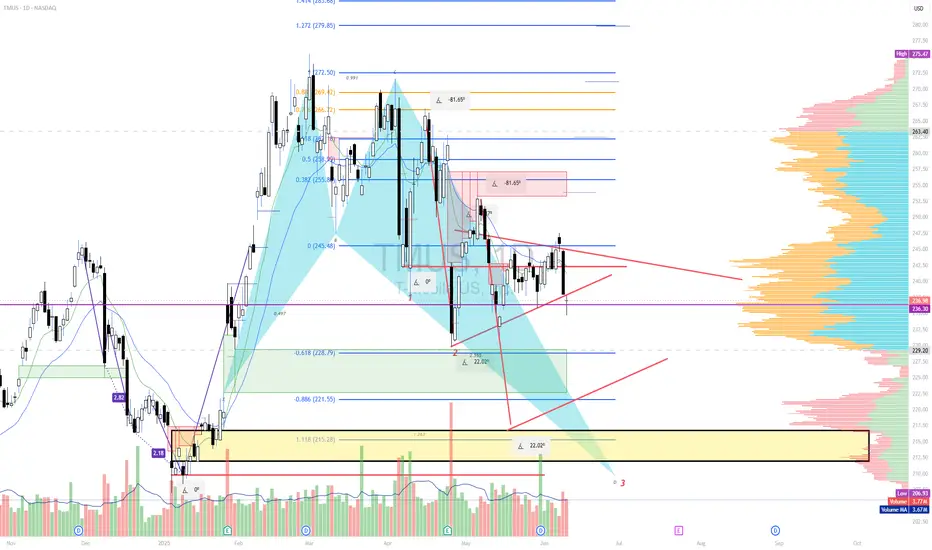
T-MOBILE stock Chart Fibonacci Analysis 043025Trading Idea
1) Find a FIBO slingshot
2) Check FIBO 61.80% level
3) Entry Point > 240/61.80%
Chart time frame: C
A) 15 min(1W-3M)
B) 1 hr(3M-6M)
C) 4 hr(6M-1year)
D) 1 day(1-3years)
Stock progress: A
A) Keep rising over 61.80% resistance
B) 61.80% resistance
C) 61.80% support
D) Hit the bottom
E) Hit the top
Stocks rise as they rise from support and fall from resistance. Our goal is to find a low support point and enter. It can be referred to as buying at the pullback point. The pullback point can be found with a Fibonacci extension of 61.80%. This is a step to find entry level. 1) Find a triangle (Fibonacci Speed Fan Line) that connects the high (resistance) and low (support) points of the stock in progress, where it is continuously expressed as a Slingshot, 2) and create a Fibonacci extension level for the first rising wave from the start point of slingshot pattern.
When the current price goes over 61.80% level , that can be a good entry point, especially if the SMA 100 and 200 curves are gathered together at 61.80%, it is a very good entry point.
As a great help, tradingview provides these Fibonacci speed fan lines and extension levels with ease. So if you use the Fibonacci fan line, the extension level, and the SMA 100/200 curve well, you can find an entry point for the stock market. At least you have to enter at this low point to avoid trading failure, and if you are skilled at entering this low point, with fibonacci6180 technique, your reading skill to chart will be greatly improved.
If you want to do day trading, please set the time frame to 5 minutes or 15 minutes, and you will see many of the low point of rising stocks.
If want to prefer long term range trading, you can set the time frame to 1 hr or 1 day.

Same pattern, same swing, bearish to 240sWith every indicator screaming for a retrace and the pullback having started, the question is whether the area is in the 240s, which is highly likely; however, continue to watch for any jumps in between.

TMUS - Increased Probability of AppreciationThe alignment and compression of FiboNuvens providing support to the candles indicate an increased probability of appreciation, at least toward the first target. Upon reaching this target, with the stop-loss moved to the entry position, we can attempt to reach the final target. This strategy should secure the achieved result while drastically reducing the risk of loss in the trade.
Let’s see how this plays out! Follow this profile to track this trade and get updates on this and other ongoing opportunities.

still looking for buy opportunity in week 2 at 240sAlerted to the buy zone last week, waiting for this area before going long based on various indicators and chart patterns combined.
T-Mobile due for correctionThere's so much speculation around Ai and Tech that a lot of people have gotten on board T-Mobile as a stop buying option. With that said it's been so fomo powered I can see a pullback coinciding with the Ides of March. Let's see.

Clearly time to SHORT... I couldn't help myself... as I'm watching the Super Bowl I seen a NASDAQ:TMUS commercial and felt it was only appropriate to look into the chart.
I noticed a recent visit to the Current Resistance level and thought I'd better point this out to my fellow TradingView investors. As you can see I drew a caution W in yellow, as that is the route I see ahead us... please don't get me wrong, this stock has been on a long term Bullish Run and that will continue for quite some time. However, as you can see, once it reached it's Resistance level... it was followed by a significant pullback to Support, which currently sits at 230.66. With that being said, I am definitely interested in jumping into a short term Put and expect to take some profits on the way back down.
The 225 Put expiring on 3/14 at a cost of .98 is very enticing!
Again, as I've said before... I am not a financial guru and definitely not your financial advisor (yet) but I will share with you my claims regarding what price action I see. I'd suggest you complete your own Due Diligence and not jump into mine or anyone else's picks without diving into some analysis yourself.
Last and definitely not least, to me, the most important part... Take Profits, Take Profits, Take Profits!!! I cannot stress that enough.
Good luck on your trading journey ladies and gentlemen!


TMUS LongLeading the Telecommunications center and at a good mid term dip. Buying and selling this one. Fundamentals are good and hedge funds still be buying it. Financials look great. This stock is no longer ghetto internet provider. Analysts say buy as well and target a 10% average increase.
$TMUS with a bullish outlook following its earnings #StocksThe PEAD projected a bullish outlook for NASDAQ:TMUS after a positive under reaction following its earnings release placing the stock in drift A with an expected accuracy of 95.45%.

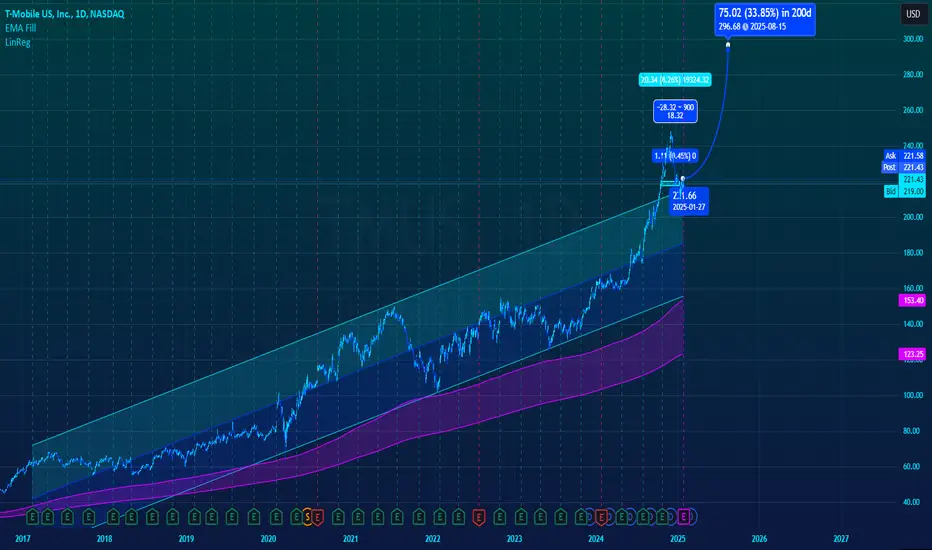
T-MOBILE No signs of stopping this rally before $350.T-Mobile (TMUS) has been trading within a 12-year Channel Up since the October 2012 High. Since the weekly break-out on the May 20 2013 1W candle, the 1W MA200 (orange trend-line) has been the absolute Support of this pattern, never broken, offering the most optimal buy opportunities as close to is as possible every time the price broke below the 1W MA50 (blue trend-line).
The 1W RSI indicates that we are in a similar stage of the uptrend as the two mega Bullish Legs the preceded it. The Sine Waves accurately catch the tops (Higher Highs) of this Channel Up pattern, and the next one should be around $350 by the end of 2025. A really good opportunity to buy even on the current levels.
-------------------------------------------------------------------------------
** Please LIKE 👍, FOLLOW ✅, SHARE 🙌 and COMMENT ✍ if you enjoy this idea! Also share your ideas and charts in the comments section below! This is best way to keep it relevant, support us, keep the content here free and allow the idea to reach as many people as possible. **
-------------------------------------------------------------------------------
💸💸💸💸💸💸
👇 👇 👇 👇 👇 👇

T-Mobile: Volatile!The TMUS stock has been volatile over the past two weeks, moving sharply in both directions. After a strong uptrend, it saw a pullback last Friday. We continue to view the price as entering the final stage of the green wave (5), which still holds significant expansion potential.

Lookback at $TMUS 660% trade4h makes higher high, while breaking that timeframe's linear regression channel upper bound.
shows momentum strengthening on TTM Squeeze Indicator, while RSI trendline on the daily breaks to the upside.
