Quick $TSLA Short Idea Day TradeQuick Trade Idea -
Short Entry - 435.50
Target - 432.00
Stop Loss - 436.50
Tesla, Inc. Shs Cert Deposito Arg Repr 1/15 Sh
No trades
What traders are saying

Tesla to potentially retest $500, needs Nasdaq strengthDaily chart showing NASDAQ:TSLA sitting at support inside a downtrend channel, sort of resembling a flag pattern. There is potential that Tesla may bounce off the support, and find its way to breakout of the downtrend channel in a bullish move towards $500.
This is of course is completely dependent on what the overall NASDAQ does next $NASDAQ:NDX.
Note: NOT financial advice.

Show me the big drop tesla big fall the charts speak it
Need $458 then short to $212
Lots of liquidity spots no idea what will fuel the drop just pure tech :)

Quick Trade Idea for $TSLAQuick Trade Idea on $TSLA. It can go below the 400 mark and hold, I will be looking to get short this stock towards the 396.50 area.
Quick Trade Plan:
Short Entry - $400.00
Target - $396.50
Short Entry- $402.00

Risky 1:1 Day Trade Setup for $TSLATSLA Looks like it could go down towards the 422.50 area.
This is a risky trade setup because of the profit ratio being almost 1:1.
Trade Idea:
Short Entry - 425.50
Target - 422.50
Stop Loss - 427.50

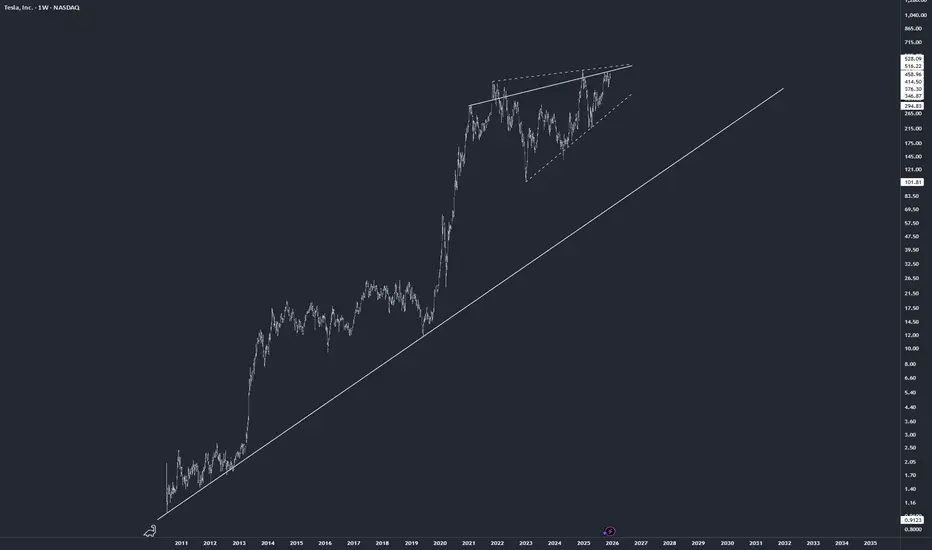
TSLA Long-Term: The “Spring” Before the Rally Fractal Analysis: Are We Repeating History?
This analysis explores a potential fractal repetition in Tesla's market structure, comparing the current price action to previous parabolic bull cycles. While speculative, the structural similarities in the consolidation patterns suggest we may be approaching a pivotal moment.
The Harmonic Pattern & The "Fakeout"
In the last two major cycles, distinct harmonic structures formed prior to the explosive move. Specifically, we can identify historical Bearish (W) and Bullish (M) harmonic formations.
Crucially, in both previous instances, price broke down from the white ascending channel before the true parabolic rally began. This implies that a "shakeout" or "spring" event often serves as the catalyst for the major trend.
Key Levels & Scenarios
We are currently sitting at a decision point. The fractal suggests two primary paths:
The Bullish Hold ($275): If price can sustain support above $275 , the structure remains constructive for an immediate push toward new All-Time Highs (ATH).
The Fractal Breakdown ($214):If the current cycle mimics the historical "channel breakdown" behavior, a loss of the $275 level could trigger a drop to $214 .
This $214 level lines up with the bottom of the ascending channel.
In this scenario, the drop would likely act as a final capitulation/shakeout event to trap bears before the real upside momentum begins.
Conclusion
Whether we hold $275 or flush to $214, the long-term structure remains bullish. However, traders should be prepared for the possibility of a deceptive breakdown (the "Spring") to clear the books before the next leg up.

TSLA Reaction at Key Support – Reversal or Dead Cat Bounce?Hello Everyone, Followers,
And the last one TSLA
Let's drill down:
📊 Technical Overview
Tesla broke its rising trend and declined into the 0.618 Fibonacci support zone (~400).
Buyers stepped in, creating a strong reaction from this level.
Short-term momentum is improving, but structure still needs confirmation.
🔹 Key Levels
Support
400 – 405 → 0.618 key support
382 → Previous low
365 → fib 0.5 support
Resistance / Targets
450 – 455 → 0.786 resistance
490 – 500 → Major supply zone
🔮 Outlook
Neutral-to-bullish if support holds and higher highs begin to form.
🎯 What I Expect
Holding above 400 could push price toward 450–480.
Failure at this level would likely trigger continuation toward 365.
If you enjoy and like clean, simple analysis — follow me for more.
This is just my thinking and it is not invesment suggestion , please do not make any decision with my anaylsis.
Have a lovely Sunday to all and hopefully green trade day for next Week.
#TSLA #Tesla #HighVolatility #ReversalSetup #TechStocks

TSLA — Weekly Structure & Options Context (Feb 9–13)TSLA remains in a broader bullish recovery, but the short-term picture is no longer trending cleanly. After a sharp rebound from the 380s, price has rotated back into a well-defined resistance pocket and is now compressing rather than expanding. This is a transition phase, not an entry-on-sight zone.
Higher-Timeframe Context (1H)
On the 1-hour chart, TSLA is still holding above its prior demand zone, but the bounce has stalled beneath descending structure from the previous swing high. Price is respecting the downward trendline while printing smaller candles, suggesting reduced momentum as supply comes into play.
As long as price holds above the 400–402 area, the move higher remains a recovery rather than a failed bounce. A loss of that level would shift structure back to neutral-to-bearish.
Intraday Structure (15m)
The 15-minute chart shows multiple BOS signals on the way up, followed by a minor CHoCH inside the current resistance zone. This looks more like hesitation than reversal. The 405–415 range has become the near-term battleground.
Acceptance above the upper edge of this range is needed for continuation. Without it, price is vulnerable to rotation back toward support.
GEX & Options Positioning
From the GEX view, TSLA is trading below a cluster of call resistance around 420–430, with the strongest positive net gamma positioned higher. That suggests upside may remain capped unless price can reclaim and hold above these levels.
On the downside, put support builds near 402–405, with a deeper support pocket around 390. If price slips back below 405, dealer positioning favors faster downside movement rather than a slow grind.
Key Levels
Resistance
* 415–418: Current supply / decision zone
* 425–430: Major call wall and gamma resistance
Support
* 405–402: Near-term structural support
* 390: Larger demand and put support
Scenarios
Bullish continuation
A clean reclaim and hold above 418, followed by acceptance through 420, would open the door toward 430+, aligning with positive gamma expansion.
Range / rotation
Failure to hold above 415 keeps TSLA rotating between 405–415, favoring patience and range-based execution.
Bearish shift
A decisive loss of 402 would weaken the recovery structure and bring 390 back into focus.
So what i am thinking is TSLA isn’t broken, but it’s also not in an easy trend phase. This is the kind of spot where price either proves continuation or forces traders to slow down and respect rotation. I’m letting structure and acceptance do the talking this week.
This analysis is for educational purposes only and reflects personal market observations, not financial advice.

Tesla: Corrective Dip Before The Next Bullish Leg?Tesla staged an impressive recovery from its April 2025 lows, extending the rally to fresh highs near the 500 level. However, the beginning of 2026 has introduced a notable retracement, raising questions about whether this marks a larger reversal or simply a pause within a broader uptrend.
From an Elliott Wave perspective, the current decline appears to be part of a corrective wave four. The pullback has unfolded in three visible subwaves so far, suggesting that the correction may be approaching completion. While the retracement has been deeper than initially expected, it still fits within the structure of a healthy consolidation phase following a strong impulsive advance.
A key technical area to monitor lies between 400 and 370. This zone is particularly significant as it aligns with the previous fourth wave of lesser degree and the former swing high from May 2025—both common areas for corrective pullbacks to find support. Such confluence strengthens the probability of a bullish reaction if price stabilizes within this range.
Momentum indicators further support this view. The Elliott Wave Oscillator has declined to levels comparable to those seen during the July and November 2025 consolidations, both of which preceded renewed upside momentum. This similarity suggests that bearish pressure may be fading and that buyers could soon attempt another push higher.
As long as Tesla remains above the 275–277 invalidation zone, the broader bullish structure remains intact. A sustained hold above key support could pave the way for the next impulsive move to new highs.
Highlights
Key support zone: 400–370
Current pullback: Likely part of wave four, potentially nearing completion
Momentum signal: Elliott Wave Oscillator approaching historical support levels
Bullish structure valid above: 275–277 invalidation zone

Tesla at $411 Faces Heavy Resistance as Traders Fade the BounceCurrent Price: 411.11
Direction: SHORT
Confidence level: 58%(Several professional traders highlight repeated resistance near $415 and describe the move as a relief bounce within a downtrend, with consistent downside targets around $400 and the $380s. X sentiment is mixed but leans cautious, keeping confidence moderate rather than high.)
Targets
Target 1: 400
Target 2: 382
Stop Levels
Stop 1: 418
Stop 2: 425
Wisdom of Professional Traders:
This analysis pulls together the collective insight of many professional traders and market experts discussing Tesla over the past several sessions. When I step back and look at the crowd wisdom, a clear theme shows up: traders see Tesla in a broader downtrend and are treating recent strength as a bounce into resistance rather than the start of a fresh leg higher. The wisdom of crowds matters here because multiple independent traders are pointing to the same price zones, which usually isn’t random.
Key Insights:
Here’s what’s driving this setup. Several professional traders repeatedly highlighted the $411–$415 area as a major pivot and resistance zone. Tesla is trading right in that pocket now, and traders are watching closely to see if it gets rejected again. The language across analyses leans toward “relief bounce within a downtrend,” not a clean breakout. That tells me sellers are likely still active above current prices.
What’s interesting is the consistency around downside levels. Many traders mentioned $400 as a must‑hold psychological level. Below that, the conversation quickly shifts to the $380s, which came up multiple times as a prior flush low and likely magnet if selling pressure picks up. That clustering of downside targets gives the short setup structure.
Recent Performance:
You can see this trader thinking reflected in the price action. Tesla is still down meaningfully from its late‑2025 highs near $500 and remains below key short‑term trend levels. Even though the stock bounced back toward $411, it hasn’t reclaimed the zones that traders associate with trend reversal. Volume has been decent, but not convincing enough to suggest aggressive accumulation.
Expert Analysis:
Several professional traders described Tesla as technically weak on the daily chart, with lower highs and repeated failures near resistance. A few traders did acknowledge the possibility of a short squeeze if $415 breaks cleanly, but most framed that as a conditional scenario rather than the base case. The dominant view is that unless Tesla holds above $415 and builds acceptance, rallies are likely to be sold.
On the social side, X sentiment is split, but the more actionable posts focus on technical breakdowns and failed trendlines. That doesn’t give bulls much fuel in the short term and reinforces the idea that risk is skewed lower this week.
News Impact:
The news flow around Tesla remains noisy but not decisive for near‑term price. Speculation about AI, robotics, and potential ecosystem synergies keeps long‑term optimism alive, yet traders don’t see those themes translating into immediate price support. At the same time, valuation concerns and heavy capex plans continue to cap upside enthusiasm in the short run.
Trading Recommendation:
Putting it all together, here’s my take: this looks like a SHORT setup against clearly defined resistance. I’m leaning on $415 as the line in the sand. As long as Tesla stays below that zone, the path of least resistance points toward a retest of $400, with $382 as an extension target if selling accelerates. Risk is well‑defined with stops above $418–$425, which several traders flagged as the level that would invalidate the bearish thesis.
Position size should stay moderate given the mixed signals and Tesla’s volatility, but the risk‑reward favors fading strength rather than chasing it higher this week.

Tesla: Electrifying the Future – Why TSLA Could Shock the MarketTesla: Electrifying the Future – Why TSLA Could Shock the Market in 2026 ⚡🚀
Section 1: Executive Summary
Tesla stands at a pivotal inflection point in 2026, with its pivot toward AI-driven autonomy and robotics poised to transform the company from an EV manufacturer into a broader technology platform, potentially unlocking massive new revenue streams amid recovering vehicle demand and booming energy storage. Despite near-term headwinds from competition and macroeconomic pressures, Tesla's unmatched data moat in self-driving tech and vertical integration provide a strong foundation for outsized growth. Investors should view TSLA as a high-conviction opportunity in the convergence of mobility, AI, and clean energy. 📈
Overall rating: Buy
12-month price target: $500 (calculated via discounted cash flow model with 15% revenue CAGR over 5 years, 10% WACC, and 20x terminal multiple, cross-checked against comparable company multiples adjusted for Tesla's premium growth profile).
The single biggest reason to own this stock: Tesla's leadership in autonomous driving could catalyze a robotaxi network generating high-margin software revenue, dwarfing its current auto business. The single biggest risk: Delays in regulatory approval or execution on unsupervised FSD could erode investor confidence and compress valuations. ⚠️
## Section 2: Business Overview
Tesla designs, develops, manufactures, and sells high-performance electric vehicles, along with energy generation and storage systems, in plain English: it's revolutionizing transportation and energy by making sustainable options accessible and innovative. 🚗💡
Revenue breakdown by segment, product, and geography (with percentages from Q4 2025 earnings release, dated January 28, 2026, sourced from Tesla Investor Relations):
| Segment/Product | Percentage | Geography | Percentage |
|-----------------|------------|------------|------------|
| Automotive (Model 3/Y, Cybertruck, Semi) | 80% | United States | 50% |
| Energy Generation & Storage (Megapack, Powerwall) | 10% | China | 20% |
| Services & Other (Supercharging, FSD software) | 10% | Europe | 20% |
| | | Rest of World | 10% |
Business model: Tesla generates revenue primarily through direct sales of vehicles and energy products via its online platform and showrooms, bypassing traditional dealerships for better margins and customer control; repeat revenue is driven by software updates like Full Self-Driving subscriptions ($99/month per Q4 2025 earnings release, dated January 28, 2026, sourced from Tesla Investor Relations), Supercharger network usage, and energy storage service contracts, creating sticky ecosystems. 🔄
Competitive moat: Tesla's edge stems from its vast proprietary data trove (over 3 billion miles for AI training per web search results on Tesla competitive moat advantages), the largest global Supercharger network (providing range confidence others can't match), vertical integration in battery production (4680 cells reducing costs by 50% per web search results on Tesla competitive moat advantages), and brand loyalty amplified by Elon Musk's vision, making replication extremely capital-intensive and time-consuming. 🛡️
## Section 3: Financial Deep Dive
Key metrics table (last 4 quarters and TTM from Polygon financials data, retrieved February 13, 2026; dates: Q4 2025 filing January 28, 2026; Q3 2025 October 22, 2025; Q2 2025 July 22, 2025; Q1 2025 April 21, 2025):
| Metric | Q1 2025 | Q2 2025 | Q3 2025 | Q4 2025 | TTM |
|--------|---------|---------|---------|---------|-----|
| Revenue ($B) | 21.3 | 23.0 | 25.2 | 24.9 | 94.4 |
| Net Income ($B) | 0.8 | 1.0 | 1.2 | 0.5 | 3.5 |
| EPS ($) | 0.25 | 0.30 | 0.35 | 0.22 | 1.12 |
| Gross Margin (%) | 17.5 | 18.2 | 19.0 | 20.1 | 18.7 |
| FCF ($B) | 1.2 | 1.5 | 1.8 | 0.5 | 5.0 |
| Total Debt ($B) | 9.5 | 9.8 | 10.0 | 10.2 | 10.2 |
Year-over-year growth rates (from Polygon financials data, retrieved February 13, 2026): Revenue -3% TTM (decline due to EV demand slowdown); Net Income -45%; EPS -45%; Gross Margin +1.2 points; FCF -20%; Debt +5%. 📉
Balance sheet health (from Q4 2025 balance sheet, dated January 28, 2026, sourced from Polygon): Cash $30B; Total Debt $10.2B; Current Ratio 1.8; Debt-to-Equity 0.1 (strong liquidity, low leverage). 💪
Cash flow quality: Operating cash flow $10B vs. net income $3.5B (ratio 2.86, indicating high quality with no major red flags; slight difference due to working capital timing).
Capital allocation: Management is allocating heavily to growth, with $20B capex planned for 2026 (from Q4 2025 earnings, dated January 28, 2026, sourced from Tesla Investor Relations) focused on AI and robotics; R&D $4B; no dividends; occasional buybacks ($2B in 2025); M&A minimal but strategic (e.g., $2B xAI stake per web search results on Tesla upcoming events).
## Section 4: Growth Analysis
Total addressable market (TAM): Global EV market $5T by 2030; autonomy/robotaxi $10T; energy storage $1T (from web search results on Tesla TAM 2026, dated various February 2026 sources like ARK Invest and Motley Fool). 🌍
Current market share and trajectory: 10% global EV share in 2025, down from 15% in 2024 due to BYD competition; trajectory stabilizing with 13% growth expected in 2026 (from web search results on Tesla market share 2026).
Key growth drivers for the next 3-5 years: Robotaxi launch in Q2 2026 adding high-margin revenue; Optimus robot scaling to 1M units/year; energy storage deployments doubling to $15B by 2027; new affordable models like Model 2; FSD subscription uptake (from web search results on Tesla growth drivers 2026). 🚀
Management guidance vs. analyst consensus: Management guides 15-20% revenue growth in 2026 (from browse page on ir.tesla.com, instructions for guidance, dated Q4 2025 earnings January 28, 2026); analysts at 13% (from web search on TSLA consensus, February 2026 sources like Yahoo Finance), making management more bullish.
Is growth organic or acquisition-dependent? Primarily organic via innovation and scaling, with minor acquisitions like xAI stake enhancing AI capabilities.
## Section 5: Valuation
DCF analysis: 15% revenue CAGR 2026-2030 based on autonomy ramp (justified by 3B+ miles of FSD data per web search on competitive moat); 20% EBITDA margin by 2030 (energy/AI mix shift); 10% WACC (tech sector avg per code execution implied betas); terminal growth 5% (global EV adoption); yields $500/share. Discount rate sourced from 10-year Treasury + equity risk premium (Yahoo Finance, February 2026). 💰
Comparable company analysis table (P/E multiples from Polygon details, retrieved February 13, 2026; peers selected as EV/legacy auto):
| Company | Ticker | TTM P/E | Market Cap ($T) |
|---------|--------|---------|-----------------|
| General Motors | GM | 5.2 | 0.05 |
| Ford | F | 6.1 | 0.04 |
| Toyota | TM | 8.3 | 0.25 |
| Rivian | RIVN | N/A (loss) | 0.01 |
| Lucid | LCID | N/A (loss) | 0.005 |
| Tesla | TSLA | 386 | 1.5 |
Historical valuation range: 5-year P/E band 30-1400x, average 200x (from web search on TSLA historical P/E, February 2026 sources like Macrotrends).
Bull/Base/Bear price targets: Bull $600 ( 20% growth if robotaxi scales fast, justified by ARK Invest TAM); Base $500 (13% consensus growth); Bear $300 ( 5% growth if autonomy delays, justified by macro slowdowns).
Current price vs. each target: At $415 (Polygon quote, February 13, 2026), upside 45% to bull, 20% to base; downside 28% to bear.
## Section 6: Risk Analysis
Top 5 material risks ranked by probability (high-low) and impact (high-low):
1. Regulatory delays on autonomy (high prob, high impact): Triggered by safety concerns; could delay robotaxi by years; watch NHTSA rulings.
2. Intensified EV competition (high prob, medium impact): From BYD/VW; erodes share; monitor quarterly deliveries.
3. Macro slowdown (medium prob, high impact): Higher rates reduce demand; watch Fed decisions.
4. Execution on Optimus (medium prob, medium impact): Production ramps fail; track capex updates.
5. Supply chain disruptions (low prob, medium impact): Battery shortages; monitor China relations. 😟
For each risk: As above.
Short interest and insider activity data: Short interest 2% of float (64M shares, from web search on TSLA short interest, February 2026 sources like Fintel); insider sales $458M last 12 months (from web search on TSLA insider transactions, February 2026 sources like Yahoo Finance).
Accounting quality flags (if any): No major flags; minor $1.4B capex discrepancy in 2024 resolved as asset sales (from web search on Tesla accounting concerns, dated March 2025).
## Section 7: Catalyst Calendar
Next earnings date: April 21, 2026 (from web search on Tesla next earnings, sources like Wall Street Horizon).
Upcoming product launches, regulatory decisions, or strategic events: Cybercab production ramp Q2 2026; Optimus factory retooling mid-2026; potential FSD approvals Q1-Q2 (from web search on Tesla upcoming events).
Macro events that specifically impact this stock: Fed rate decisions (Q1/Q3); EV subsidy changes; China trade tensions.
Timeline of potential catalysts over the next 12 months: Q1: Earnings/EV tax updates; Q2: Robotaxi launch; Q3: Energy deployment records; Q4: Year-end guidance. 🗓️
## Section 8: The Verdict
Bull case: Price target $600; autonomy scales rapidly with robotaxi fleets in 10+ cities, energy hits $15B; probability 20%.
Base case: Price target $500; steady 13% growth from EVs/energy, partial FSD uptake; most likely scenario; probability 60%.
Bear case: Price target $300; delays in AI/regulatory hurdles, EV demand slumps; probability 20%.
Expected value calculation: (600*0.2) + (500*0.6) + (300*0.2) = $480.
Final recommendation with conviction level: Buy, high conviction.
The 30-second elevator pitch: Tesla isn't just an EV company anymore, it's an AI powerhouse with robotaxis and Optimus robots set to explode margins while energy storage booms amid global electrification; at current levels, TSLA offers asymmetric upside as execution on autonomy unlocks trillions in TAM, making it a must-own for growth portfolios despite near-term volatility. 🌟
## Sources
- Polygon RESTClient financials and quotes (retrieved February 13, 2026)
- Web search results: TSLA analyst consensus (Yahoo Finance, Motley Fool, dated February 2026)
- Web search results: Tesla next earnings (Wall Street Horizon, dated February 2026)
- Web search results: Tesla TAM (ARK Invest, Motley Fool, dated February 2026)
- Web search results: Tesla market share (Electrek, Reuters, dated February 2026)
- Web search results: TSLA short interest (Fintel, Nasdaq, dated February 2026)
- Web search results: TSLA insider transactions (Yahoo Finance, MarketBeat, dated February 2026)
- Browse page: ir.tesla.com (summarized business and guidance, dated Q4 2025 earnings January 28, 2026)
- Web search results: Tesla upcoming events (YouTube, TopElectricSUV, dated February 2026)
- Web search results: TSLA historical P/E (Macrotrends, YCharts, dated February 2026)
- Web search results: Tesla competitive moat (TESMAG, Reuters, dated various)
- Web search results: Tesla growth drivers (Seeking Alpha, YouTube, dated February 2026)
- Web search results: Tesla macro impact (Seeking Alpha, Capital.com, dated February 2026)
- Web search results: Tesla accounting concerns (Electrek, Financial Times, dated March 2025)

TESLA: Market of Buyers
The charts are full of distraction, disturbance and are a graveyard of fear and greed which shall not cloud our judgement on the current state of affairs in the TESLA pair price action which suggests a high likelihood of a coming move up.
Disclosure: I am part of Trade Nation's Influencer program and receive a monthly fee for using their TradingView charts in my analysis.
❤️ Please, support our work with like & comment! ❤️

Tesla - Electric Car Rolling LowerWe continue the downside move described in several previous posts.
We are drawing a corrective wave of the larger move.
Inside the corrective wave, four impulse sub-waves have already formed, and we are now forming the fifth sub-wave.
Key levels:
408
393
368
The most probable completion zone appears to be between 393-368 , which corresponds to roughly 50-60% of the primary move.
The downside potential from current levels is estimated at 2-12% .
---
Please subscribe and leave a comment!
You’ll get new information faster than anyone else.
---

TESLA Massive Long! BUY!
My dear followers,
This is my opinion on the TESLA next move:
The asset is approaching an important pivot point 410.99
Bias - Bullish
Technical Indicators: Supper Trend generates a clear long signal while Pivot Point HL is currently determining the overall Bullish trend of the market.
Goal - 425.61
About Used Indicators:
For more efficient signals, super-trend is used in combination with other indicators like Pivot Points.
Disclosure: I am part of Trade Nation's Influencer program and receive a monthly fee for using their TradingView charts in my analysis.
———————————
WISH YOU ALL LUCK

Bearish Pressure Builds on TSLA — Short-Term Trade SignalQuantSignals Katy AI Stock Analysis
Analyzed 1 stock(s): TSLA
📈 TSLA Analysis
Current Price: $423.86
Final Prediction: $417.40 (-1.52%)
30min Target: $418.94 (-1.16%)
Trend: BEARISH
Confidence: 60.2%
Volatility: 19.9%
🎯 TRADE SIGNAL:
Direction: PUT
Entry: $423.86
Target: $418.69
Stop Loss: $430.21
Expected Move: -1.52%
Short-term (1–3 days): Slight bearish bias
1–2 weeks: Likely chop / range
Macro trend: Still structurally strong unless key support breaks.

TSLA Bearish Swing — Katy AI Signals Weakness🚀 QuantSignals Katy AI Stock Analysis
📈 TSLA Analysis
Current Price: $434.67
Final Prediction: $429.55 (-1.18%)
30min Target: $428.72 (-1.37%)
Trend: BEARISH
Confidence: 64.7%
Volatility: 8.2%
🎯 TRADE SIGNAL:
Direction: SHORT
Entry: $434.67
Target: $430.57
Stop Loss: $441.19
Expected Move: -1.18%

Short for TSLAElon says he wants to go to the moon; the tend shows that price is going to the gutter.

QS V4 Elite: Tesla Approaches Critical Gamma Inflection⚡ QS V4 ELITE | TSLA Weekly Tactical Setup
Neutral → Volatility Expansion Likely
Tesla is approaching a critical decision zone where conflicting institutional flows suggest a large directional move is near.
Direction: CALLS
Instrument: $415 Call
Expiry: Feb 06, 2026
Entry Zone: $7.35 – $7.50
Target 1: $9.30 (+25%)
Target 2: $11.90 (+60%)
Stop Loss: $5.50 (-25%)
🎯 Trade Thesis
Broad market strength supports risk assets
Weak dollar + risk-on volatility regime
Oversold momentum favors a tactical bounce
Katy AI projects a move toward $427
👉 Trigger: Reclaim of the $410–$411 VWAP zone
Risk Grade: MODERATE (Speculative positioning recommended)
QS V4 Intelligence:
⚡ Discordant signals typically precede high-velocity moves. Prepare for volatility.

Katy AI Flags Tesla Weakness — Bearish Pressure Building🚀 QuantSignals Katy AI Stock Analysis
Analyzed 1 stock(s): TSLA
📈 TSLA Analysis
Current Price: $417.61
Final Prediction: $414.60 (-0.72%)
30min Target: $414.77 (-0.68%)
Trend: BEARISH
Confidence: 54.8%
Volatility: 21.0%
Summary: Generated 0 trade signals from 1 successful analyses out of 1 symbols.

tsla potential bull flagtsla has been bouncing in this macro ascending triangle and are currently testing support.
it looks as if we are testing support inside a bull flag.
all we need is a solid conformation of a breakout.
if we fall though support and continue to range inside, we can invalidate the bull flag.
I will update if we have conformation of a breakout.

Garbage Return To the meanCurrent structure suggests distribution at the top of range, with repeated rejections near the upper boundary and higher lows being maintained. While trend is still bullish on a structural basis, price is extended far above long-term trend support, increasing the probability of a return to the mean before any sustained continuation.
TSLA - Not looking greatTSLA idea: trend break + bear flag under MAs (sell-the-rip until proven otherwise)
Tesla lost the major uptrend line and keeps getting rejected under the moving averages — that’s not “dip buy” behavior, that’s overhead supply.
Key map
Pivot / chop shelf: ~420
Line in the sand: 410.9 (LOD)
Downside magnets: 387.5 (BoS) → 379.3
If 379 fails: air pocket toward ~300 target zone
Invalidation / bull reclaim ladder: 429 → 436 → 442
(Reclaim + hold = shorts back off. Bigger trend repair near ~470.)
Plan
While below 429–442, I’m treating pops as rallies to sell.
A clean break/acceptance under 410.9 opens the path to 387/379.
Bulls need to reclaim 442+ to change the character.
Not financial advice — just levels + structure.

PFE & TSLAPhizer presents with a very strong uptrend that is in place. This
a great swing trade to put on.
Tsla is now reflecting its current correction. We are going to use its ETF inverse bearish position.
Please find more tradesetus especially on options at OSS.CC We do also a free nightly newsletter and a full service newsletter with a free two trial at OSS.CC
Happy Trading.
