THIS TESLA / BTC FRACTAL - IS A MAPThis is an expanded view of today's chart (posted earlier). I wanted to offer a broader context. On this "channel", I'm trying to focus on Tesla & related charts. Since I'm not posting anymore Tesla (single asset) charts, until a new all time high has been reached, I thought I would continue to pose questions in the meantime. Like "what is a fractal, mathematically?"...to encourage you to pull the curtain to the side and see the wizzard behind the curtain.
This isn't OZ, this is a digital casino, that has a casino agenda. If you don't know WHAT that is, and HOW that works, then should you really be investing your money. Until newbies figure that out & learn what is truly governing price action...I will try and provide some maps and share some of my *basic trading ideas with you. Most of all encourage you to educate yourselves and LEARN TA!
For those of you that have & will private message me with requests for shortcut secrets to success, I will ONLY say this.
1-Pick 1 asset
2-Start learning TA now, and apply it ONLY to your 1 asset
3-Study it's price action for 10,000 hrs (about 5 yrs full time)
4-Realize that the same patterns are repeating across all assets.
For those of you that are too busy or unmotivated to study:
If you dont want to work for your money, then how can you expect your money to work for you?
May the Trades be with you.
Tesla, Inc. Shs Cert Deposito Arg Repr 1/15 Sh
No trades
Trade ideas

Tesla (TSLA) – Technical Analysis OverviewHello friends, I haven't shared an analysis for a long time. I'm back in the market. Don't forget to follow me for my regular analysis.
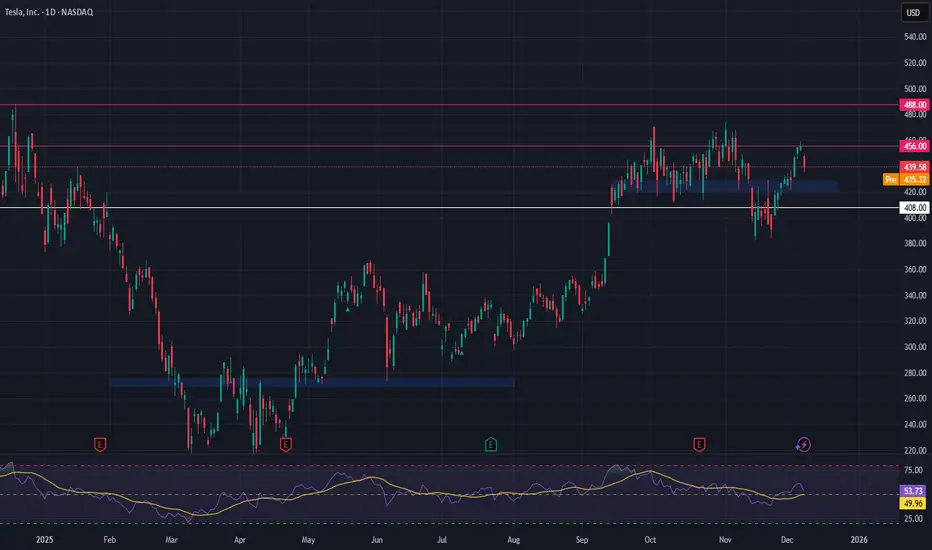
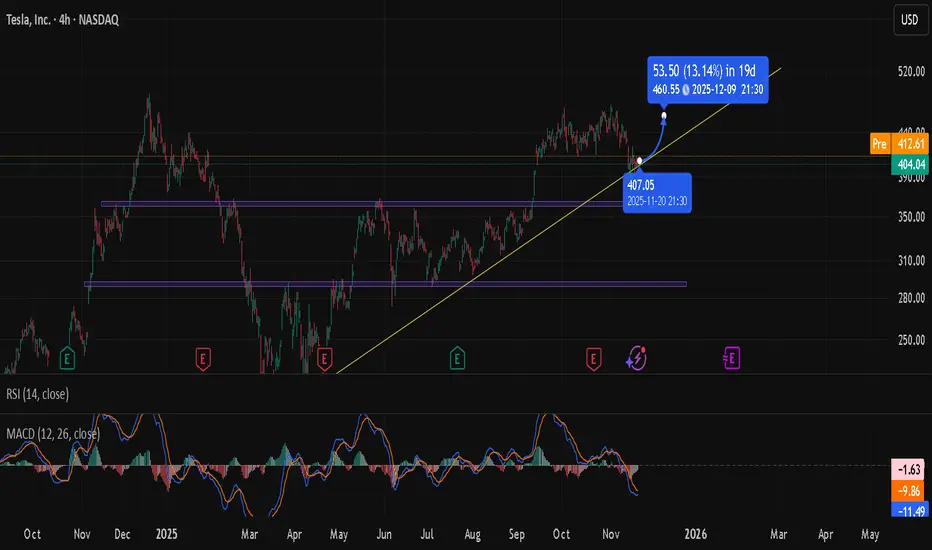
The chart shows that Tesla continues to hold its medium-term upward trend. The price recently tested the 408–410 support zone, which aligns with the rising trend line, and has reacted from that level. This area is technically significant, as it coincides with both trend support and a region where short-term liquidity has accumulated.
On the upside, the first notable resistance appears around 462–465. The projected ~13% potential move on the chart also points toward this region, suggesting that a rebound toward this level is plausible as long as the trend support remains intact.
Looking at the indicators:
RSI is currently within the 41–48 range, not in oversold territory but reflecting weakened momentum. This supports the idea that price is stabilising near a meaningful support area.
MACD remains in negative territory, indicating that bullish momentum has not fully recovered yet. A clearer shift toward the zero line would help confirm any sustained upward move.
In summary:
* The 408–410 zone is acting as a solid support.
* The broader trend structure remains intact and upward.
* 462–465 is the first major target area.
* However, momentum indicators are still soft, so confirmation through stronger candles would be constructive.
Volatility may remain elevated in the short term, but as long as the price stays above trend support, upward attempts appear more likely.
Disclaimer: This is a technical assessment only and does not constitute investment advice.*
TSLA: Another Major Pivot — 325 Is Calling..We successfully caught the 3rd November high, and now we expect the current high to form another pivot.
From this area, we anticipate a continuation to the downside, with 325 as the next major target.
Bearish momentum remains in control.

TSLA daily bullish divergenceNASDAQ:TSLA is consolidating below all-time high resistance, suggesting a breakout is coming.
Wave (2) appears complete at the High Volume Node support and 0.5 Fibonacci retracement with a bullish structre flip.
📈 Daily RSI hit oversold with bullish divergence
👉 Continued downside has a target of the daily 200EMA $362
Safe trading

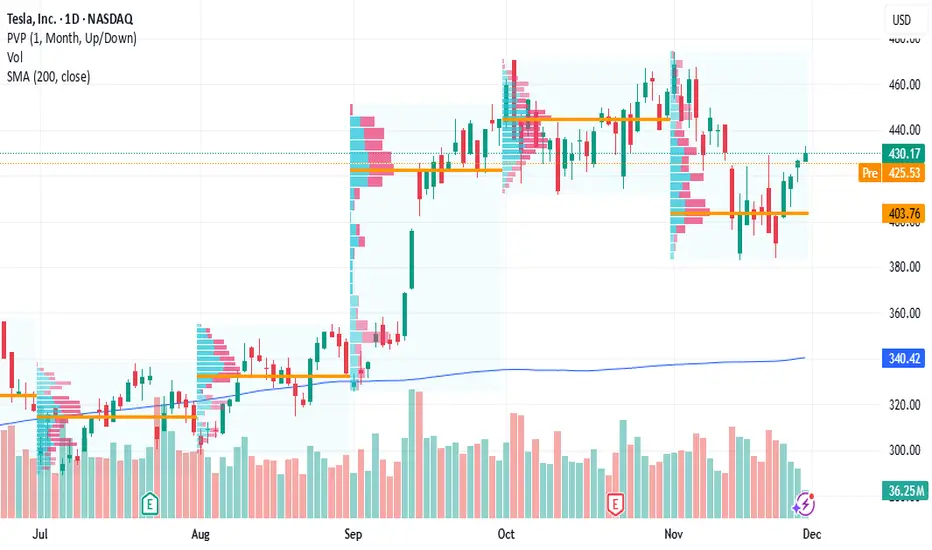
TSLA Gamma Structure and Key Reaction ZoneTesla (TSLA) stock has roughly $100 million of positive gamma exposure at the $450 strike, meaning a large concentration of call options is forcing dealers to buy shares as price moves upward toward that level, potentially creating a feedback loop that accelerates upside momentum. This “gamma wall” can act as a short-term magnet where price is drawn higher as hedging intensifies, but the effect is typically strongest only as long as spot price approaches or trades into that strike before options expiration.

Tesla preparing for all time highs?NASDAQ:TSLA Price is ranging below all all-time high, well above the weekly pivot and 200EMA, which is bullish.
Wave © of C appears to be underway into price discovery with a target of $730, the R2 weekly pivot. This is because it has been printing a series of 3 wave structures. Wave B printed a triangle, which is a pattern found before a terminal move, reinforcing the Elliot wave count.
🎯 Terminal target for the business cycle could see prices as high as $730 based on Fibonaci extensions
📈 Weekly RSI is just below overbought so has room to grow
👉 Analysis is invalidated if we close back below wave (B), $280
Safe trading

TSLA: Hold or SellHello Traders,
Regarding the technical point of view!
Telsa have been previously overbought. there are two resistances on its way! 1st the dynamic and 2nd the static one!
A triangle shape has been formed!
If you have it right now, I'm more with keeping it!
But you may find more profitable stocks to buy!

TESLA - Long - 528 / 611Tesla is still displaying the potential to fly higher.
As per our technical analysis we can find the stock has the potential to hit the levels of 528 and even to the levels of 611.
611 is a reversal level and hence we can expect some minor correction from that point.
Incase the stock fall from the current level of 430 , the best buying point is 348 /325.
From these levels we can expect a smooth ride towards the 528 levels.

THIS IS TESLA'S CHANCE TO RALLY! WILL IT HAPPEN NOW OR IN 2027?New evidence on Tesla stock shows that this is Tesla's final chance to rally for this market cycle of 2022-2026. We discuss whether or not this rally can happen now in the next few months
or if it will be delayed until 2027-2028.

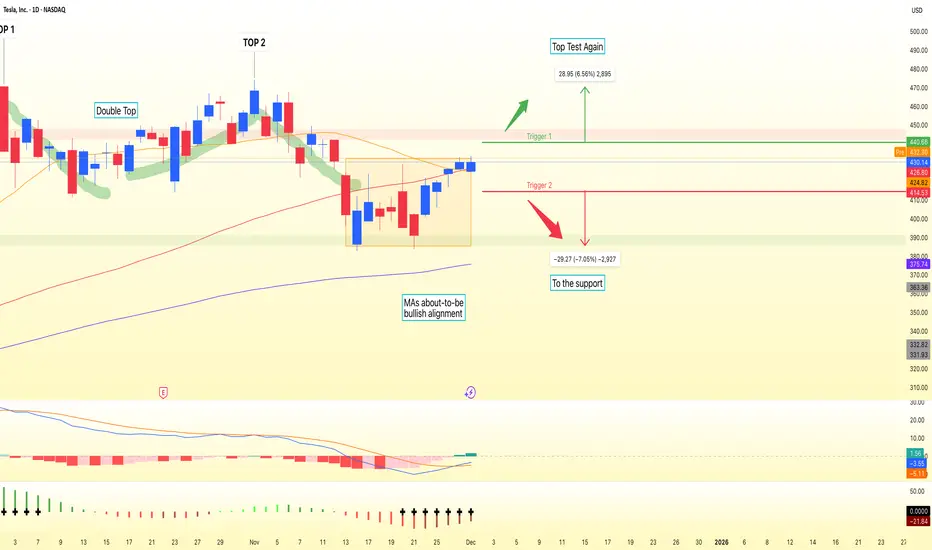
TSLA Range Breakout SetupTesla on the daily chart is stuck in a tight battleground between structure and momentum. Price is consolidating below the 20- and 60-day moving averages after a bearish Market Structure Shift in early November, while still holding above the long-term 120-day moving average. The result is a classic Bear Flag look: a sharp downside pole followed by a choppy, upward-sloping consolidation between the $400 demand zone and $440 supply zone.
As long as TSLA trades inside this band, it’s a range game. The primary path is continuation lower if the Bear Flag resolves as expected. A daily close below roughly $415 would put pressure on the $400 support and open the way toward the $385 area, aligning with the flag breakdown logic and recent downside momentum. For this bearish continuation view, a sustained close back above $430–440 would effectively invalidate the pattern and suggest sellers are losing control.
On the flip side, a clean daily close above $440 would flip the script, clearing both key moving averages and turning the zone into support. That breakout could unlock a move toward the prior October swing region around $470, with the idea invalidated if price drops back into the range and especially below $400. This is a study, not financial advice. Manage risk and invalidations.
Thought of the Day 💡: Often the edge is in letting the market show its hand at the extremes of the range, not in guessing the next candle.
-------------------------
Thanks for your support!
If you found this idea helpful or learned something new, drop a like 👍 and leave a comment, I’d love to hear your thoughts!
Going Short TESLA HereTrading Fam,
I'm taking my first ever short here since implementing my new indicator. It has been killing it on the long side. We've exited our last 17 trades, all for wins, with an average profit of 30% per trade and our portfolio is up over 86% on the year. Now, it's time to test the short signals. We received two here on TSLA. I've taken a small entry since this is my first short, representing around 9% of the portfolio total. I'm going to target $350 but will not take more than a 7% loss, thus my stops are set at $476 bring the rrr on this trade entry to 1:3. Let's see how this goes.
✌️Stew

TSLA Post-Earnings Momentum – Don’t Miss!TSLA QuantSignals V3 – Weekly Trade Alert (2025-12-02)
Trade Direction: BUY CALLS (Bullish)
Confidence: 65% | Conviction: Medium
Recommended Strike: $430.00
Entry Range: $7.35
Target 1: $11.68 | Target 2: $15.43
Stop Loss: $5.11
Expiry: 2025-12-05 (3 days)
Position Size: 2% of portfolio
⚠️ Risk & Conflict Notes
Katy AI shows neutral bias with subtle bearish trend (-0.89% predicted move, 50% confidence), conflicting with bullish weekly momentum.
RSI overbought at 74 → potential pullback risk.
Options flow bearish (PCR 1.60) suggests institutional hedging; size position carefully.
Moderate risk warning: trade requires monitoring due to conflicting signals and short expiry.
💡 Trade Insight
Weekly bullish momentum +1.65% with trending regime supports short-term upside potential.
Technicals: MACD histogram bullish, VWAP support at $428.73, price near 91.6% of weekly range.
Timing advantage: leverage short-term momentum with 3-day expiry options.
Balanced delta (0.515) and tight stop loss help mitigate downside risk.

$TSLA: $350 Target - $380 Short (Support Breaking)The support for Tesla seems to be breaking, and the oscillators are due for a negative downtrend along with the RSI close being too high. The analysts at the same time are neutral and this has been given a buy over a strong buy target with catalysts like lower earnings in some countries and a lack of competitive advantage over BYD for actual output of vehicles produced and sold. Management is also unsure of Musk who has a huge multitrillion dollar pay package incentive which will make the company even lower on cash. Therefore, the next target for a NASDAQ:TSLA short in my opinion, is $380 or less within Q1 of 2026. As always, none of this is investment or financial advice. Please do your own due diligence and research.

TSLA Weekly Trade Snapshot: Bullish MomentumTSLA Weekly Signal | 2025-12-01
Instrument: TSLA
Direction: CALL (LONG)
Strike Price: $430.00
Entry Price: $9.50
Profit Target 1: $15.20 (60% gain)
Profit Target 2: $19.00 (100% gain)
Stop Loss: $6.65 (30% loss)
Expiry: 2025-12-05 (4 days)
Position Size: 2% of portfolio
Confidence: 65%
Weekly Momentum: BULLISH (+1.07% 1W)
Flow Intel: Bearish, PCR 1.56
Katy AI Prediction: Neutral (-0.91% predicted move)
Risk Level: MEDIUM – conflicts between Katy AI neutral and bullish technicals

TSLA at a Tipping Point – Dec 1–5 OutlookWeekly – Momentum Still Up, But Cooling
TSLA has been trending cleanly off that long-term bullish structure break from $380s. The weekly candles are still holding higher lows, but last week showed a slowdown — smaller candle body, longer top wick. That usually means buyers are still there, but not as aggressive as earlier in the run.
Important zones:
* $430–432: current reaction zone
* $474–475: next weekly supply
* $368: major weekly demand if things pull back deeper later
Overall weekly tone → still bullish, but losing steam.
Daily – Retesting the Broken Structure
Daily shows the clearest picture: TSLA rejected the supply zone above $450 and came back down to retest the broken structure around $420–425. Buyers stepped in, but it isn’t a full reversal yet. Price is still inside a broad daily supply zone.
Daily key levels:
* Resistance: $440 → $455
* Support: $422 → $412
Until price fully clears above the supply zone, TSLA has limited upside.
1-Hour – Grinding Up, But Inside a Tight Path
The 1H trend is still intact with a rising channel, but the last few candles show exhaustion near $430. Multiple touches on the upper trendline show sellers defending that area. Buyers are still pushing, but they’re losing momentum on each attempt.
The moment $426–427 breaks, downside opens quickly.
Short-term 1H levels:
* Breakout: above $432–433 → next extension $440
* Breakdown: below $426 → fast drop toward $420
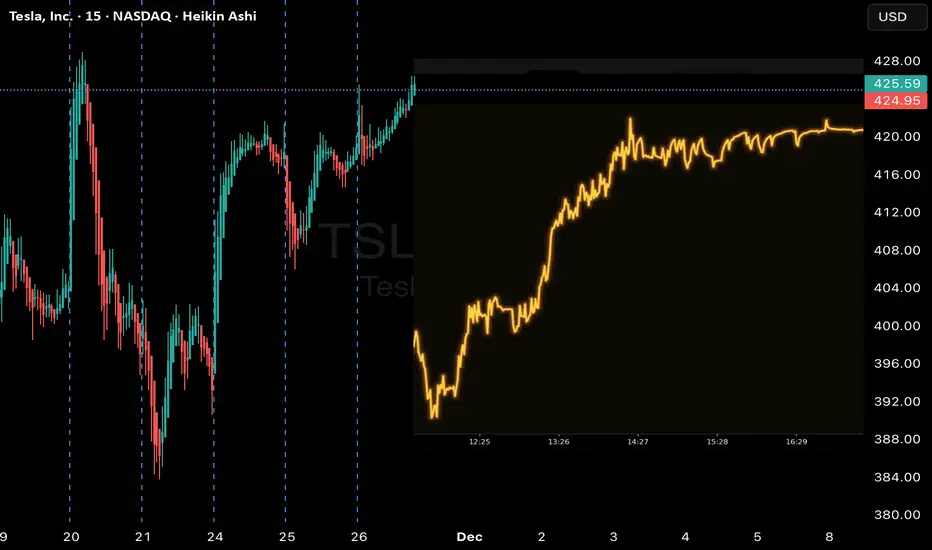
15-Minute – Compression Before a Move
The 15m shows price trading sideways after a clean BOS move earlier. That compression usually leads to a quick breakout or breakdown. The fact that price keeps tapping the same resistance near $430 without clearing it shows hesitation.
The 15m favors breakout continuation IF buyers step in with volume.
Otherwise, it slips back to $426–424 easily.
GEX – Where Options Traders Force the Move
This is where TSLA becomes interesting.
On the GEX map:
* Highest positive GEX sits at $432–435 → magnet + resistance
* Second CALL wall around $450 → possible extension point
* Heavy PUT support around $410–400 → strong buyer zone
* Another deep PUT wall at $380 → major support
What GEX is telling:
* As long as TSLA stays under $432–435, market makers lean neutral-to-slightly bearish.
* If price breaks above $435 with force, gamma flow can push it into $445–450 quickly.
* If price breaks below $426, you get negative gamma momentum pushing it straight toward $415–410.
This aligns well with the TA structure — both are pointing at the same “pressure valve.”
Trading Thoughts – Dec 1–5
Bullish Setup
* Needs a clean break + hold above $432–433
* Target 1: $440
* Target 2: $450 (CALL wall)
* Stop zone: below $426
Call idea (short-dated, aggressive)
TSLA 440C or 445C — ONLY if it breaks $433 with volume.
Bearish Setup
* If price loses $426, sellers take control.
* Target 1: $420–422
* Target 2: $410 (strong GEX PUT support)
* Target 3 (bigger move): $400
Put idea (conservative)
TSLA 420P → safest
TSLA 410P → higher risk but bigger payoff
Only valid if breakdown happens, not before.
Overall Outlook for Dec 1–5
TSLA is sitting at a decision level.
Everything lines up:
* Weekly: slowing momentum
* Daily: retesting previous structure
* 1H: exhaustion underneath resistance
* 15m: compression before a move
* GEX: clear walls at $435 (cap) and $410 (floor)
The move will be clean once direction is chosen.
This setup is perfect for option traders who wait for confirmation instead of guessing.
Disclaimer
This analysis is for educational purposes only, not financial advice. Always trade with your own risk management and confirmation.

Tesla bullish momentum points to $435 test this weekCurrent Price: $402.77
Direction: LONG
Confidence Level: 66% (Several traders lean bullish with clear near-term upside targets, but mixed caution at resistance)
Targets:
- T1 = $418
- T2 = $435
Stop Levels:
- S1 = $397
- S2 = $382
**Wisdom of Professional Traders:**
I've been pulling together what multiple professional traders are saying about Tesla, and the collective picture leans bullish in the short term. Several traders noted higher highs, higher lows in recent sessions and upside potential toward $435, even as they warn of possible resistance around $440. That said, the consensus is that as long as price stays above key supports like $397 and the more distant $382 zone, the bulls have control in this current weekly window.
**Key Insights:**
Here's what's driving this view: The price action is showing a clean pattern of higher highs and higher lows, with a possible push into the 430s before facing any major resistance. Traders are watching the 418–420 zone as a near-term waypoint; holding above it keeps the rally intact. The bullish sentiment is supported by patterns like weekly inside bar breaks to the upside and even a potential monthly cup-and-handle if deeper supports hold.
What's interesting is that even the cautious voices—those pointing out the rising wedge formation—still expect a run into the 435 area before any meaningful rejection. This gives the long side some breathing room this week, especially with key support levels unbroken. The fact that several traders identified the same upside levels increases the conviction in these targets.
**Recent Performance:**
Tesla gained nearly 10% recently, rebounding strongly from the lows and moving toward the important 418–420 support-resistance pivot. The stock is up significantly year-to-date—over 80% from certain analyses—with the latest breakout above prior consolidation bringing more buyers in. This rally is happening in line with broader market strength, as the NASDAQ, SPY, and even small caps have put in solid gains.
**Expert Analysis:**
Multiple traders see the near-term chart setup as constructive. A few pointed to a bullish breakout above $412.50 that sets the stage for higher moves, while others emphasized the importance of holding above the 50-day moving average. The $397 level repeatedly comes up as a line in the sand; lose that, and downside targets in the 370s might come back into play, but for now that level is intact. Upside calls cluster around $435, with extensions to $440 if momentum remains.
**News Impact:**
There's no major fresh headline driving Tesla right now, but the background tone includes optimism about potential chip partnerships and continued EV growth. Market-wide, traders are eyeing Fed policy signals from Jerome Powell's recent comments, which could influence momentum stocks like Tesla. With no adverse company-specific news, Tesla rides the tailwinds of a generally bullish tech market.
**Trading Recommendation:**
Given the collective trader analysis, I'd go LONG here with a first target at $418, locking in partial profits there, and a second target at $435. Stops go just below $397 to protect against sharp reversals, with a secondary stop near $382 if volatility spikes. The price pattern and widespread trader agreement on these levels make this a reasonable bullish setup for the week, but watch that 435–440 band closely for possible rejection.
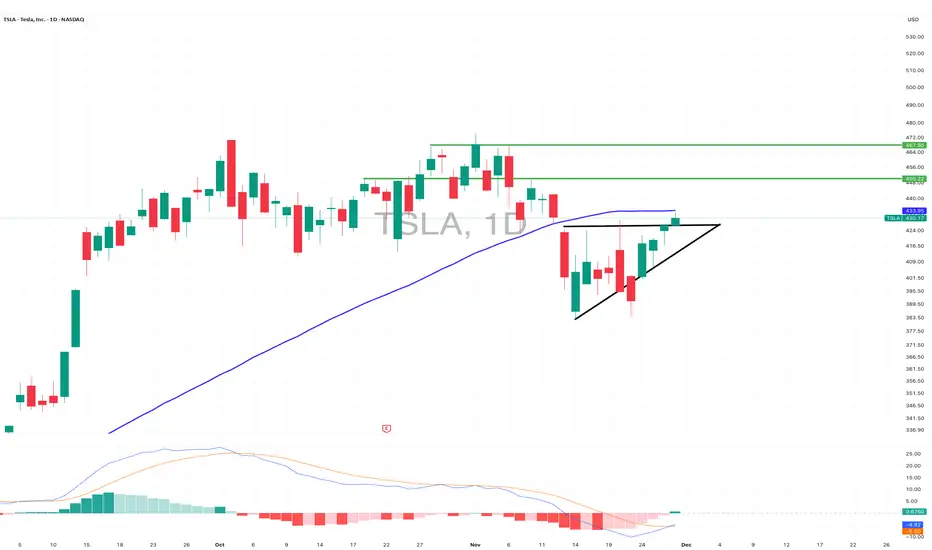
$TSLA Weekend analysis - 30th Nov, 2025NASDAQ:TSLA broke out of its ascending triangle on Friday and is now pushing toward the 50D SMA. It needs to reclaim and close above 433.95 to keep the momentum going.
If it clears that level, the next targets I’m watching are 450.22 and 467.82. The MACD also confirmed a bullish crossover on Friday, which supports the case for more upside.
TSLA: Navigating Key Support and Resistance Levels for Future Mo
Title:
TSLA: Navigating Key Support and Resistance Levels for Future Moves
Greetings, Traders!
🌟 Hello everyone,
As we analyze Tesla (TSLA), we observe critical support and resistance levels that are shaping the current price action. Understanding these levels can help traders navigate TSLA's potential movements effectively.
NASDAQ:TSLA
Key Observations:
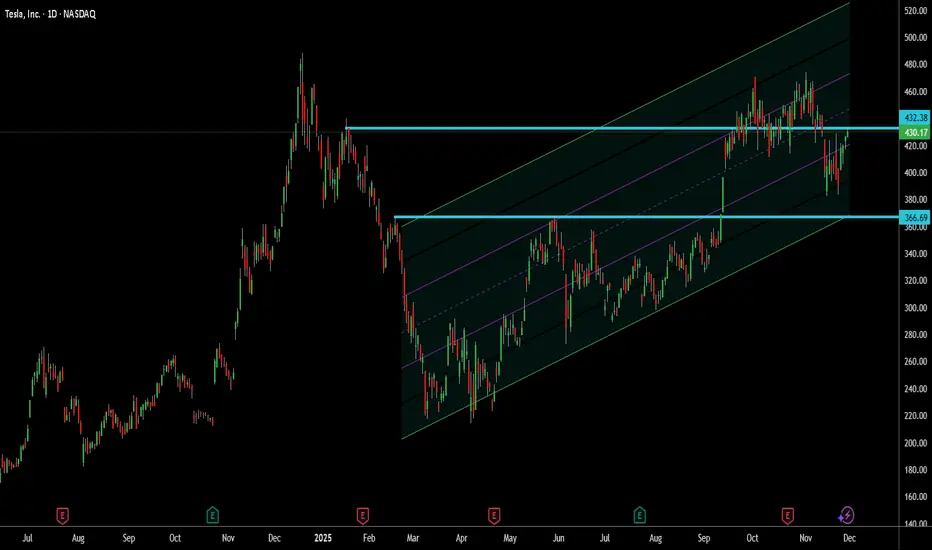
- TSLA has moved significantly from ** 220 ** to ** 500 **, reflecting strong bullish momentum.
- The key support and resistance levels are identified between ** 366 ** and ** 430 **, providing crucial areas for potential price reactions.
- An upward channel with four distinct slopes—inner slope for short-term and outer slope for long-term—helps in identifying optimal entry and exit points.
Technical Analysis:
The price action of TSLA respects the upward channel, indicating that the stock is moving within defined boundaries. If TSLA breaks above the ** 430 ** resistance, the next target is ** 460 **. However, a minor pullback might occur before the upward movement continues.
Fundamental Factors:
While technical levels are crucial, it's also essential to consider Tesla’s fundamental strengths, including innovation, market share, and overall industry trends. These factors contribute to the long-term bullish outlook.
Trading Strategies:
Traders may consider positioning long near the support at ** 366 ** and watching for confirmation of the breakout above ** 430 **. If the price faces bearish pressure, ** 366 ** will serve as a critical support level.
In Conclusion:
With TSLA navigating key support and resistance levels, traders should stay alert to potential breakouts and pullbacks. By leveraging the channel slopes and maintaining a disciplined approach, traders can capitalize on the opportunities ahead.
Engage with Us:
🟢 If you find this analysis insightful, please give it a LIKE.
🟡 Don’t forget to FOLLOW for more updates.
🔵 SHARE with fellow traders who might benefit from this information.
🔴 Feel free to COMMENT with your thoughts and insights!
Your active participation enriches our trading community, fostering knowledge exchange and collective growth. Share your feedback and ideas in the comments below or by boosting this post.
Looking forward to connecting with you in the next post.
Happy trading!
TSLA — Bullish Above 317.77, Targeting 544.53TSLA maintains a bullish structure as long as price holds above the key zone at 317.77.
This level represents the foundation of the current upward leg and serves as the invalidation point for the broader trend. As long as buyers protect 317.77, upside continuation remains the dominant scenario.
Price is currently reclaiming the 0.5 Fibonacci level at 424.43. A sustained close above this area strengthens bullish momentum toward 452.77 (0.618), followed by 472.47–484.48 (0.7–0.75). A breakout above these mid-range levels would open the path toward the major extension target at 544.53.
In a bearish scenario, price cannot break above the key support zone; any rally into it while trading below would be considered only a corrective bounce.
But as long as 317.77 holds, the primary outlook remains bullish.

TSLA: Get ready...It doesn't get much prettier than this.
Textbook technical set up for some price discovery.
All that's needed is some sort of catalyst (say... FSD expansion warp speed?)
No trade advice. 607 PT.

Tesla Long Alert: Katy AI Projects Upward MomentumTSLA QuantSignals Katy 1M Prediction 2025-11-26
Ticker: SPY
Signal Type: Daily / Weekly
Direction: BULLISH / BEARISH / NEUTRAL
Confidence: 0%
Current Price: $0.00
Entry: $0.00
Targets:
T1: $0.00
T2: $0.00
Stop Loss: $0.00
Expiry: (If using options)
📈 TradingView Information — Template 2 (Advanced)
📉 Trend:
Primary Trend: XX
Volume Strength: XX
Volatility Index: XX
Momentum Score: XX
🎯 Signal Levels:
Buy Zone: $0.00 – $0.00
Risk Zone: $0.00
Profit Zone 1: $0.00
Profit Zone 2: $0.00
📌 Analyst Note:
Short summary (e.g., “Momentum weakening, approaching supply zone.”)
🚀 TradingView Information — QuantSignals Style
Ticker: SPY
Final Prediction: $0.00 (±0.00%)
30min Target: $0.00 (±0.00%)
Trend: BULLISH / BEARISH / NEUTRAL
Confidence: 0.0%
Volatility: 0.0%
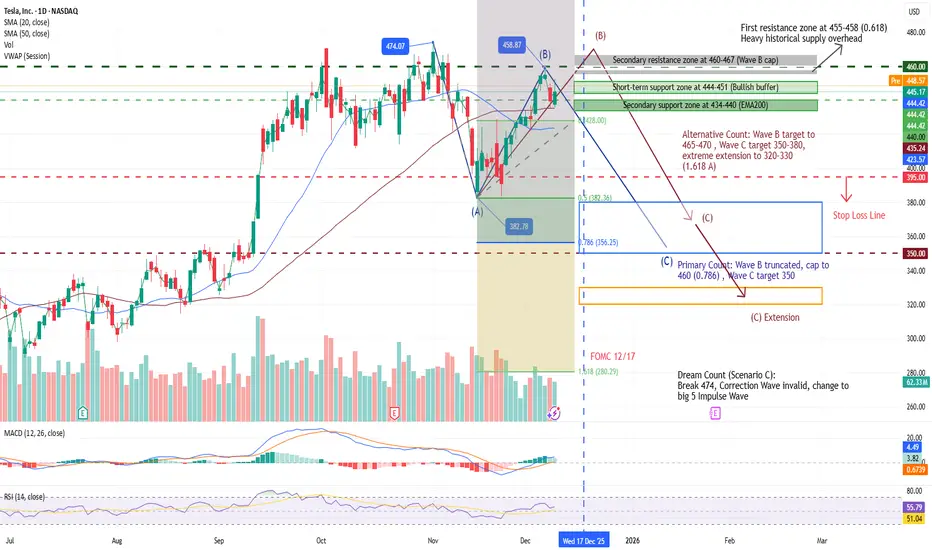
TSLA Elliott Wave Update: B-Wave Truncation at 460 or Extension TSLA Elliott Wave Update: B-Wave Truncation at 460 or Extension to 465?
TSLA's rally from the 383 low has tested the 61.8% Fib at 458, forming a potential B-wave top in the A-B-C correction from the 474 high. EMAs provide dynamic support, but MACD/RSI mild divergence signals momentum fade.
Primary Count: B-wave truncates at 460 (0.786 Fib), capping the rally short; current pullback signals C-wave start, targeting 350 (1.0 extension of A). Volume below 1.5B shares on 455 test reinforces failure—odds of C to 350 rise to 70%. Short-term support at 444-451 (bull buffer).
- Resistance: Primary 455-458 (0.618 Fib + heavy historical supply); Secondary 460-467 (B cap, EMA50 crossover). Volume surge >1.5B needed for break.
- Support: Secondary 434-440 (EMA200 channel low).
- Indicators: MACD (12,26,9) red bars narrowing to 0.32 hints exhaustion; RSI (14) at 68 with bearish divergence warns pullback. Volume MA shows low conviction above 455 (1.3B vs. 1.5B threshold).
Alternative Count: B-wave extends to 465-470 (0.786-1.0 Fib), then C pulls back to 350-380 (1.0 extension) or 320-330 (1.618 A extreme). Probability 25-30%, up on recent strength.
Scenario C: B exceeds 474 on volume >1.5B, invalidating correction for 5-wave impulse: Wave 3 to 520 (1.618x Wave 1, Jan 2026); Wave 5 to 600+ (Q2 2026). Probability 30-35%.
Monitoring: 12/17 FOMC rate cut catalyst.
Disclaimer: This analysis is for educational purposes only and is not investment advice. Please do your own research (DYOR) before making any trading decisions.
Tesla Rejected at Key Breakout — Bullish Structure Still Intact NASDAQ:TSLA just got rejected at a major breakout level, but the bigger picture remains bullish. Price action shows a healthy uptrend with momentum building, suggesting this could just be a pause before continuation. As volume trends higher on dips, it hints that buyers are still active—just waiting for cleaner levels.
📅 With the FOMC coming up, expect potential de-risking or volatility across markets. That could drag TSLA lower short term, but it also opens the door for a cleaner entry near strong support. Watching the $421–$428 range for signs of a bounce or consolidation.
🔽 Trade Plan
Entry Zone: $421 – $428
Take Profit 1: $456
Take Profit 2: $488
Stop Loss: $408