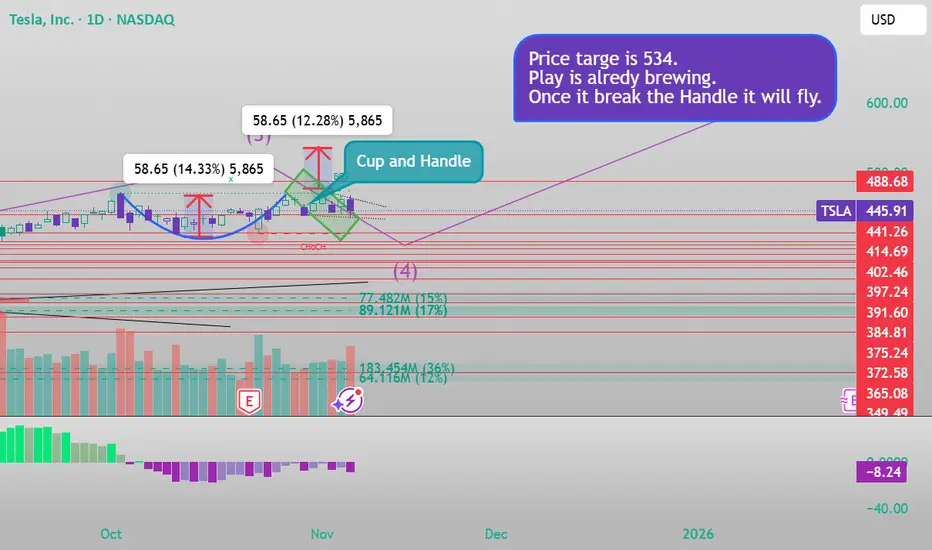
Cup and handleYou can see the cup and Handle in the Daily timeframe. It Will fly soon. My price target is 534 once it break the handle. You see this here at first.
X
@Sandeep194924
Trade ideas
Dip to 449 and revers along with RSI divergenceTSLA can di tomorrow to 449 and reverse. a great swing possible with 449 entry l;eading to 460+
A short-term buy tradeCould this be a short-term buy trade?
Stop loss below $411.
The target profit could be around $670. Exiting in case of a change in conditions midway is also possible.

Emotional Trading AreaBehavior Analysis combined with your price-action trading skills can help tremendously in making your trading decisions. I believe that candlestick wicks (shadow) show us where traders will act emotionally before executing their trades. These wicks indicate earlier price rejection and create and area where emotions take over before execution. Decision time.

Tesla: Potential Breakout Coming?Tesla has consolidated for more than two months, and some traders may think a breakout is coming.
The first pattern on today’s chart is the $436.23 level, a previous record weekly close from December. The EV maker has fluctuated on either side of that price since late September without backing down. Is long-term resistance fading?
Second, TSLA has made higher highs and mostly higher lows since October 10. (The only exception came on October 23 following quarterly results. Even then, prices quickly recovered from the opening drop.)
Third, the 8-day exponential moving average (EMA) has stayed above the 21-day EMA. That may reflect a bullish short-term trend.
Next, Wilder’s Relative Strength Index (RSI) has moderated from above 80 while staying over 50. That may suggest an overbought condition has faded without direction turning south.
Finally, TSLA is an active underlier in the options market. (Its average volume of 2.3 million contracts per session ranks second in the S&P 500, according to TradeStation data.) That could help traders take positions with calls and puts.
TradeStation has, for decades, advanced the trading industry, providing access to stocks, options and futures. If you're born to trade, we could be for you. See our Overview for more.
Past performance, whether actual or indicated by historical tests of strategies, is no guarantee of future performance or success. There is a possibility that you may sustain a loss equal to or greater than your entire investment regardless of which asset class you trade (equities, options or futures); therefore, you should not invest or risk money that you cannot afford to lose. Online trading is not suitable for all investors. View the document titled Characteristics and Risks of Standardized Options at www.TradeStation.com . Before trading any asset class, customers must read the relevant risk disclosure statements on www.TradeStation.com . System access and trade placement and execution may be delayed or fail due to market volatility and volume, quote delays, system and software errors, Internet traffic, outages and other factors.
Securities and futures trading is offered to self-directed customers by TradeStation Securities, Inc., a broker-dealer registered with the Securities and Exchange Commission and a futures commission merchant licensed with the Commodity Futures Trading Commission). TradeStation Securities is a member of the Financial Industry Regulatory Authority, the National Futures Association, and a number of exchanges.
Options trading is not suitable for all investors. Your TradeStation Securities’ account application to trade options will be considered and approved or disapproved based on all relevant factors, including your trading experience. See www.TradeStation.com . Visit www.TradeStation.com for full details on the costs and fees associated with options.
Margin trading involves risks, and it is important that you fully understand those risks before trading on margin. The Margin Disclosure Statement outlines many of those risks, including that you can lose more funds than you deposit in your margin account; your brokerage firm can force the sale of securities in your account; your brokerage firm can sell your securities without contacting you; and you are not entitled to an extension of time on a margin call. Review the Margin Disclosure Statement at www.TradeStation.com .
TradeStation Securities, Inc. and TradeStation Technologies, Inc. are each wholly owned subsidiaries of TradeStation Group, Inc., both operating, and providing products and services, under the TradeStation brand and trademark. When applying for, or purchasing, accounts, subscriptions, products and services, it is important that you know which company you will be dealing with. Visit www.TradeStation.com for further important information explaining what this means.

TSLA-Bulls Fighting for Expansion (Nov. 3–7)TSLA Weekly Grind Into Call Walls – Bulls Fighting for Expansion (Nov. 3–7)🚀
WEEKLY TIMEFRAME ANALYSIS
1. Market Structure
TSLA continues its broader bullish expansion on the weekly, confirming a strong BOS over prior swing highs. The previous CHoCH signal was neutralized quickly, and price reclaimed its multi-month trend. This behavior suggests smart money has been accumulating below $400, not distributing. Every dip toward structure is met with aggressive absorption.
Liquidity remains stacked below $368–$380 — that’s the major sweep zone if the market wants to reset. Above, we’re probing into fresh supply pockets where early profit-taking tends to show up.
2. Supply & Demand / Order Blocks
Key weekly demand sits at:
• $368–$380
Next deeper mitigation zone:
• $214–$240 (nuclear flush level, unlikely near-term)
Supply is forming in the $470–$490 band. That’s where we saw previous structural stalling and stop-hunts. A breakout through that area tends to squeeze because overhead liquidity thins dramatically into $500+.
3. Indicator Confluence
The 9EMA is pressing above the 21EMA with a positive slope. Momentum remains constructive. MACD histogram is gaining green bars — sign of acceleration rather than exhaustion. Stoch RSI is elevated, but trending with price rather than diverging.
Volume is rising on bullish candles, falling on red — healthy expansion.
4. Weekly Tone
As long as price holds above $450, bulls maintain continuation potential. Below that, sentiment can shift quickly.
DAILY TIMEFRAME ANALYSIS
1. Market Structure
Daily structure remains bullish inside a rising channel. We’ve seen clean swings respecting both upper and lower bands. A minor CHoCH attempt formed last week but failed — price reclaimed structure and printed another bullish push.
Smart money likely accumulated around $443–$447, intentionally sweeping intraday liquidity.
2. Supply & Demand / Order Blocks
Demand blocks:
• $443–$446 (recent defense cluster)
• $420–$425 (major re-accumulation base)
Supply blocks:
• $470.75 and $488.54
These levels are littered with trapped short sellers — perfect squeeze fuel if reclaimed.
3. Indicator Confluence
9EMA is curling upward again after a brief flattening. This typically telegraphs another leg. 21EMA remains supportive. MACD histogram is transitioning with softer red bars — momentum is attempting to flip. Stoch RSI just curled from the bottom band — a strong short-term tailwind.
Volume is building — no signs of distribution.
4. Daily Tone
As long as we hold the mid-channel, upside targets remain active. A close above $470 opens the door to $488+ momentum rotation.
15-MINUTE INTRADAY STRUCTURE
1. Market Structure
On the 15m we printed a clean CHoCH → BOS sequence into the afternoon. Buyers responded aggressively after sweeping liquidity near $444. That wick was engineered — too clean to be random.
We’re currently compressing into a small consolidation shelf just below $457.80. A breakout from this range can run quickly, especially during the morning session when algo volatility peaks.
2. Supply & Demand / Order Blocks
Demand intraday:
• $453.50–$454.30 (first bounce zone)
• $443.70–$444.50 (deep retest)
Supply intraday:
• $457.50–$460.00 (thin liquidity + short triggers)
Above that, things get slippery.
3. Indicator Confluence
9EMA has crossed above 21EMA on the micro timeframe. MACD histogram is curling back toward zero, preparing for potential bull expansion. Stoch RSI is lifting — early signal before momentum enters.
4. Intraday Tone
Expect a morning liquidity grab — minor dip, then reversal if demand holds. If price immediately rejects from $458 with heavy volume, avoid chasing.
GEX (Gamma Exposure) & OPTIONS SENTIMENT
Gamma structure favors upside skew. Notable call walls:
• $467
• $480
• $500
These behave like resistance magnets — price accelerates into them, but sticky walls can cap continuation.
On the downside:
• $435 is serving as major put support
Break it, and dealer hedging flips negative.
Dealer behavior this week:
• Above $457 → hedging becomes supportive, fueling squeezes.
• Below $445 → hedging flips bearish, accelerating direction.
Max pain gravitates toward $450. That’s why price keeps pulling back into that zone — the options market likes to magnetize into pain.
Best ways to play inside this structure:
• Directional call scalps above $457.50
• Debit spreads for controlled risk
• Neutral premium if price chops $450–$456 midweek
TRADE SCENARIOS (Nov. 3–7)
✅ Bullish Setup
Trigger: Break and hold above $457.80
Entry: Retest $457–$457.30
Targets: $467 → $480 → possible $488 wick
Stop: Below $454.00
Invalidation: Failure to reclaim 9EMA on 15m after breakout
✅ Bearish Setup
Trigger: Breakdown below $445** with volume**
Entry: Retest $445–$446
Targets: $435 liquidity sweep → $420 OB
Stop: Above $448.50
Invalidation: Strong reclaim of 15m structure
CLOSING OUTLOOK
TSLA is setting up with bullish intent, but it’s running into layered supply and options-driven friction overhead. If bulls can convert $457 into support, this can squeeze into $467 and potentially push $480 where call walls cluster.
If the market decides to hunt liquidity, $445 is the first trapdoor.
Personally, I’m watching the channel midline. If buyers defend it, momentum strategies are favored. If we break it, expect a multi-day rotation lower.
DISCLAIMER
This analysis is for educational purposes only and not financial advice. Trade your plan, manage your risk, and stay disciplined.

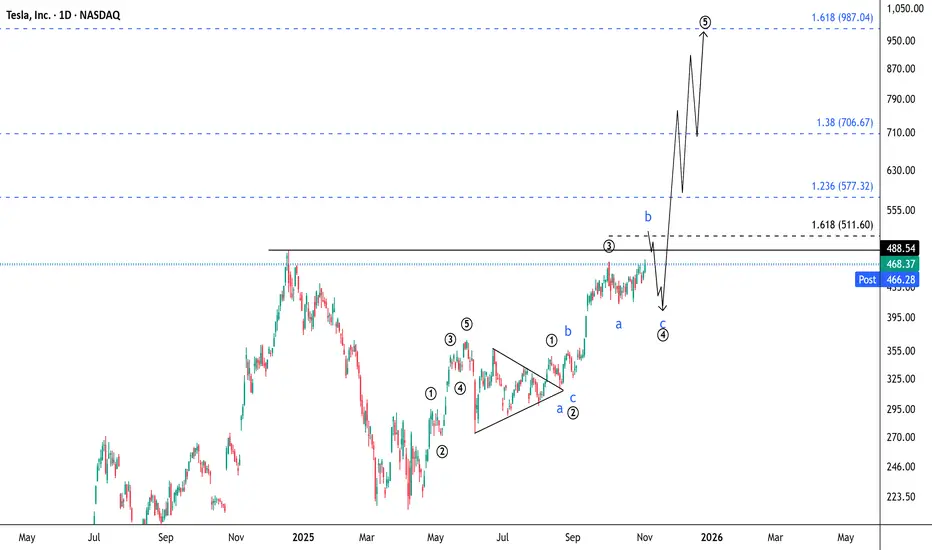
Tesla: A little Bit of Elliott Analysis Hello ,
Currently, Tesla is correcting in a wave (4), which is expected to end around the $(390-430) area.
After that, it will likely start wave (5), with the following possible targets:
1) 1.236 Fibonacci level $(577) .
2) 1.382 Fibonacci level $(706) .
3) It may even extend to the 1.618 Fibonacci level around $(987) .
After completing the fifth wave, the stock is expected to collapse and enter a deep, long correction.
Thank you .
C&H on TESLABuy and hold, strong move towards 700-800 USD
CUP and HANDLE PATTERN USUALLY HAS HIGHEST PROBABILTY TO BREAK UPSIDE

TeslaI have taken 2 time frames to get confused. 😇 The 15-minute time frame shows a resistance breakout out and the hourly time frame shows a descending channel resistance.
It is always better to take less risky trade entries.
If the price is unable to break the channel's resistance and fall, watch whether the price is showing bullish strength around the 440 to 444 zone. If there is bullish strength, buy above 445 with the stop loss of 440 for the targets 449, 454, 459 and 464.
Always do your analysis before taking any trade.

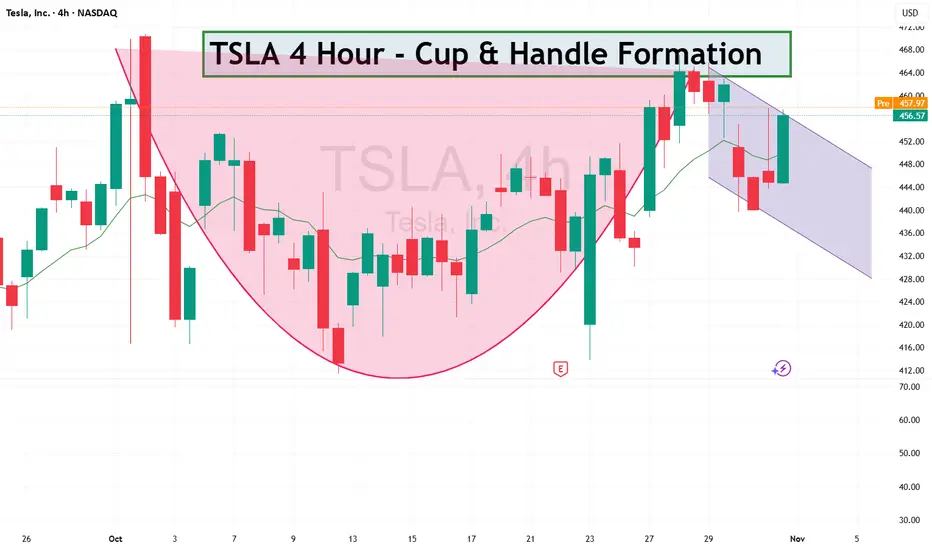
TALS - Cup and Handle FormationTSLA looks quite bullish, as you can see cup and handle formtion on 4 hour.
#TSLA #Tesla #Stocks #Trading #StockMarket #TechnicalAnalysis
TSLA Is Building Momentum Toward New HighsTesla continues to show strong momentum, with higher lows forming across recent sessions. The trend structure remains constructive, and momentum indicators are pointing toward a possible extension toward new highs in the coming week i.e. $500+
According to my Trade Navigator model — a data-driven system that tracks breakout momentum and overall market strength; the readings remain elevated, suggesting that bulls still have room to run.
A sustained close above recent resistance could confirm the next leg higher.
(Educational content only — not financial advice.)
#TSLA #stocks #TradeNavigator #Momentum
Tesla Share Price at Key Technical LevelTesla’s share price has returned to a well-established upward trendline. The key question now is: will this trendline act as support and trigger a bounce, or will it be breached, attracting further selling pressure and pushing the price lower?
We’d love to hear your thoughts — will the bulls defend this level, or are the bears gaining ground?
TESLA COULD BREAK $500 IMMINENTLYIn this video, we look at the current setup on Tesla and I give my reasoning on why we are bullish

TSLA QuantSignals V3 Swing 2025-11-01TSLA QuantSignals V3 Swing 2025-11-01
TSLA Swing Signal | 2025-11-01
• Direction: BUY CALLS | Confidence: 55%
• Horizon: 20 days to 2025-11-21
• Strike Focus: $425.00
• Entry Range: $43.52
• Target 1: $65.28
• Stop Loss: $32.48
• 1W Move: -0.44%
• 2W Move: +0.11%
• Volume vs Prior Swing: 0.8×
• Swing Range: $439.61 - $467.00
• 🔴 HIGH RISK WARNING: Use only small position size due to lower confidence and high uncertainty.
⚖️ Compliance: Educational swing commentary for QS Premium. Not financial advice.
🎯 TRADE RECOMMENDATION
Direction: BUY CALLS
Confidence: 55%
Conviction Level: LOW
🧠 ANALYSIS SUMMARY
Katy AI Signal: NEUTRAL with bearish bias (target $452.89, stop $462.94) - but institutional guidance shows BUY CALLS primary bias (+1.8 composite score)
Technical Analysis: Strong bullish gap (+0.11%), price in upper swing zone (60.2%), all EMAs aligned bullish, but MACD bearish and trend strength WEAK
News Sentiment: Mixed with high-impact Tesla stories - Michael Dell/Cathie Wood supporting Musk's pay package is bullish, but political/regulatory uncertainty creates headwinds
Options Flow: Extremely bearish Put/Call Ratio (10.99) suggests institutional pessimism, max pain at $455.00 below current price
Risk Level: HIGH - conflicting signals between directional guidance and options flow, weak momentum despite recent 5.40% gain
💰 TRADE SETUP
Expiry Date: 2025-11-21 (20 days)
Recommended Strike: $425.00
Entry Price: $43.40 - $43.65
Target 1: $65.28 (50% gain from entry)
Target 2: $86.95 (100% gain from entry)
Stop Loss: $32.48 (25% loss from entry)
Position Size: 2% of portfolio (low conviction requires reduced exposure)
⚡ COMPETITIVE EDGE
Why This Trade: Multi-timeframe STRONG_BULLISH alignment vs single-day noise creates swing opportunity
Timing Advantage: 20-day expiry provides buffer for weak momentum to strengthen, gap support at $433.22
*
Image
QS Analyst
APP
— Yesterday at 8:56 PM
*Risk Mitigation: Balanced delta (0.725) provides optimal risk/reward, stop protects against Katy's bearish $462.94 resistance
🚨 IMPORTANT NOTES
⚠️ CRITICAL CONFLICT**: Options flow shows extreme bearish positioning (P/C ratio 10.99) contradicting directional guidance
⚠️ Katy AI actually signals NEUTRAL with bearish bias - trade goes against primary AI engine recommendation
⚠️ Weak bullish signal (score: 0.8) requires cautious position sizing and tight risk management
⚠️ Monitor $455.00 max pain level as potential resistance zone
📊 TRADE DETAILS 📊
🎯 Instrument: TSLA
🔀 Direction: BUY 📈
🎯 Strike: 425.00
💵 Entry Price: 43.52
🎯 Profit Target: 65.28
🛑 Stop Loss: 32.48
📅 Expiry: 2025-11-21
📏 Size: 2.0
📈 Confidence: 55%
⏰ Entry Timing: N/A
🕒 Signal Time: 2025-11-01 23:56:15 EDT
🔴 HIGH RISK WARNING: Use only small position size due to lower confidence and high uncertainty.

Is Tesla Setting Up for a Rebound? Key Entry Levels Inside🎯 TSLA: The "Thief Strategy" Playbook | Swing/Day Trade Setup 📈
🔥 Quick Overview
Asset: Tesla, Inc. (TSLA)
Bias: 🐂 BULLISH
Strategy Type: Thief Layering Entry Method
Risk Level: Medium-High (Swing/Day Trade)
💰 The "Thief" Entry Strategy Explained
The "Thief Strategy" uses multiple limit orders (layering method) to accumulate position at different price levels. Think of it like setting traps at various floors of a building—you catch opportunities wherever price decides to visit! 🎣
📊 Entry Zones (Layer Your Orders):
Layer 1: $430.00
Layer 2: $435.00
Layer 3: $440.00
💡 You can add more layers based on your own risk appetite and account size. The beauty of layering? You average your entry and reduce timing risk!
🛡️ Stop Loss (SL):
Thief SL: $415.00
⚠️ Important Note: This is MY stop loss level based on the Thief Strategy framework. You're the captain of your own ship! 🚢 Adjust your SL based on YOUR risk tolerance and account management rules. Trade at your own risk—make money, take money, manage wisely!
🎯 Target (TP):
Primary Target: $490.00
🚨 Why $490? This zone represents a confluence of:
Strong resistance area
Potential overbought conditions
Historical trap zone where bulls get exhausted
📢 Thief OG's Reminder: I'm NOT saying you MUST take profit only at my TP level. If you see profits that make you smile, SECURE THEM! 💵 The market gives, and the market takes. Be greedy when you can, be smart always.
🔍 Technical Analysis Breakdown
Tesla is showing bullish momentum structure with potential for continuation toward the $490 resistance zone. The layering strategy allows us to build position as price potentially dips into demand zones before the next leg up.
Key Technical Levels:
Support Zone: $430-$440 (Our entry layers)
Invalidation: Below $415 (Stop loss)
Resistance Target: $490
📌 Related Pairs to Watch (Correlation Play)
Understanding correlated assets helps confirm your thesis:
AMEX:SPY (S&P 500 ETF)
TSLA often moves with broader market sentiment
Watch SPY for overall risk-on/risk-off environment
NASDAQ:QQQ (Nasdaq 100 ETF)
Tech-heavy index where TSLA is a major component
Strong correlation with TSLA price action
NASDAQ:NVDA (NVIDIA)
Both are high-beta tech growth stocks
Often move together during risk appetite shifts
TVC:DXY (US Dollar Index)
Inverse correlation: Strong dollar = pressure on growth stocks like TSLA
Weak dollar = tailwind for equities
💡 Key Point: If SPY/QQQ are bullish + DXY weakening = Strong confirmation for TSLA upside!
⚡ Trading Tips for Thief OG's
Don't FOMO — Let price come to your layers
Manage position size — Each layer should be equal weight
Trail your stop — Once profitable, protect gains
Watch volume — Confirm breakouts with volume spikes
Stay flexible — Market conditions change; so should you!
🎬 Final Words
This setup is all about patience, precision, and profit extraction! 🎯 The Thief Strategy isn't about stealing from the market—it's about being SMART and setting yourself up for success with calculated entries.
Remember: The best trades are the ones where you're prepared, not scared! 😎
✨ If you find value in my analysis, a 👍 and 🚀 boost is much appreciated — it helps me share more setups with the community!
#TSLA #TeslaStock #SwingTrading #DayTrading #ThiefStrategy #LayeringStrategy #StockMarket #TradingIdeas #TechnicalAnalysis #BullishSetup #TradingStrategy #RiskManagement #StockTrading #MarketAnalysis #TradingCommunity

TSLA shorts may get toastedA rising trendline acting as strong dynamic support from the August lows.
Resistance zone near $470–475 (yellow line, recent double-top area).
Current price at $456, holding above trendline support.
Support floor near $290, far below current levels — indicating we’re in a mid-term uptrend phase, not deep correction.
This pattern fits a rising channel consolidation near resistance — the next move depends on whether the trendline holds.
📈 Bullish Scenario
Setup:
TSLA is holding the ascending trendline while consolidating just below resistance — a classic bullish continuation structure.
Confirmation Triggers:
Break and daily close above $470–475 (clear breakout).
Follow-through volume or a strong gap-up session confirming momentum.
Short-Term Targets:
$490–495 → initial breakout target (projected move from last swing).
$510–520 → extended target if buyers sustain momentum.
Catalysts:
Broader tech strength (QQQ, NASDAQ rally).
Positive EV demand data or production updates.
Institutional accumulation at the breakout level.
Invalidation:
Break and close below $445, violating trendline support.
Probability: ~60% (uptrend intact, momentum favors bulls).
📉 Bearish Scenario
Setup:
If TSLA fails to break $470 again and loses the $445 trendline, momentum could unwind toward prior support.
Confirmation Triggers:
Close below $445 with increased volume.
Failed retest near $450–455 forming lower high.
Short-Term Targets:
$420–425 → first support zone from early October.
$390–400 → deeper correction toward base of last breakout.
Catalysts:
Weak market sentiment or NASDAQ pullback.
Negative headlines on delivery numbers or margins.
Broader EV sector weakness.
Invalidation:
Breakout above $475 with strong follow-through.
Probability: ~40% (depends on strength of support at $445).
⚖️ Neutral / Sideways
If TSLA oscillates between $445–475, expect continued range consolidation along the trendline — typically preceding a directional breakout in 1–2 weeks.
🧩 Summary Table
Bias Confirmation Target Zone Invalidation Notes
Bullish Close > $475 $490 → $520 < $445 Continuation of uptrend
Bearish Close < $445 $425 → $400 > $475 Trendline break
Neutral Range $445–475 — — Coiling near apex
🕒 2–3 Week Projection
Bullish path: Hold $450–455 → breakout above $475 → reach $495–500 by mid-Nov.
Bearish path: Reject $470 → break below $445 → pull back to $420 by late Nov.

Tesla Stock: Poised for a MASSIVE CRASH? Buckle Up!🚀 Tesla Stock: Poised for a MASSIVE CRASH? Buckle Up! 📉
🔥 Explosive Technical Breakdown!
On the 4-hour timeframe, Tesla is teetering on the edge! A break below $411.42 screams a BEARISH SETUP! 🚨 But hold up – this only kicks in if the price fails to BLAST through $454.43 resistance.
💥 Bigger Picture? It’s BRUTAL! Tesla just SMASHED a critical support level, paving the way for a VICIOUS DOWNtrend! Bears are circling, and the stage is set for a MELTDOWN! 😈
Will Tesla CRUMBLE or pull a last-second escape? Who’s next to get WRECKED?
🚀 Analysis + LIGHTNING-FAST Signals? Follow NOW! ✅
📊 Want a GOLD Decision-Making Chart? Smash LIKE! ✅
💬 Got Thoughts? Comment – Replying to the BEST! ✅

TSLA, consolidation below ATH often leads to a breakout..Tesla sentiment was very negative in April as Trump and Elon argued online causing a lot of whipsaw volatility and scaring out investors. The bottom quickly followed.
Price is ranging below all time high. Price is above the weekly pivot and 200EMA which is bullish and has momentum.
Wave © of C appears to be underway into price discovery with a target of $693 the R2 weekly pivot. This is because it has been printing a series of 3 wave structures. Wave B printed a triangle which is a pattern found before a terminal move reinforcing the Elliot wave count.
🎯 Terminal target for the business cycle could see prices as high as $690 based on weekly pivots
📈 Weekly RSI is just below oversold with no divergence and can remain here for months as price keeps increasing.
👉 Analysis is invalidated if we close back below wave (B), $280

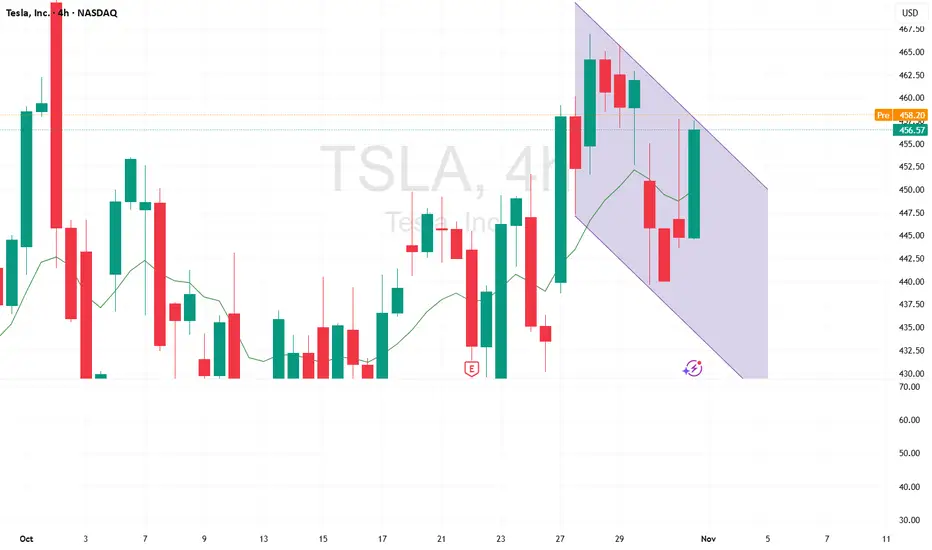
$TSLA | Short Setup Loading — 450 is the Line in the Sand⚙️ NASDAQ:TSLA | Short Setup Loading — 450 is the Line in the Sand
Tesla continues its controlled descent after rejecting the weak high at 465–470.
Price retraced into the 0.786 Fib (≈ 445) zone, finding short-term equilibrium before the next leg.
📊 VolanX DSS Technical Outlook (15m):
Structure confirms bearish displacement with multiple CHoCH breaks.
Retrace zone: 447 → 450 = ideal short re-entry if market allows.
Target zones: 433 → 420 → 419.69 (liquidity shelf).
RSI = 35 → momentum favors continuation; no confirmed divergence yet.
Volume dropping into equilibrium = possible redistribution phase.
🎯 Trade Plan:
Entry short @ 450.00 if market gives.
Maintain stop above 452; scale out near 433–420.
VolanX Liquidity-Reversal-Guard (LRG) stays inactive until RSI divergence appears.
Macro Context (Oct 30 2025):
Fed tone = hawkish → yield = 4.10 %.
Risk assets fading post-earnings; AI and EV names seeing capital rotation.
NASDAQ:TSLA tracking NASDAQ:QQQ correlation ≈ 0.83 → expect synchronized intraday volatility.
VolanX DSS Bias:
🟥 Bear 60 % 🟨 Neutral 25 % 🟩 Bull 15 %
“450 is the battlefield — equilibrium decides who walks away.”
#TSLA #WaverVanir #VolanX #SmartMoney #Liquidity #Macro #Fed #AITrading #SPY #QQQ #Tesla #ShortSetup
Tesla Wave Analysis – 30 October 2025
- Tesla reversed from the key resistance level 467.30
- Likely to fall to support level 415.60
Tesla recently reversed from the resistance area between the key resistance level 467.30 (which stopped the previous impulse wave I at the start of October) and the resistance trendline of the daily up channel from April.
The downward reversal from this resistance level 467.30 is likely to for the daily Japanese candlesticks reversal pattern Evening Star Doji – strong sell signal for Tesla.
Given the strength of the resistance level 467.30 and the overbought daily Stochastic, Tesla can be expected to fall toward the next support level 415.60 (low of waves ii, c and a).

TSLA – Buy the Fear or Wait for the Setup?Tesla (TSLA) is once again in the spotlight. Between robo-taxi hype, new product launches, and ongoing political noise around Elon Musk, the stock has become one of the hottest trading stories on the market. But as always the chart tells us where to act.
Entry Levels
$330 – First line of defense, early buyers may step in here
$295 – Stronger support, better reward-to-risk zone
$255 – Deep pullback level, only triggered on market weakness
🎯 Profit Targets
TP1: ~$345 → ~5% move from $330 entry
TP2: ~$370–$380 → 12–15% move depending on entry
TP3: ~$400–$420 → 18–20% move on a sustained breakout
Tesla remains a trader’s stock: volatile, narrative-driven, and technically reactive. If it holds the $330 zone, momentum traders could see a quick bounce. If we dip to $295 or even $255, that could be the bigger opportunity for those with patience.
No one knows which path the market chooses, but the plan is set. Trade the structure, not the noise.
⚠️ Disclaimer: This is not financial advice. I’m sharing my personal analysis and trade levels. Always do your own research and manage risk responsibly.
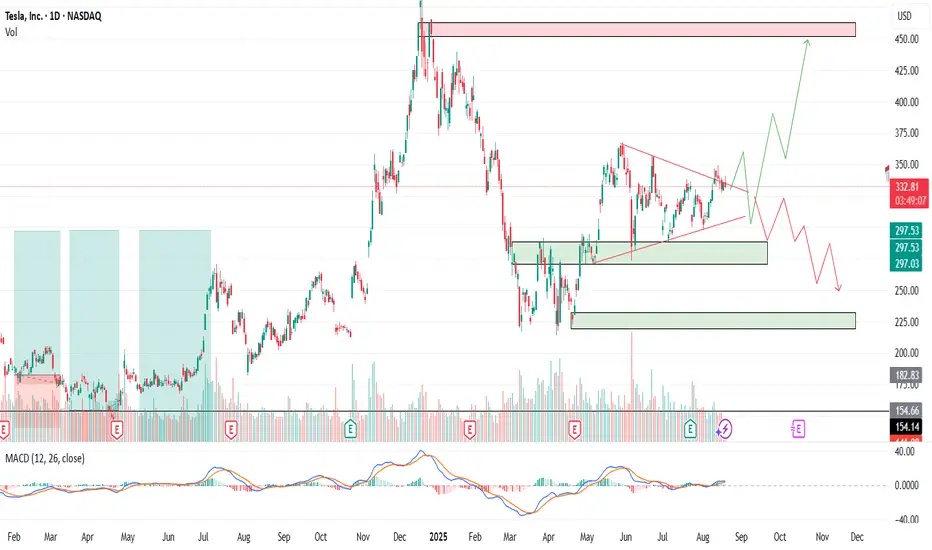
TSLA Bullish Breakout? Flag Resolution Toward 525–530Hello, traders. TSLA’s 1D chart has been trending higher since the early-September breakout, then cooling into a neat bull flag. Price is holding above the MA20, MA60, and MA120, with the MA20 around ~$440 acting as first dynamic support. Volume expanded on the run-up and faded during the flag—classic continuation behavior—while volatility has eased but remains elevated.
The key battleground is the resistance at $481, the early-October peak and upper boundary of the flag. A daily close above $482 would confirm the breakout and put the psychological $500 on the table, with extension toward the $525–$530 supply zone if momentum and volume expand. If buyers don’t force the break immediately, a dip toward the $430–$440 area (near MA20) is a constructive retest zone before another attempt at the highs.
The idea fails on a decisive daily close below $415. That would break the flag support, flip the short-term structure, and expose downside toward the MA60 region near $390. Until then, the primary path favors continuation: breakout entries on a daily close >$482, with partial profits near $500 and runners into $525–$530; conservative stops live below $415–$417 depending on tolerance.
This is a study, not financial advice. Manage risk and invalidations.

TSLA | Smart Money FlowNASDAQ:TSLA | Smart Money Flow
Tesla’s building pressure right at the distribution zone (460–470) liquidity’s loading up top.
Below sits a clean accumulation block (400–430) stacked with FVGs waiting to get tapped.
A quick sweep → bounce from that zone could send it straight toward $500+.
Structure still clean, bulls still in control.
