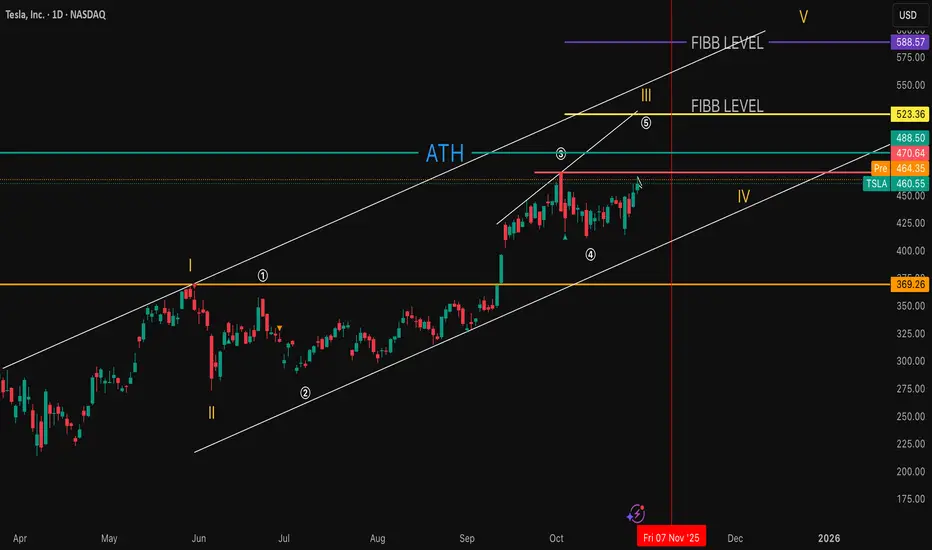
Tesla Consolidates Before Next Bullish BreakoutTesla Consolidates Before Next Bullish Breakout — Eyes on $550, $600, and $650 Targets
Tesla’s price action has formed a series of bullish continuation patterns, each followed by strong upward moves. Currently, the stock is consolidating between $413 and $470, creating a potential accumulation zone before the next breakout.
The repeated triangle breakout patterns suggest a continuation of the bullish trend if Tesla manages to hold above the $413 support level.
Once price breaks above the $470 resistance, Tesla could accelerate toward the next targets at $550, $600, and $650, as indicated on the chart.
In the short term, some sideways movement within the current range is possible before the next strong impulse upward.
You may find more details in the chart!
Thank you and Good Luck!
❤️PS: Please support with a like or comment if you find this analysis useful for your trading day❤️
Trade ideas

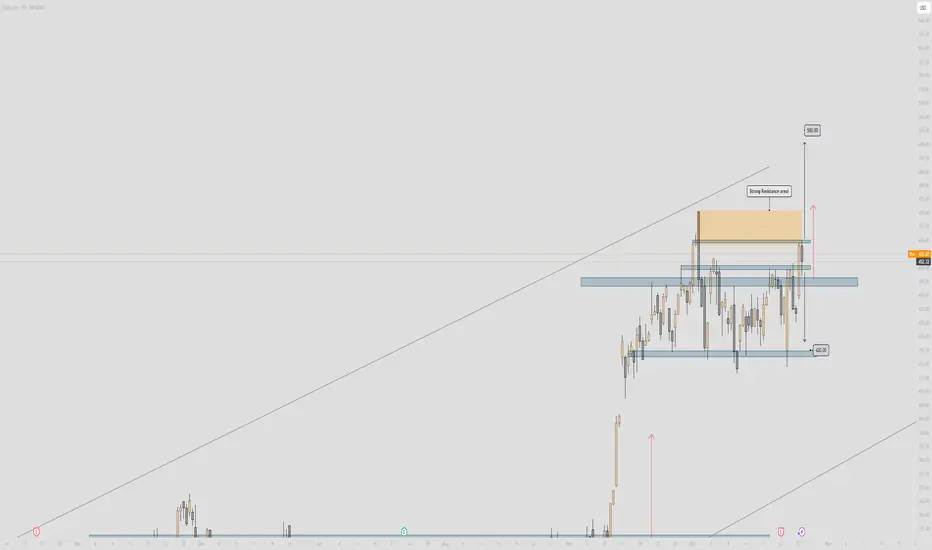
TSLA is going UP! .. time to buy!Tsla aka Tesla was stuck in-between 2 powerful support and resistance zones (the red and green lines) .. It finally broke to the upside and broke above the resistance level. It is now very likely to head to the next resistance zone which was the previous high (the next resistance zone has been drawn as the white line shown on the chart) - this is where we will be taking profit at. BUY NOW!

TSLA - Important!🔥 Tesla Analysis (Daily Structure) 🔥
Alright, let’s break this one down 👇
🧱 Structure Overview
Tesla’s price is currently hovering around $452, sitting right below a major resistance zone between $455 – $470 (highlighted in orange). This area has acted as a strong ceiling multiple times — every approach has been met with rejection pressure.
Below, the support floor sits clean around $420 – $425, which has been holding the range low for a while. We’re essentially trapped in a sideways consolidation box — a range between that $420 low and the $470 resistance cap.
🧭 Bias
Current structure = Neutral to Bearish
Price just wicked into resistance, showing signs of rejection. Unless we see strong follow-through above $470 with clean volume, this is likely a reaction zone for shorts.
💡 Key Zones
Resistance (Sell Zone): $455 – $470
Strong supply — expect sellers to defend this area.
Support (Buy Zone): $420 – $425
Range demand base — liquidity resting below.
🎯 Scenarios
Bearish Setup (Higher Probability for Now)
If Tesla fails to break and close above $470, look for a move back down to $420 — possibly a liquidity grab under the range. Confirmation would be bearish engulfing or a strong rejection candle from resistance.
Bullish Setup (Breakout Play)
If price cleanly closes above $470 and retests it as support, we could open the door toward $500 (measured move target). That’d be a breakout from the range and continuation of the larger bullish channel.
⚖️ Risk Management
Bears: Stop above $475 – $480
Bulls: Stop below $445 if entering after breakout retest
Keep R:R ≥ 1:2
🧠 Summary
Tesla’s in a tight range — smart money likely accumulating or distributing near these highs. Watch for rejection signs around $470 for short plays, or confirmation above it for the next leg to $500.
This is the make-or-break zone — the next move will define Tesla’s mid-term direction. ⚡️
The Impact of International Trade PolicyIntroduction
International trade policy plays a central role in shaping the global economic landscape. It encompasses the set of laws, agreements, and regulations that govern how countries trade goods, services, and capital across borders. The policies that a nation adopts determine its trade openness, competitiveness, and relationship with other economies. These decisions influence economic growth, employment, industrialization, innovation, and even geopolitical alliances. Over time, trade policy has evolved from protectionist models to liberalized frameworks, reflecting changing political ideologies and global economic realities.
The impact of international trade policies is profound. They influence prices, productivity, income distribution, and global supply chains. Whether it’s tariffs, quotas, free trade agreements, or export subsidies, every trade measure carries consequences for domestic industries and the international community. Understanding the implications of these policies helps policymakers strike a balance between protecting local interests and promoting global cooperation.
1. The Nature and Objectives of International Trade Policy
International trade policy refers to the set of strategies and regulations that guide a country’s transactions with other nations. The primary objectives of trade policy include:
Promoting Economic Growth:
Trade policies aim to enhance national income through exports and foreign investments. By opening markets, countries can leverage comparative advantages and increase efficiency.
Protecting Domestic Industries:
Some trade policies impose tariffs or quotas to shield local producers from foreign competition, particularly in emerging sectors.
Ensuring Balance of Payments Stability:
Trade regulations help maintain equilibrium between imports and exports, reducing dependence on foreign debt.
Encouraging Employment:
Strategic trade policies promote industries that create jobs and sustain livelihoods.
Advancing Geopolitical Goals:
Trade policies are also used to strengthen diplomatic ties or exert economic pressure, such as through sanctions or preferential trade agreements.
Fostering Innovation and Technology Transfer:
Open trade environments often accelerate the diffusion of technology and innovation across borders.
Ultimately, international trade policy reflects the economic philosophy of a nation—whether it leans toward protectionism or free trade liberalization.
2. Major Instruments of Trade Policy
Trade policy uses a range of instruments to regulate international transactions:
a. Tariffs
Tariffs are taxes imposed on imported goods. They raise import prices, protecting domestic industries from cheaper foreign products. However, high tariffs can provoke retaliation and reduce global trade efficiency.
b. Quotas
Quotas limit the quantity of goods that can be imported or exported. While they protect local industries, they often lead to inefficiencies and higher consumer prices.
c. Export Subsidies
Subsidies encourage domestic firms to export by lowering production costs. While this can boost competitiveness, it may distort market competition and lead to trade disputes.
d. Trade Agreements
Bilateral, regional, or multilateral agreements—such as NAFTA (now USMCA), the European Union, or ASEAN—facilitate freer movement of goods and services by reducing barriers.
e. Non-Tariff Barriers
These include product standards, licensing requirements, and customs procedures that indirectly restrict trade.
f. Exchange Rate Policies
A country’s currency valuation can influence trade competitiveness. A depreciated currency makes exports cheaper and imports costlier, affecting trade balances.
Each of these instruments has a specific impact on domestic markets and the global economy.
3. Historical Evolution of International Trade Policy
The history of trade policy reflects the global struggle between protectionism and liberalization.
Mercantilist Era (16th–18th Century):
Nations viewed wealth in terms of gold and silver reserves. They imposed high tariffs to maximize exports and minimize imports.
Free Trade Movement (19th Century):
The Industrial Revolution and the works of economists like Adam Smith and David Ricardo popularized the idea of comparative advantage, leading to lower tariffs and greater global trade.
Post–World War II Liberalization:
The establishment of the General Agreement on Tariffs and Trade (GATT) in 1947 marked a turning point toward multilateral trade liberalization.
World Trade Organization (WTO) Era (1995–Present):
The WTO institutionalized global trade rules and dispute resolution mechanisms, promoting freer and fairer international commerce.
Recent Protectionist Resurgence:
Events like Brexit, U.S.–China trade tensions, and supply chain disruptions have reignited debates over economic nationalism and trade protectionism.
This historical evolution shows that trade policy continuously adapts to changing political and economic dynamics.
4. Economic Impact of International Trade Policy
a. Impact on Economic Growth
Open trade policies generally promote higher growth. Countries like South Korea, Singapore, and Germany have leveraged export-led strategies to achieve rapid industrialization. By contrast, overly restrictive policies often hinder competitiveness and innovation.
b. Impact on Employment
Trade liberalization can both create and destroy jobs. While export industries grow and employ more workers, import-competing sectors may experience layoffs. Hence, labor retraining and social safety nets are crucial to manage transitions.
c. Impact on Prices and Inflation
Trade liberalization reduces the cost of imported goods, benefiting consumers with lower prices. Conversely, protectionist tariffs increase costs and contribute to inflationary pressures.
d. Impact on Industrial Development
Strategic trade policies can nurture infant industries by protecting them from international competition until they become globally competitive—a strategy used successfully by Japan and China.
e. Impact on Income Distribution
Trade liberalization often benefits skilled workers and capital owners, while unskilled labor may face downward pressure on wages. Thus, inequality may rise without inclusive policies.
5. Political and Social Implications
International trade policy is not merely economic—it is deeply political. Trade decisions influence national sovereignty, labor rights, and even cultural identity.
Political Influence:
Governments use trade policy as a diplomatic tool. Sanctions, embargoes, or preferential agreements can shift power balances in international relations.
Social Consequences:
Global trade can reshape social structures. While it creates wealth, it can also lead to job displacement and social unrest if benefits are unevenly distributed.
Environmental Impact:
Trade policies can either encourage sustainable practices through green standards or exacerbate environmental degradation through overexploitation of resources.
6. The Role of International Institutions
Institutions like the World Trade Organization (WTO), International Monetary Fund (IMF), and World Bank play critical roles in shaping and enforcing trade policy.
World Trade Organization (WTO):
The WTO ensures that trade flows as smoothly and fairly as possible by setting global rules and resolving disputes.
International Monetary Fund (IMF):
The IMF stabilizes exchange rates and provides financial assistance to countries facing balance-of-payments crises, indirectly supporting trade stability.
World Bank:
The World Bank supports trade-related infrastructure and development projects to integrate developing nations into the global economy.
These institutions provide a framework for cooperation, transparency, and accountability in global trade.
7. Regional Trade Agreements and Blocs
Regional integration has become a cornerstone of modern trade policy. Examples include:
European Union (EU):
A single market allowing free movement of goods, services, labor, and capital among member states.
North American Free Trade Agreement (NAFTA/USMCA):
Strengthens trade ties between the U.S., Canada, and Mexico by reducing tariffs and harmonizing regulations.
Association of Southeast Asian Nations (ASEAN):
Promotes economic cooperation and market integration in Southeast Asia.
African Continental Free Trade Area (AfCFTA):
Aims to create a unified market across Africa, enhancing intra-continental trade.
These agreements stimulate economic cooperation and regional stability while creating large integrated markets that attract foreign investment.
8. Trade Policy Challenges in the 21st Century
Modern trade policy faces several emerging challenges:
Protectionism and Trade Wars:
Rising nationalism has led to tariff battles, particularly between major economies like the U.S. and China.
Digital Trade and E-Commerce:
Policies must adapt to data flows, digital services, and cybersecurity concerns in global online commerce.
Supply Chain Disruptions:
Events like the COVID-19 pandemic exposed the vulnerabilities of global supply chains, prompting calls for “reshoring” or “friend-shoring.”
Climate Change and Green Trade Policies:
Nations are incorporating environmental standards into trade deals to encourage sustainable production and carbon reduction.
Inequality and Labor Standards:
Policymakers must address the social costs of globalization, ensuring fair wages and ethical labor practices.
Technological Advancements:
Automation, AI, and robotics influence trade competitiveness, requiring rethinking of industrial and education policies.
9. Impact on Developing Economies
For developing countries, trade policy can be a double-edged sword.
Positive Impacts:
Trade liberalization opens access to global markets, encourages investment, and fosters technology transfer. Nations like Vietnam and Bangladesh have used export-oriented strategies to lift millions out of poverty.
Negative Impacts:
Weak infrastructure, lack of competitiveness, and dependency on raw material exports make developing economies vulnerable to global shocks. Poorly designed liberalization can lead to deindustrialization and income inequality.
Therefore, balanced trade policies that combine openness with domestic capacity building are crucial for sustainable development.
10. The Future of International Trade Policy
Looking ahead, the future of trade policy will likely focus on sustainability, digitalization, and inclusivity. The next generation of trade agreements will emphasize:
Green Trade: Incentivizing low-carbon production and renewable energy trade.
Digital Economy Governance: Regulating data flows, privacy, and digital taxation.
Resilient Supply Chains: Diversifying trade partners and promoting regional production hubs.
Inclusive Growth: Ensuring that trade benefits reach small businesses, women, and underrepresented communities.
Geopolitical Cooperation: Strengthening trade diplomacy to mitigate conflicts and foster global stability.
The trade policy of the future will balance national security with economic efficiency and social welfare.
Conclusion
International trade policy is one of the most powerful tools in shaping global prosperity and stability. Its impacts span economic growth, employment, innovation, and geopolitical relations. While liberalization has fostered unprecedented global integration, it has also exposed vulnerabilities—inequality, environmental strain, and dependence on fragile supply chains.
The challenge for policymakers lies in designing trade frameworks that are fair, resilient, and sustainable. Balancing national interests with global cooperation remains the cornerstone of effective trade policy. In an increasingly interconnected world, the success of any nation’s trade policy depends not only on its domestic priorities but also on its capacity to collaborate, adapt, and lead within the global economic system.

TSLA – Key Resistance Retest AheadNASDAQ:TSLA stock price continues to show strong bullish momentum, recently breaking above short-term consolidation near the $440–$445 zone. The current move suggests buyers are regaining control after a period of sideways accumulation, with the next key resistance area sitting between $470–$490, where previous supply triggered multiple rejections.
If price can sustain above the $440–$445 demand zone, a breakout above $470 could confirm bullish continuation toward $520–$540, aligning with the next liquidity pool. This area could attract profit-taking or a short-term retracement before further upside extension.
However, if the price fails to clear the $470–$490 resistance and forms a rejection candle, sellers may attempt to push price back into the previous consolidation range. A clean break below $430 would invalidate the bullish structure, potentially exposing downside toward $400.

TSLA Weekly Outlook (Oct 28–31)TSLA Weekly Outlook (Oct 28–31): “Charging Toward 470 or Cooling at the Top?” ⚡
1. Weekly (1W) Structure – Big Picture
Tesla is in a strong bullish continuation phase, showing a clear Break of Structure (BOS) above $367 and holding momentum above $450. The downtrend line from the 2023 high was broken, confirming a long-term structural reversal. Price is now consolidating near $452–$460, forming a possible higher-low setup before a push to $488–$500 zone.
* Bias: Bullish continuation unless price closes below $411.
* Support: $367 → $411 zone
* Resistance: $470 → $488 zone
* MACD: Expanding bullish histogram, showing momentum strength.
* Stochastic: Near overbought but still trending upward.
💡 Weekly Thought:
Tesla’s higher timeframe looks ready for another leg up, but a mild pullback to $430–$440 wouldn’t hurt the structure—it would actually create a healthy base for November.
2. Daily (1D) – Momentum Check
The daily chart confirms a strong BOS and ascending channel. After testing the channel’s lower boundary ($411–$420), Tesla rebounded cleanly toward $452. Price is attempting to reclaim the midline of the ascending channel, signaling renewed bullish control.
* Bias: Bullish bias, but short-term profit-taking likely near $460–$470.
* Support: $411 → $420 (demand zone)
* Resistance: $460 → $470 (channel top)
* Indicators:
* MACD turning positive after extended red bars.
* Stochastic curling up from mid-levels — bullish swing signal.
💭 Daily Suggestion:
Buyers should stay patient for pullbacks near $440–$445 to re-enter. Short-term traders can target $468–$470 if price holds above $452 with volume.
3. 1-Hour (1H) – Short-Term Game Plan
Tesla is holding above the intraday uptrend line, with clear Breaks of Structure (BOS) around $451–$455. The immediate zone to watch is the $449–$451 range, acting as dynamic support. As long as Tesla holds this area, intraday bulls maintain control.
* Scalp Bias: Bullish as long as price stays > $449
* Immediate Resistance: $455 → $465
* Support: $439 → $445
* Setup Idea:
* Call scalp: Above $455 for target $462–$468
* Put scalp: Only if breaks below $445 with volume
📈 1H Thought:
If Tesla consolidates sideways around $450–$455 early week, it sets up a launch toward $470 later in the week.
4. GEX & Options Sentiment – Institutional Flow Insight
The Gamma Exposure (GEX) map shows clear call dominance:
* Highest positive GEX wall / resistance: $455–$460
* 2nd & 3rd Call Walls: $465 → $470 → $480
* Put walls / downside support: $430 → $415 → $400
Key Metrics:
* GEX Bias: +57.2% Calls
* IVR: 15.5 (low volatility environment)
* IVx avg: 60.2% (vol compression likely → bullish)
Institutions are positioned bullishly with heavy call exposure at $460–$470, acting as a near-term magnet. The $430–$415 range remains protected by put walls—making it a tough zone to break down through unless macro turns negative.
5. Suggested Option Plays
* Bullish Setup (Preferred):
* Buy-to-open 460C (1DTE/2DTE) if price reclaims $455–$457 with volume.
* Target: $470
* Stop: Below $445
* Reason: Strong call gamma wall at $460 + breakout potential.
* Bearish Hedge (Cautious traders):
* Buy 440P (1DTE/2DTE) only if TSLA breaks $445 on volume.
* Target: $430
* Stop: Above $455
6. My Take for Oct 28–31
Tesla is showing clean bullish structure across all timeframes.
* Weekly confirms a higher low and BOS continuation.
* Daily is aligned within an ascending channel.
* 1H shows intraday bullish trendline support.
* GEX confirms call-dominant sentiment toward $470.
If macro markets remain stable, TSLA likely tests $468–$470 this week, possibly stalling there for profit-taking. A rejection near that level would bring $440–$445 back into play for reload.
🎯 Primary Bias: Bullish toward $470
⚠️ Watch For: Failing to hold $445 = possible short-term correction.
Disclaimer:
This analysis is for educational purposes only and not financial advice. Always manage your risk and perform your own due diligence before trading options or equities.
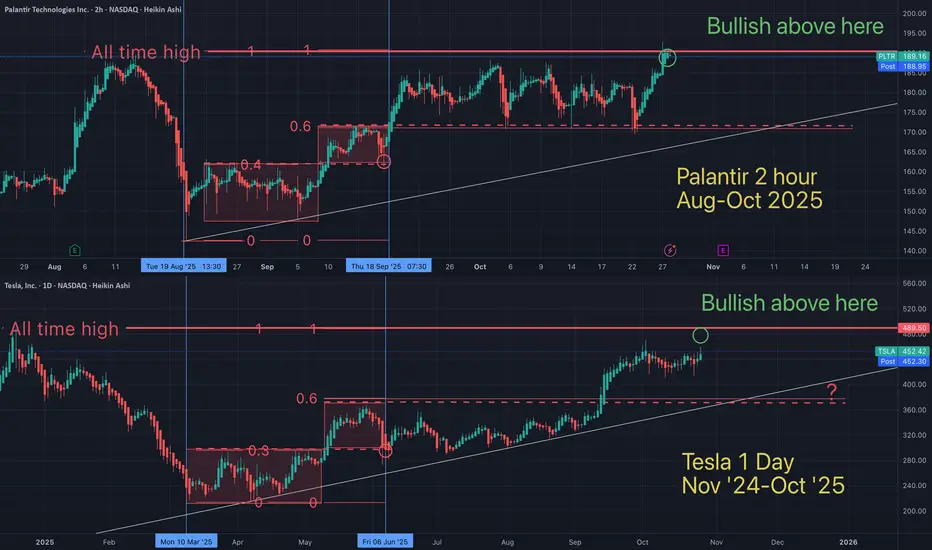
Tesla / Palantir fractal showing both will hit ATH soonFractals are a mathmatical anomaly, if you understand linear equations (and believe the market is "random"). All assets are doing the same patterns over and over, on all time frames. You just need to see it for what it is.
May the trends be with you.
TSLALooking like TSLA gearing up to put in monster monthly up to $800, following same pattern as AMD
Elon announced $1b buy in September, which is what got TSLA up over 420. Correction after earnings last week (back down to ~420) was final test of demand at what is now giga support
Fade at your own peril

#Tesla - $307 OR $555Date: 27-10-2025
#Tesla Current Price: $438.70
Pivot Point: $431.65 Support: $411.84 Resistance: $451.63
Upside Levels:
L1: $477.11 L2: $502.59 L3: $529.19 L4: $555.79
Downside Levels:
L1: $386.27 L2: $360.71 L3: $334.10 L4: $307.50
#Tradingview #TSLAMinds #NDQ

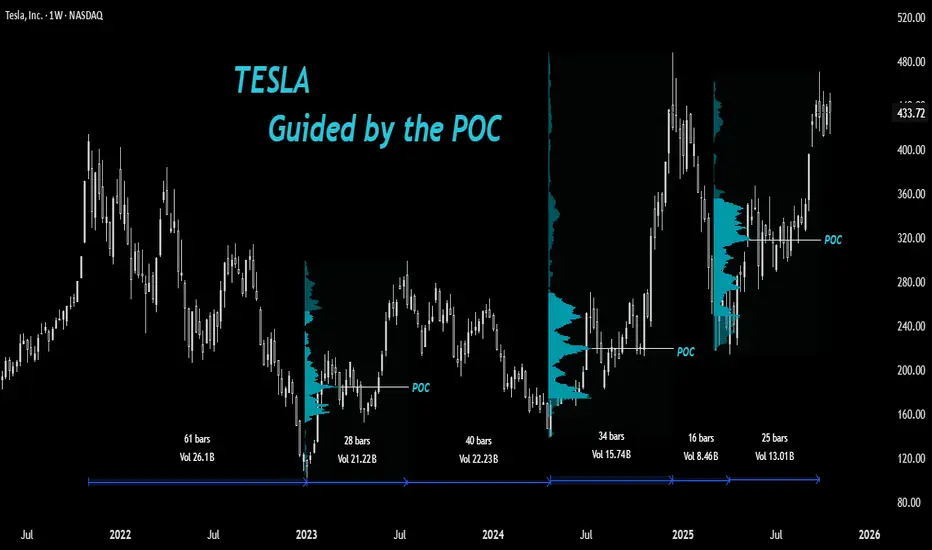
Tesla: Guided by the Point of Control🔎Understanding How Stocks React at Key Volume Profile Levels
In this post, let’s study how a stock can react around important Volume Profile levels and how we, as traders, can take advantage of this behavior.
🔘 A Quick Look at Volume Profile
The Volume Profile shows how much trading took place at each price level. Think of it like a sideways histogram that highlights where buyers and sellers were most active. It helps identify price zones that the market accepted (heavy trading) and those it rejected (light trading).
In between a Volume Profile is the Point of Control (POC) - the price level where the highest trading volume occurred. This is often considered as the market’s fair value zone, where buyers and sellers found the most agreement.
The POC tends to act like a magnet for price. When price moves too far away from it, it often returns to test that level since it represents strong trading interest. That’s why traders use POC zones to mark key supports, resistances, and potential entry areas.
In short:
The Volume Profile shows where trading happened. The POC shows where it mattered the most.
🔘 Overview: TSLA’s Story
After printing a high of $414 in 2021, Tesla (TSLA) has been trying to decisively break that level for almost four years. It made two attempts - first in December 2024, which was quickly faded, and again in September 2025.
🔘 The Fall and Bottom Formation
The stock went through a major bearish phase from $414 down to $101 in 2022 - a massive 75% drop. Then came a sharp V-shaped rally from the bottom - a 194% rise over about 28 weeks, retracing roughly 60% of the entire fall in a short span.
🔘 Why It’s Hard to Catch the Bottom
Catching a stock at the exact bottom is one of the hardest things in trading. No one really knows when the real bottom is forming.
At that point, fear is high, sentiment is negative, and the trend still looks weak. Most traders wait for confirmation - but by then, the bottom is already behind.
Catching the exact low becomes more like a luck than skill. No doubt 'smart traders' focus on catching the early reversal and not the perfect bottom, there are others who wait for pullback opportunities to a fair price.
🔘 April 2024 Bottom Formation
After rallying sharply, TSLA began to pull back from around $300 in July 2023. Traders who had missed the earlier move were waiting patiently with their limit orders for a healthy correction.
But the question was - where should those limit orders be placed?
◽️At the breakout zone around $218?
◽️Near the 50% or 61.8% Fibonacci retracement?
◽️Or below the April 2023 low near $152 for a possible liquidity grab?
The truth is - nobody actually knows the exact level because nothing works all the time.
However, the POC can often help identify a probable fair value zone where accumulation tends to happen.
Although we can’t pinpoint the exact level where a pullback will end, the area 'around' the POC often serves as one of the most reliable zones to accumulate a bullish stock.
And that’s exactly what happened in April 2024. The stock dipped below the previous rally’s POC, grabbed liquidity under $152, and then reversed sharply.
🔘 The Sharp Rally to New Highs
After that, TSLA entered a strong bullish phase, rallying from the April 2024 low to new highs above $414 in December 2024 - a massive 252% rise.
If you observe the Range Tool on the chart, you’ll notice a pattern - bearish phases take longer, while bullish rallies happen faster.
A question here arises: Was this rally sustainable above previous highs?
🔘 The Quick Fall
In January 2025, the stock saw a sharp fall from $488, wiping out 78% of the previous rally.
Interestingly, this decline didn’t stop at a typical breakout retest level - instead, it halted exactly at the POC of the prior bullish rally and began consolidating there.
Since then, the stock has climbed back near its previous highs.
But note this - the January 2025 fall lasted only 16 weeks, while the recovery has taken over 25 weeks without new highs, suggesting a slight loss of upside momentum compared to earlier rallies (early 2023 and late 2024)
🔘 What to Watch Next
If TSLA pulls back again in the future, we can draw a new Volume Profile over the latest bullish leg to locate its POC (I have drawn till the current high of the rally)
That level could once again serve as a potential fair value area and possibly repeat the same price behavior we’ve seen before.
What is your thought on point of control as a tool for investment purpose?
Share your views and hit the boost for more educational posts in future.
📣Disclaimer:
Everything shared here is meant for education and general awareness only. It’s not financial advice, nor a recommendation to buy, sell, or hold any asset. Do your own research, manage your risk, and make sure you understand what you’re getting into.
Your money, your responsibility; and if you’re unsure, ask a qualified financial professional. (Or at least run it by your pet - they’re great listeners 🐶).
Tesla’s profit growth is slowing, but macro tailwinds supportTESLA (TSLA): Profit growth is shrinking, but macro tailwinds still support the stock.
Fundamental Analysis
1. TESLA, Inc. leveled-off due to a mix factors. The decline came after a disappointing Q3 earnings report on Oct 22 that revealed tighter margins and slowing profits despite record quarterly revenue. However, sentiment began to stabilize late in the week as investors anticipated a Federal Reserve rate cut and progress in US–China trade talks.
2. Tesla’s Q3-2025 was a margin-compression story that capped price gains, despite record revenue of 28.1bln USD (+12% YoY), lower ASPs from global price cuts and a ~50% surge in R&D/AI infrastructure spend (Dojo, robotics) squeezed profitability.
3. An AI-led tech rally continued to provide support, and broader U.S. market strength limited Tesla’s downside as major indexes notched record highs ahead of an expected 25 bps Fed cut on Wednesday (Oct 29). Optimism around the Oct 31 Trump–Xi summit in South Korea also helped steady cyclicals and autos into week’s end.
Technical Analysis
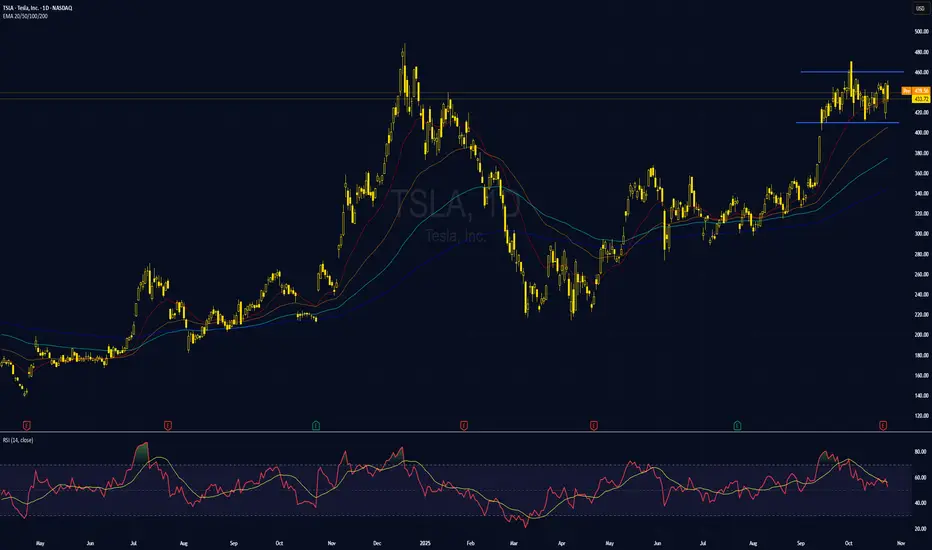
4. TSLA has moved sideways for more than a month after rallying out of the previous range. The bullish EMA stack still signals a broader uptrend, suggesting potential continuation once the consolidation phase ends.
5. TSLA may trade between 410–460 until a directional breakout in either direction.
6. However, a drop below the EMA200 would signal a bearish reversal toward the prior sideways zone near the 300 support area.
Analysis by: Krisada Yoonaisil, Financial Markets Strategist at Exness
TSLA: Watching Prior Resistance Turn into Key SupportIntroduction & Thesis
Tesla ( NASDAQ:TSLA ) is currently presenting a textbook technical setup on the daily chart. After a strong uptrend from May to October, the price has pulled back to a critical zone that previously acted as heavy resistance in early 2025. This analysis explains why this level is a crucial 'make-or-break' point for the bulls.
The Breakout and The Retest
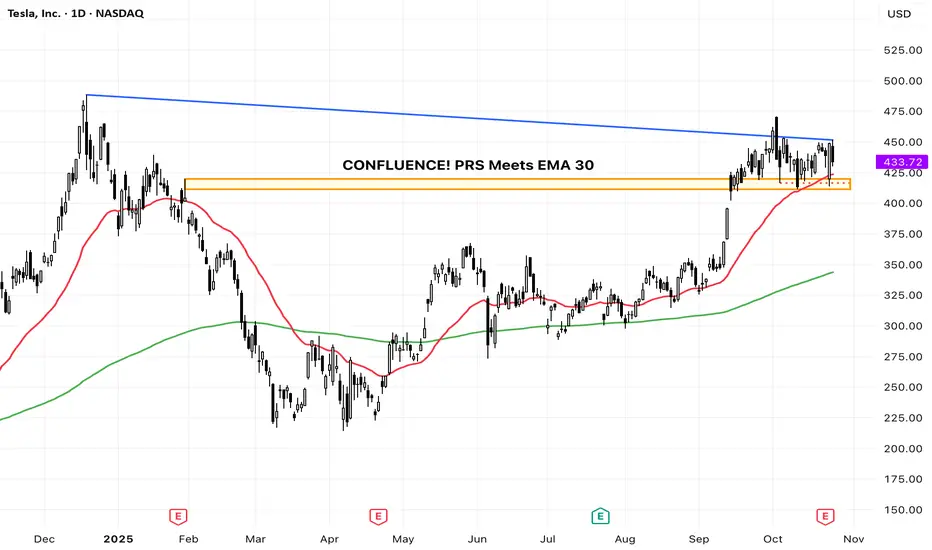
Observe the orange rectangle (approx. $410 - $425). This region was a significant ceiling for the price action earlier this year. According to technical theory, once a strong resistance level is decisively broken (which occurred in September), it is expected to flip its role and become a crucial support level. This is often referred to as a Prior Resistance Turned Support (PRS) area.
The price is currently pulling back right into this PRS zone, a common and healthy movement known as a retest.
Confluence of Support
Crucially, the 30-day Exponential Moving Average (EMA 30), which defines the short-term trend, is also converging with this key support zone. This creates a powerful confluence of support, significantly increasing the probability of a bounce. The long-term trend, indicated by the upward-sloping 200-day EMA (green line), remains firmly bullish, supporting the overall upward bias.
Scenarios
🎯 Bullish Scenario (The Bounce)
If the $410 - $425 zone holds and we see a strong bullish rejection candle (e.g., a hammer or engulfing pattern), it would confirm the support flip, suggesting the next leg of the rally towards the recent highs around $475.
🛑 Bearish Scenario / Invalidation (The Failure)
Conversely, a sustained daily close below $410 would be a crucial failure signal. This would invalidate the bullish retest thesis and suggest a deeper correction is underway, likely targeting the next major support zone around the 200-day EMA (currently near the $343 region).
📚 Educational Takeaway
This setup perfectly illustrates how traders look for confluence. The strongest support zones are those where multiple technical factors—like a former resistance level (PRS) and a strong moving average (EMA 30)—converge. A successful bounce here reinforces the power of market structure principles.
(Disclaimer: This is for educational purposes only and not financial advice.)
Tesla at major support. I'm long.Tesla is at major yearly support. Confluence between levels and fib. This is where we need to hold to maintain the trend on the monthly chart. I don't know if it will hang out at this level or possibly go below the level before we regain and higher. But this is a valid long trade at these levels. If we don't hold here it is much lower. Long term target is $670. Remember the fud around Tesla is meaningless. It's all the charts. If the markets were "rational" we wouldn't even be at these levels in the first place.

The New Trading Era: From Machine Intelligence to Human EdgeThe Oracle That Doesn’t Think but Mirrors
Everyone’s talking about the “rise of artificial intelligence” in trading, algorithms replacing traders, neural networks predicting the next move, machines that seem to think.
But the most extraordinary thing about machine intelligence isn’t its brilliance. It’s its astonishing ability to mirror, to absorb vast amounts of past data and recreate patterns it has already seen. A gigantic echo chamber of past realities.
In other words, what we call “intelligence” in these systems is not understanding, it’s reproduction. They don’t reason; they recognize. They don’t imagine; they approximate.
And yet, that ability to reflect a million past environments can feel almost magical, especially when it responds with coherence that seems human.
But here’s the quiet paradox: one the industry rarely talks about: What we’re witnessing isn’t a new form of intelligence; it’s a new kind of mirror, one that reveals how little we truly understand about our own decision-making.
When Machines Need to Learn the Market Every Day
For most of us, our first real encounter with AI came through models like ChatGPT, tools that belong to a specific subgroup of machine learning known as Large Language Models (LLMs), designed to simulate human-like conversation. That’s where our perception of AI as “brilliant and almost magical” was born. LLMs seem capable of answering anything, from trivial questions to complex reasoning.
Their power, however, doesn’t come from understanding the world. It comes from an extraordinary ability to predict language, a task that, despite its apparent complexity, is remarkably stable and mathematically manageable. The rest is simply scale: access to a massive database of accumulated knowledge, allowing the model not only to predict the next word but also to recreate an entire response by recognizing and recombining patterns it has already seen a million times before.
To understand this better, think of your phone’s autocomplete as a miniature version of ChatGPT, it guesses your next word based on your previous conversations. In such a stable environment, consistency is easy. That’s why language models achieve such high accuracy: their elevated “win rate” comes from playing a game where the rules rarely change.
They may look brilliant, but it’s better to say they’re simply hard-working machines in a stable world.
Trading, however, exists on the opposite side of the spectrum. It lives in a non-stationary world, one where the rules constantly evolve. Today’s conditions will be different tomorrow. Or in five minutes. Or in five seconds. No one knows when or how the shift will happen.
Here lies the crucial difference: a model that “understands” English doesn’t need to relearn grammar every week. A model that trades must relearn market reality every day.
Machine learning thrives on repetition. Markets thrive on surprise.
The Real Disruption: Human Understanding + Machine Power
By truly understanding the capabilities and limitations of machine learning in trading or more broadly, artificial intelligence, we realize that the future isn’t about removing humans from the equation. It lies in understanding how machine power compounds in the right hands.
The next era of trading won’t be about replacing human judgment but amplifying it.
Human contextual reasoning, our ability to interpret uncertainty, adapt, and make sense of nuance, can be combined with the machine’s immense capacity for data processing and execution.
Machines bring speed, scale, and memory. Humans bring intuition, flexibility, and judgment.
The synergy happens when both play their part: the trader designs the logic; the machine executes it flawlessly.
Machines cannot think, but they can learn, replicate, and act at a scale humans simply can’t compete with. When contextual thinking meets computational power, that’s not artificial intelligence, that’s real intelligence.
The trader who treats AI as a tool builds an edge. The one who treats it as an oracle builds a trap.
A Simple Manual for Thinking Right About AI in Trading
Never delegate understanding.
Let the machine calculate, but you must know why it acts. You can outsource the coding of a model, but never the architecture of your trading logic. The logic, the “why,” must remain human.
The basics still apply.
Machine learning doesn’t replace the foundations of trading, it only amplifies them. Risk management, diversification, position sizing, and discipline remain non-negotiable. A model can process data faster than you ever could, but it can’t understand exposure, capital allocation, or your personal tolerance for risk. Those are still your job.
Stay probabilistic.
The use of ML in trading doesn’t erase the hardest lesson of all: predicting prices is a false premise. The right question isn’t “Where will the market go?” but “How should I respond to what it does?” Now imagine the power of machine intelligence working within that probabilistic framework: a system designed to maximize your account’s expected value, not to guess Bitcoin’s price next month. That’s where the real explosion of potential lies.
Build systems that can evolve.
The future won’t belong to the trader with the smartest model, but to the one with the most adaptive one. And remember, you must be the most adaptive asset in your system. Markets evolve; your models must too. There’s no such thing as “build once and deploy forever.” In trading, anything that stops learning starts dying.
From the Illusion of Machine Intelligence to the Power of Human-Driven ML
Machine intelligence isn’t a new oracle, it’s a new instrument. In the wrong hands, it’s noise. In the right hands, it’s leverage. It can multiply insight, scale execution, and compound returns, but only when driven by an intelligent trader who understands its limits.
The trader understands, the machine executes. The trader teaches the machine; the latter amplifies the former’s reach.
In the end, it’s never the algorithm that wins, it’s the human who knows how to use it. And when both work together, one thinking, one learning, that’s not artificial intelligence anymore.
That’s compounded intelligence.
TESLA On The Rise! BUY!
My dear followers,
This is my opinion on the TESLA next move:
The asset is approaching an important pivot point 433.50
Bias - Bullish
Safe Stop Loss - 429.07
Technical Indicators: Supper Trend generates a clear long signal while Pivot Point HL is currently determining the overall Bullish trend of the market.
Goal -440.74
About Used Indicators:
For more efficient signals, super-trend is used in combination with other indicators like Pivot Points.
Disclosure: I am part of Trade Nation's Influencer program and receive a monthly fee for using their TradingView charts in my analysis.
———————————
WISH YOU ALL LUCK

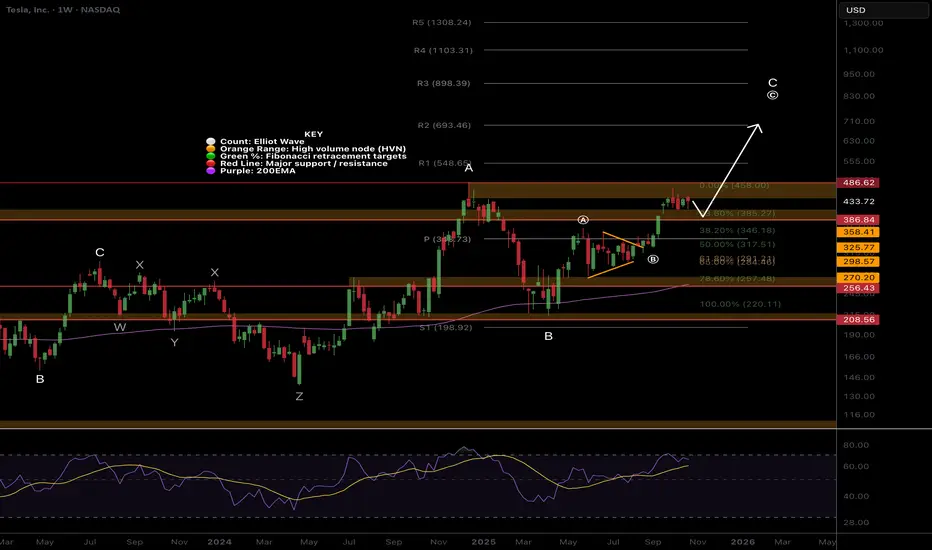
$TSLA higher to go!Price continues towards price discovery finding resistance at the previous all time High Volume Node. Price is above the weekly pivot and 200EMA which is bullish and has momentum.
Wave © of C appears to be underway into price discovery with a target of $693 the R2 weekly pivot. This is because it has been printing a series of 3 wave structures. Wave B printed a triangle which is a pattern found before a terminal move reinforcing the Elliot wave count.
RSI is not yet overbought.
Safe trading
Tesla Macro ChartSharing my Macro Chart.
Use this as a reference for the levels of interest mentioned in my previous tesla post. Added a 30 minute box within the weekly balance box.
I like to personally use this chart to monitor levels intraday on the 30 minute or to plan major shorts or buys.
Some of these levels were drawn a year ago probably but I hope you'll find them useful.
~The Villain

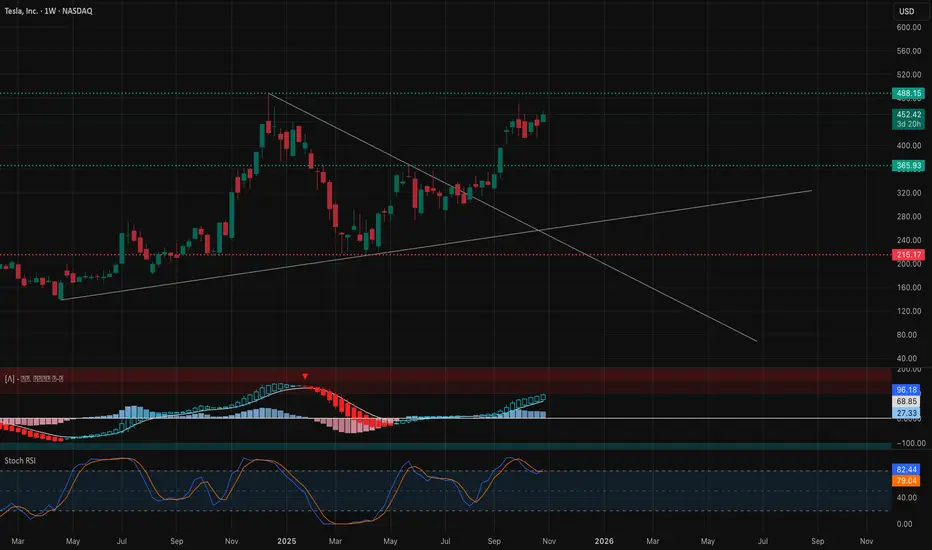
ARE TESLA MARKET BULLS BECOMING WEAK?Tesla Analysis (Weekly Timeframe)
Tesla is currently completing its first cycle wave since inception. The market started printing a primary wave 5, which is an ending diagonal in January 2023. Primary wave 5 comprise of 5 3-wave intermediate waves 1,2,3,4 and price is now printing intermediate wave 5. Intermediate wave 5 started printing in March 2025, minor wave A terminated in May 2025 and minor wave B, a running flat terminated in July 2025. The market is now printing an impulse minor wave C to complete the last 3-wave intermediate wave 5 that will complete primary wave 5 that will complete cycle wave 1. Intermediate wave 5 may be truncated, i.e., it does not necessarily have to touch the medium-term bullish resistance line (upper trendline). From here we will see a major primary wave ABC correction that may begin in Q1 of 2026.
Short entries (1) @ 488.93
Short entries (2) @ 511.04
SL @ 533.15
TP @ 321.47
"The big money is not in the buying or selling - but in the waiting" Charlie Munger
#SabaliCapital
#TechnicalAnalysis

Hello trader, this happened with TSLA TODAY.www.tradingview.com
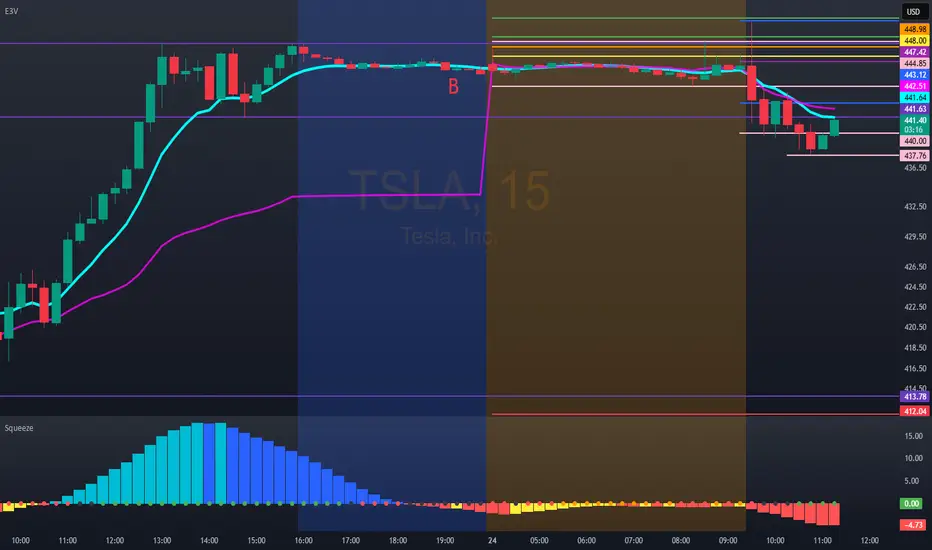
n the first part, we mentioned the negative economic report. In the second part, I explained that most of the time, the market anticipates a bullish move, expecting a result. The result was negative; the market sets a bullish trap. This was the result, looking at it on a 5M chart.
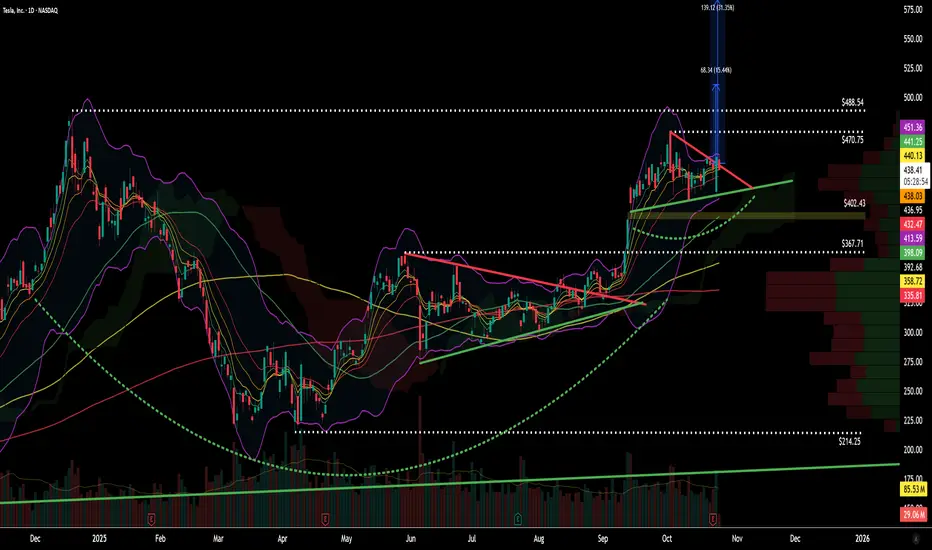
$TSLA – Bull Pennant Sequence & Cup-and-Handle ContinuationThis is a follow-up to my August–October technical outlook on Tesla ( NASDAQ:TSLA ).
After the first bull pennant breakout, price pushed to $470, falling just shy of my initial $480 target, before pausing and forming another bull pennant directly below December’s all-time high near $488.
Structure & Momentum
Momentum remains strong — the daily chart has now completed a cup and handle formation, adding a new layer of continuation confluence to the broader trend structure.
The key takeaway here is that NASDAQ:TSLA continues to respect rising MAs and trendline support, consolidating at high levels rather than breaking down — a bullish sign of controlled digestion after a strong run.
To confirm a full breakout continuation, the chart now needs a decisive move through $488 on high volume. Until that happens, the current pennant acts as both a compression zone and accumulation phase.
Breakout & Targets
If volume expands and NASDAQ:TSLA clears the $488 ATH, the next resistance targets are:
Target 1: $510 → symmetrical triangle 1:1 projection
Target 2: $580 → measured move from flagpole #2 (pennant #1 extension)
Both levels represent high-probability reaction zones where price could pause or retrace before resuming trend.
Support & Risk Management
Below, the chart shows clear structural support at:
$402 → prior breakout base and Ichimoku cloud zone
$367–$370 → trendline & confluence support
As long as price respects these zones, the setup remains valid and constructive.
A close below $370 on strong volume would invalidate the near-term bullish bias.
Technical Summary
✅ Trend: Bullish continuation
✅ Pattern: Cup & Handle + Bull Pennant #2
📊 Key Resistance: $488 (ATH)
🎯 Targets: $510 / $580
⚠️ Support Watch: $402 → $370
🔍 Trigger: Breakout confirmation on strong volume
Final Notes
Tesla continues to show a textbook multi-phase breakout structure — bull pennant, consolidation, and potential measured-move continuation. Until the breakout confirms, patience around $488 remains key. Once volume supports it, the next leg higher could complete the second flagpole move toward the $510–$580 range.
For educational and technical analysis purposes only.
Tesla Stock Wobbles as Profit Dives 37%, Revenue Pops. Now What?Tesla NASDAQ:TSLA posted a 12% jump in revenue on Wednesday, reaching $28.1 billion, well above Wall Street’s $26.37 billion estimate. And yet, the stock slipped nearly 1% on the day before paring back that loss with a 2.3% Thursday gain.
Why? Because profits fell faster than Cybertruck’s reputation — a 37% plunge year over year, with adjusted earnings per share at 50 cents versus the expected 54 cents.
It’s a classic Tesla paradox: sales are booming, but margins are thinning, and Wall Street can’t decide whether to cheer the top line or cry over the bottom one.
🏎️ The Cost of Staying in the Fast Lane
Tesla’s secret sauce has always been scale — crank out more cars, dominate market share, and let profits follow. But this quarter, the recipe’s a bit off. Automotive revenue rose 6% to $21.2 billion, yet net income plunged to $1.37 billion from $2.17 billion a year earlier .
What happened? Price cuts. Lots of them. Musk has been slashing sticker prices across markets to stay ahead in the EV race — great for consumers, painful for margins. Add a 50% spike in operating expenses (thanks, humanoid robots and AI labs), and suddenly that sleek electric machine looks a lot less money-making.
Still, Tesla’s revenue growth means one thing: demand isn’t dead. The EV slowdown hasn’t reached Palo Alto yet.
💰 Bitcoin Bounces
In a crypto-centric subplot, the company made $62 million from its Bitcoin BITSTAMP:BTCUSD stash last quarter.
The crypto’s 5% rise — ending the quarter around $114,000 — gave Tesla’s treasury a nice digital cushion. The company held roughly 11,000 Bitcoins during the three months through September.
🧠 The $1 Trillion Question
And then there’s the other storyline — the Elon Musk Show. Musk wrapped up the earnings call by pivoting from profits to power. Specifically, his proposed $1 trillion pay package , which he insists isn’t “compensation” at all but a question of “control.”
“I just don’t feel comfortable building a robot army here and then being ousted because of some asinine recommendations from ISS and Glass Lewis,” Musk quipped, slamming the proxy firms as “corporate terrorists.”
His plan is to secure roughly mid-20s voting power to keep Tesla’s destiny firmly in his hands while still, as he puts it, being “fireable if I go insane.”
If approved, Musk’s stake could surge from 13% to nearly 29%, giving him the leverage he says he needs to push Tesla toward an $8.5 trillion valuation — complete with robotaxis, humanoid bots, and up to 12 million cars sold annually.
🧾 The Takeaway
The stock is up roughly 16% in 2025, clawing back some early-year losses, but it still lags the Nasdaq Composite NASDAQ:IXIC and other mega-cap peers like Nvidia NASDAQ:NVDA and Meta $META.
The near-term question is simple: can Tesla tighten costs without killing growth? The long-term one is bigger: can Elon Musk lead the company into its next chapter without turning every quarter into a cliffhanger?
That said, the earnings season continues and the next batch of big tech heavyweights is right around the corner.
Off to you : What’s your take on Tesla and Musk’s lofty vision north of $1 trillion? Share your thoughts in the comments!

TSLA – Post-Earnings Breakout Clears Triangle Resistance Toward Tesla (TSLA) delivered a strong post-earnings reversal, breaking out of a multi-week symmetrical triangle pattern that had kept price compressed between $410 and $450. After initially trading lower on earnings, buyers stepped in aggressively, driving the stock from the low $420s all the way to a breakout high of $470.76, reclaiming both trendline and psychological resistance levels.
This move officially confirms a bullish breakout from the consolidation pattern formed since early September. The breakout is supported by strong volume, signaling momentum buyers returning after the earnings washout.
If price holds above $450–$455, Tesla could see continuation toward $480–$490 in the coming sessions. However, a pullback toward $440–$445 would be healthy and could provide a retest entry if bulls maintain control.
Support & Resistance Levels:
Support: $445.00 → $435.00 → $420.00
Resistance: $470.00 → $480.00 → $490.00
Bullish Play:
Entry: Above $455 breakout retest
Target: $475 → $485
Stop: Below $440
Options Idea: $480 Call (2–3 weeks out) if price holds above $450
