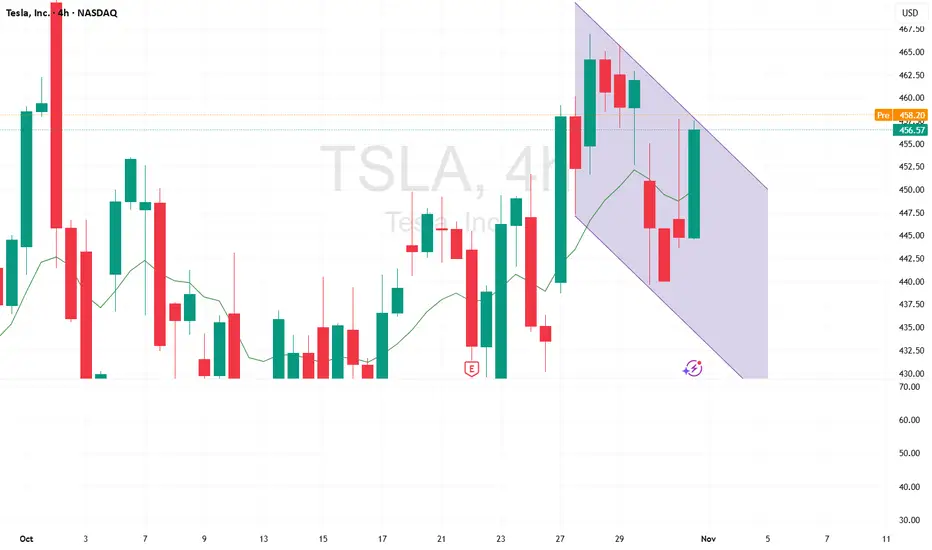
Tesla: Potential Breakout Coming?Tesla has consolidated for more than two months, and some traders may think a breakout is coming.
The first pattern on today’s chart is the $436.23 level, a previous record weekly close from December. The EV maker has fluctuated on either side of that price since late September without backing down. Is long-term resistance fading?
Second, TSLA has made higher highs and mostly higher lows since October 10. (The only exception came on October 23 following quarterly results. Even then, prices quickly recovered from the opening drop.)
Third, the 8-day exponential moving average (EMA) has stayed above the 21-day EMA. That may reflect a bullish short-term trend.
Next, Wilder’s Relative Strength Index (RSI) has moderated from above 80 while staying over 50. That may suggest an overbought condition has faded without direction turning south.
Finally, TSLA is an active underlier in the options market. (Its average volume of 2.3 million contracts per session ranks second in the S&P 500, according to TradeStation data.) That could help traders take positions with calls and puts.
TradeStation has, for decades, advanced the trading industry, providing access to stocks, options and futures. If you're born to trade, we could be for you. See our Overview for more.
Past performance, whether actual or indicated by historical tests of strategies, is no guarantee of future performance or success. There is a possibility that you may sustain a loss equal to or greater than your entire investment regardless of which asset class you trade (equities, options or futures); therefore, you should not invest or risk money that you cannot afford to lose. Online trading is not suitable for all investors. View the document titled Characteristics and Risks of Standardized Options at www.TradeStation.com . Before trading any asset class, customers must read the relevant risk disclosure statements on www.TradeStation.com . System access and trade placement and execution may be delayed or fail due to market volatility and volume, quote delays, system and software errors, Internet traffic, outages and other factors.
Securities and futures trading is offered to self-directed customers by TradeStation Securities, Inc., a broker-dealer registered with the Securities and Exchange Commission and a futures commission merchant licensed with the Commodity Futures Trading Commission). TradeStation Securities is a member of the Financial Industry Regulatory Authority, the National Futures Association, and a number of exchanges.
Options trading is not suitable for all investors. Your TradeStation Securities’ account application to trade options will be considered and approved or disapproved based on all relevant factors, including your trading experience. See www.TradeStation.com . Visit www.TradeStation.com for full details on the costs and fees associated with options.
Margin trading involves risks, and it is important that you fully understand those risks before trading on margin. The Margin Disclosure Statement outlines many of those risks, including that you can lose more funds than you deposit in your margin account; your brokerage firm can force the sale of securities in your account; your brokerage firm can sell your securities without contacting you; and you are not entitled to an extension of time on a margin call. Review the Margin Disclosure Statement at www.TradeStation.com .
TradeStation Securities, Inc. and TradeStation Technologies, Inc. are each wholly owned subsidiaries of TradeStation Group, Inc., both operating, and providing products and services, under the TradeStation brand and trademark. When applying for, or purchasing, accounts, subscriptions, products and services, it is important that you know which company you will be dealing with. Visit www.TradeStation.com for further important information explaining what this means.
Trade ideas

TESLA COULD BREAK $500 IMMINENTLYIn this video, we look at the current setup on Tesla and I give my reasoning on why we are bullish

C&H on TESLABuy and hold, strong move towards 700-800 USD
CUP and HANDLE PATTERN USUALLY HAS HIGHEST PROBABILTY TO BREAK UPSIDE

TSLA Is Building Momentum Toward New HighsTesla continues to show strong momentum, with higher lows forming across recent sessions. The trend structure remains constructive, and momentum indicators are pointing toward a possible extension toward new highs in the coming week i.e. $500+
According to my Trade Navigator model — a data-driven system that tracks breakout momentum and overall market strength; the readings remain elevated, suggesting that bulls still have room to run.
A sustained close above recent resistance could confirm the next leg higher.
(Educational content only — not financial advice.)
#TSLA #stocks #TradeNavigator #Momentum
TSLA QuantSignals V3 Swing 2025-11-01TSLA QuantSignals V3 Swing 2025-11-01
TSLA Swing Signal | 2025-11-01
• Direction: BUY CALLS | Confidence: 55%
• Horizon: 20 days to 2025-11-21
• Strike Focus: $425.00
• Entry Range: $43.52
• Target 1: $65.28
• Stop Loss: $32.48
• 1W Move: -0.44%
• 2W Move: +0.11%
• Volume vs Prior Swing: 0.8×
• Swing Range: $439.61 - $467.00
• 🔴 HIGH RISK WARNING: Use only small position size due to lower confidence and high uncertainty.
⚖️ Compliance: Educational swing commentary for QS Premium. Not financial advice.
🎯 TRADE RECOMMENDATION
Direction: BUY CALLS
Confidence: 55%
Conviction Level: LOW
🧠 ANALYSIS SUMMARY
Katy AI Signal: NEUTRAL with bearish bias (target $452.89, stop $462.94) - but institutional guidance shows BUY CALLS primary bias (+1.8 composite score)
Technical Analysis: Strong bullish gap (+0.11%), price in upper swing zone (60.2%), all EMAs aligned bullish, but MACD bearish and trend strength WEAK
News Sentiment: Mixed with high-impact Tesla stories - Michael Dell/Cathie Wood supporting Musk's pay package is bullish, but political/regulatory uncertainty creates headwinds
Options Flow: Extremely bearish Put/Call Ratio (10.99) suggests institutional pessimism, max pain at $455.00 below current price
Risk Level: HIGH - conflicting signals between directional guidance and options flow, weak momentum despite recent 5.40% gain
💰 TRADE SETUP
Expiry Date: 2025-11-21 (20 days)
Recommended Strike: $425.00
Entry Price: $43.40 - $43.65
Target 1: $65.28 (50% gain from entry)
Target 2: $86.95 (100% gain from entry)
Stop Loss: $32.48 (25% loss from entry)
Position Size: 2% of portfolio (low conviction requires reduced exposure)
⚡ COMPETITIVE EDGE
Why This Trade: Multi-timeframe STRONG_BULLISH alignment vs single-day noise creates swing opportunity
Timing Advantage: 20-day expiry provides buffer for weak momentum to strengthen, gap support at $433.22
*
Image
QS Analyst
APP
— Yesterday at 8:56 PM
*Risk Mitigation: Balanced delta (0.725) provides optimal risk/reward, stop protects against Katy's bearish $462.94 resistance
🚨 IMPORTANT NOTES
⚠️ CRITICAL CONFLICT**: Options flow shows extreme bearish positioning (P/C ratio 10.99) contradicting directional guidance
⚠️ Katy AI actually signals NEUTRAL with bearish bias - trade goes against primary AI engine recommendation
⚠️ Weak bullish signal (score: 0.8) requires cautious position sizing and tight risk management
⚠️ Monitor $455.00 max pain level as potential resistance zone
📊 TRADE DETAILS 📊
🎯 Instrument: TSLA
🔀 Direction: BUY 📈
🎯 Strike: 425.00
💵 Entry Price: 43.52
🎯 Profit Target: 65.28
🛑 Stop Loss: 32.48
📅 Expiry: 2025-11-21
📏 Size: 2.0
📈 Confidence: 55%
⏰ Entry Timing: N/A
🕒 Signal Time: 2025-11-01 23:56:15 EDT
🔴 HIGH RISK WARNING: Use only small position size due to lower confidence and high uncertainty.

Is Tesla Setting Up for a Rebound? Key Entry Levels Inside🎯 TSLA: The "Thief Strategy" Playbook | Swing/Day Trade Setup 📈
🔥 Quick Overview
Asset: Tesla, Inc. (TSLA)
Bias: 🐂 BULLISH
Strategy Type: Thief Layering Entry Method
Risk Level: Medium-High (Swing/Day Trade)
💰 The "Thief" Entry Strategy Explained
The "Thief Strategy" uses multiple limit orders (layering method) to accumulate position at different price levels. Think of it like setting traps at various floors of a building—you catch opportunities wherever price decides to visit! 🎣
📊 Entry Zones (Layer Your Orders):
Layer 1: $430.00
Layer 2: $435.00
Layer 3: $440.00
💡 You can add more layers based on your own risk appetite and account size. The beauty of layering? You average your entry and reduce timing risk!
🛡️ Stop Loss (SL):
Thief SL: $415.00
⚠️ Important Note: This is MY stop loss level based on the Thief Strategy framework. You're the captain of your own ship! 🚢 Adjust your SL based on YOUR risk tolerance and account management rules. Trade at your own risk—make money, take money, manage wisely!
🎯 Target (TP):
Primary Target: $490.00
🚨 Why $490? This zone represents a confluence of:
Strong resistance area
Potential overbought conditions
Historical trap zone where bulls get exhausted
📢 Thief OG's Reminder: I'm NOT saying you MUST take profit only at my TP level. If you see profits that make you smile, SECURE THEM! 💵 The market gives, and the market takes. Be greedy when you can, be smart always.
🔍 Technical Analysis Breakdown
Tesla is showing bullish momentum structure with potential for continuation toward the $490 resistance zone. The layering strategy allows us to build position as price potentially dips into demand zones before the next leg up.
Key Technical Levels:
Support Zone: $430-$440 (Our entry layers)
Invalidation: Below $415 (Stop loss)
Resistance Target: $490
📌 Related Pairs to Watch (Correlation Play)
Understanding correlated assets helps confirm your thesis:
AMEX:SPY (S&P 500 ETF)
TSLA often moves with broader market sentiment
Watch SPY for overall risk-on/risk-off environment
NASDAQ:QQQ (Nasdaq 100 ETF)
Tech-heavy index where TSLA is a major component
Strong correlation with TSLA price action
NASDAQ:NVDA (NVIDIA)
Both are high-beta tech growth stocks
Often move together during risk appetite shifts
TVC:DXY (US Dollar Index)
Inverse correlation: Strong dollar = pressure on growth stocks like TSLA
Weak dollar = tailwind for equities
💡 Key Point: If SPY/QQQ are bullish + DXY weakening = Strong confirmation for TSLA upside!
⚡ Trading Tips for Thief OG's
Don't FOMO — Let price come to your layers
Manage position size — Each layer should be equal weight
Trail your stop — Once profitable, protect gains
Watch volume — Confirm breakouts with volume spikes
Stay flexible — Market conditions change; so should you!
🎬 Final Words
This setup is all about patience, precision, and profit extraction! 🎯 The Thief Strategy isn't about stealing from the market—it's about being SMART and setting yourself up for success with calculated entries.
Remember: The best trades are the ones where you're prepared, not scared! 😎
✨ If you find value in my analysis, a 👍 and 🚀 boost is much appreciated — it helps me share more setups with the community!
#TSLA #TeslaStock #SwingTrading #DayTrading #ThiefStrategy #LayeringStrategy #StockMarket #TradingIdeas #TechnicalAnalysis #BullishSetup #TradingStrategy #RiskManagement #StockTrading #MarketAnalysis #TradingCommunity

TESLA Technical Analysis! BUY!
My dear friends,
Please, find my technical outlook for TESLA below:
The price is coiling around a solid key level - 404.39
Bias - Bullish
Technical Indicators: Pivot Points Low anticipates a potential price reversal.
Super trend shows a clear buy, giving a perfect indicators' convergence.
Goal - 426.96
About Used Indicators:
The pivot point itself is simply the average of the high, low and closing prices from the previous trading day.
Disclosure: I am part of Trade Nation's Influencer program and receive a monthly fee for using their TradingView charts in my analysis.
———————————
WISH YOU ALL LUCK

Tslar4BearsThe
tslar's
elon musk recent vote likely to favor
the
bears temporarily
as
we
go
into
the
new
week
Though the year may likely end bullish

TSLA BULLISH BIAS RIGHT NOW| LONG
TSLA SIGNAL
Trade Direction: short
Entry Level: 404.30
Target Level: 433.84
Stop Loss: 384.55
RISK PROFILE
Risk level: medium
Suggested risk: 1%
Timeframe: 5h
Disclosure: I am part of Trade Nation's Influencer program and receive a monthly fee for using their TradingView charts in my analysis.
✅LIKE AND COMMENT MY IDEAS✅

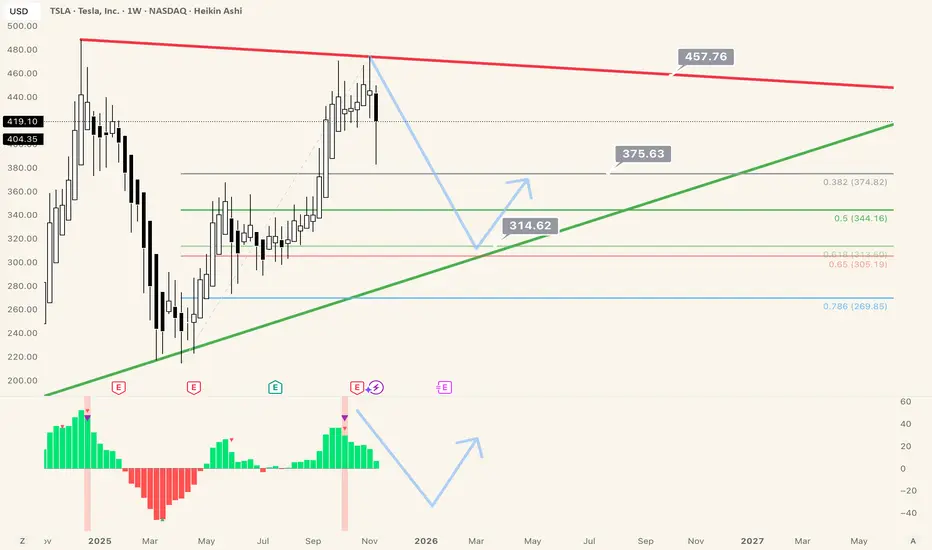
TSLA: Explosive Breakout to $457 or Brutal Fib Crash to $306?The weekly chart shows TSLA in a multi-month consolidation, forming what looks like a symmetrical triangle or wedge pattern. Price has been respecting a descending resistance line, sloping down from highs near 470s to current levels, and an ascending support line, rising from lows around 214-310 toward ~344-374.
If history repeats itself, we can see on the chart that our pull back in recent weeks from highs near 474 (early November) may continue to down to the bottom of the trend at around to 350 depending upon the timing. if it happens fast, the bottom of the channel will be much lower around 306-314.
I think above 383 level we can continue our consolidation and upward trajectory if we break 429 with volume support.
Unfortunately, given what I see in my modified MACD indicator, I think the most likely scenario is we rally to 429 and get rejected to go down and test 375 level and possibly below that go visit 314 to 340 zone.
Also 12-week cumulative VWAP at 415.78. Price is below this level (404.35), indicating short-term bearish bias, but proximity suggests potential mean reversion if momentum flips.
This is a weekly chart so this will take some time to play out. I will be accumulating TSLA below 383 level.
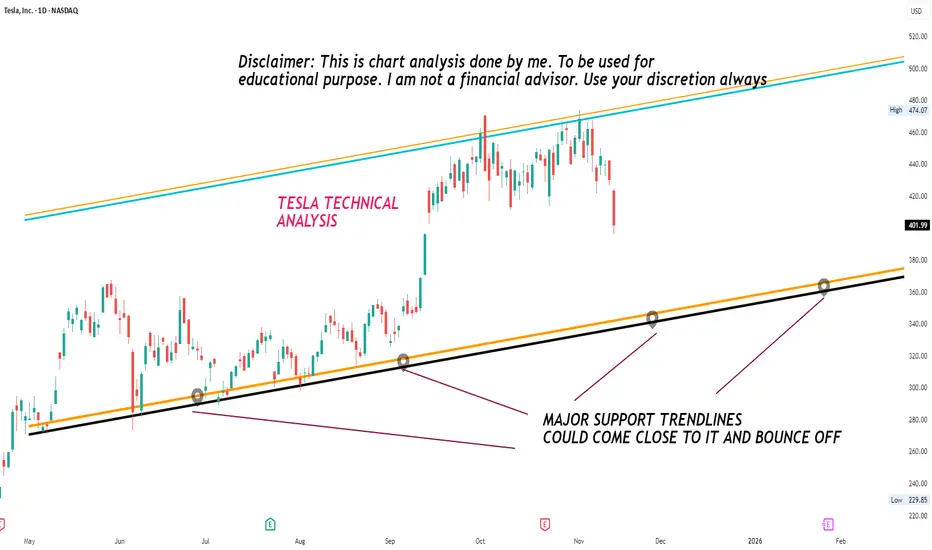
My technical analysis on TESLA based on the daily ChartShowing on chart major support trend line from where it can bounce off based on
TSLA Slips Despite Record Q3 Deliveries AI Growth Play?TSLA – Financial Performance & SWOT Analysis
TSLA Slips Despite Record Q3 Deliveries AI Growth Play?
(1/9)
Good Morning, folks! TSLA is pulling back 📉, at $ 436.33 up 7.85% YTD per October 10, 2025. AI integration shakes up this EV play , let’s dive in! 📊🔥 Tag a friend who needs this investing hack!
(2/9) – PRICE PERFORMANCE
• Last day: $ 436.33, down slightly pre-market 📉
• YTD 2025: up 7.85%, lagging S&P 500 🔄
• Q3 2025: record deliveries, but stock dips 🚀
This EV stock’s volatility, AI hype pops! 💥
(3/9) – MARKET POSITION
• Market Cap: $ 1.45T, industry giant 🏆
• Avg Volume: 88.96M shares, high liquidity 💧
• Trend: high P/E amid growth expectations 👑
This asset’s dominance, holding tight! 🔒
(4/9) – KEY DEVELOPMENTS
• Q3 deliveries: record highs, beat estimates 💰
• Stock dip: despite beats, tax credits end 🏭
• AI focus: Robotaxi event Oct 22, autonomy push 📈
This EV move, AI-driven surge! ⚡
(5/9) – RISKS IN FOCUS
• High volatility: beta 2.09 swings ⚠️
• Subsidies end: EV tax credit phaseout 🆚
• Market liquidations: $700M crypto-wide impact 📉
This ticker’s exposure, watch these twists! ⚠️🔄
(6/9) – SWOT: STRENGTHS
• EV leadership (deliveries.): market share 🌟
• AI integration (FSD/Robotaxi.): growth edge 🤖
• Institutional demand (ETFs.): sentiment boost 👥
This asset’s edge, built tough! 💪
(7/9) – SWOT: WEAKNESSES & OPPORTUNITIES
• Weaknesses: high valuation, subsidy reliance ⚖️
• Opportunities: AI boom, EV rebound 🌍
Can this ticker beat the odds? 🎲 Reply with your take!
(8/9) – POLL TIME!
TSLA’s $ 436.33 value, your vibe?
• Bullish: $500+ soon, AI beats 📈🚀
• Neutral: Steady, risks balanced ⚖️🛡️
• Bearish: $400 looms, subsidy hits 📉⚠️
Chime in below! 💬 Tag a friend for this poll!
(9/9) – FINAL TAKEAWAY
TSLA’s $ 436.33 position shows resilience 💪, AI fuels it ⚡. Risks bite 🦈, yet dips are DCA gold 💎. We grab ‘em low, climb like pros! Gem or bust? not advice, just our spin!
#TSLA #Investing #Markets #Trading #Finance #ETF #Commodities #DCA #Trends
TSLA is mixed as of October 10, 2025, at $ 436.33, up 7.85% YTD per TradingView. Q3 deliveries shape its path in the EV space. Here’s a factual financial and strategic breakdown.
**Financial Performance**
Price Movement: YTD at $ 436.33, up 7.85%. Broader period shows pullback from highs. Q3 adds upside, with record deliveries.
Volume & Market Cap: Avg volume 88.96M shares. Market cap at $ 1.45T.
Key Metric: Trailing P/E 256.20, forward P/E 172.41.
**SWOT Analysis**
Strengths:
- Record Q3 deliveries.
- AI and autonomy integration.
- Institutional interest.
Weaknesses:
- High valuation multiples.
- Subsidy phaseout impact.
- Recent stock pullback.
Opportunities:
- AI and Robotaxi growth.
- EV market rebound.
- New model launches.
Threats:
- Intense competition.
- Market corrections.
- Regulatory changes.
**TSLA vs. SPY: Key Comparisons**
| Aspect | TSLA | SPY |
|--------|------|-----|
| Purpose & Scope | EV and AI focus | Broad market index tracking |
| Dynamics | Beta 2.09 volatility vs. lower 1.00 | Steady benchmark |
| Market Position | Up 7.85% YTD, high P/E vs. S&P gains | Stable exposure |
**Investor Considerations: DCA**
Dollar Cost Averaging: TSLA’s volatility suits dip-buying. At $ 436.33, $10,000 buys ~23 shares; a 10% dip to $ 393 nets ~25 shares. Time in the market, not timing it, wins.
**Outlook & Risks**
TSLA’s $ 436.33 position shows AI edge, with delivery beats. Subsidy ends loom, yet dip grabs turn volatility into gains. AI or EV growth could sway it, but time’s our edge. Gem or fade? Depends on autonomy adoption.

TSLA: risky pullback, but potential long view planTSLA:
.
Risky pullback, but potential long view plan.
Just a shakeout as plan.
Wait n buy the dip!
.
US STOCKS- WALL STREET DREAM- LET'S THE MARKET SPEAK!

Tesla - The Bullish Path Is Clear... For Now.Hey Traders! It’s been a while since I posted about TSLA. This one isn’t an in-depth LTF breakdown — instead, we’re zooming out to identify the higher-timeframe targets and where price wants to go before any real continuation can happen.
The market runs on liquidity — and the less of it there is, the harder it is for price to move freely. Because TSLA carries so much liquidity and volatility, we don’t need the same slow, drawn-out liquidity builds that other stocks require. The swings are large and the algorithms respect because the liquidity is always there.
When we zoom out, the structure becomes clearer. The market consistently gives us signs before each major move — and on a higher-timeframe bullish Tesla, the price action is guided by white tapered selling, which acts as our roadmap for healthy continuation.
But here’s the nuance:
The higher up in timeframe we go, the more liquidity is required to sustain the next leg. That’s why we often see price digging deep into previously proven and broken algorithms before continuing higher. It’s not randomness — it’s the market refueling for expansion.
The path is pretty clear ahead for TSLA that we'll need to take advantage of HTF algorithms in order to break out of a much HTF liquidity structure.
Happy Trading:)

What's happening at Tesla!!I think Tesla should reach a price range of about $50 cheaper than the current price along the box drawn in the chart!

$TSLA could be pulling back right into 𝘀𝘂𝗽𝗽𝗼𝗿𝘁 NASDAQ:TSLA could be pulling back right into a major 𝘀𝘂𝗽𝗽𝗼𝗿𝘁 𝘇𝗼𝗻𝗲 𝗼𝗻 𝘁𝗵𝗲 𝘄𝗲𝗲𝗸𝗹𝘆 𝗰𝗵𝗮𝗿𝘁 𝗮𝗿𝗼𝘂𝗻𝗱 $𝟯𝟴𝟬.
This is the kind of retest that often decides the next chapter. Hold this level, and the structure stays intact with room to rebuild momentum. 𝗟𝗼𝘀𝗲 𝗶𝘁, 𝗮𝗻𝗱 𝘁𝗵𝗲 𝗱𝗼𝗼𝗿 𝗼𝗽𝗲𝗻𝘀 𝘁𝗼𝘄𝗮𝗿𝗱 𝘁𝗵𝗲 𝗹𝗼𝘄𝗲𝗿 𝘀𝘂𝗽𝗽𝗼𝗿𝘁 𝗻𝗲𝗮𝗿 𝟯𝟭𝟱.
tesla is bulish ...Two bullish scenarios are conceivable for Tesla: 1. A return to the broken level and a price pump 2. A move upwards without a return due to the intense buying pressure resulting from hitting the strong demand level.
lets see ....

TSLA: WaverVanir Edge – $TSLA Daily Outlook⚡ WaverVanir Edge – NASDAQ:TSLA Daily Outlook
NASDAQ:TSLA rejected from the 0.382 Fib ($466.9) and is hovering near $445, showing short-term weakness after an extended rally.
Auto-Fib map reveals liquidity clusters:
🟢 Premium Zones: $484 → $501 → $525 (target expansion levels)
🔴 Discount Zone: $411.6 major support
⚖️ Current equilibrium around $445 — consolidation before directional break.
WaverVanir DSS: Bearish divergence (−14% 30-day projection)
Institutional Model: Bullish rebound (+9% target → $485.6)
Edge Consensus: ⚠️ Range compression — volatility pocket between $411 and $466.
🌍 Macro & Catalysts
⚙️ FSD/AI expansion and Energy storage growth remain medium-term bullish
💰 Margins still under pressure amid price cuts & China competition
🏦 Fed tone mildly dovish → liquidity supportive, but yield volatility persists
🔋 Watch raw material cost trends (lithium, nickel) into Q1-2026
Base Path (WaverVanir Scenario):
Pullback → $420–$411 → re-accumulation → breakout >$466 to retest $484
“When volatility converges, conviction breaks. Patience over bias.”
#TSLA #WaverVanir #VolanXDSS #Fibonacci #SmartMoneyConcepts #AITrading #Macro #ElonMusk #StockMarket #RiskOn

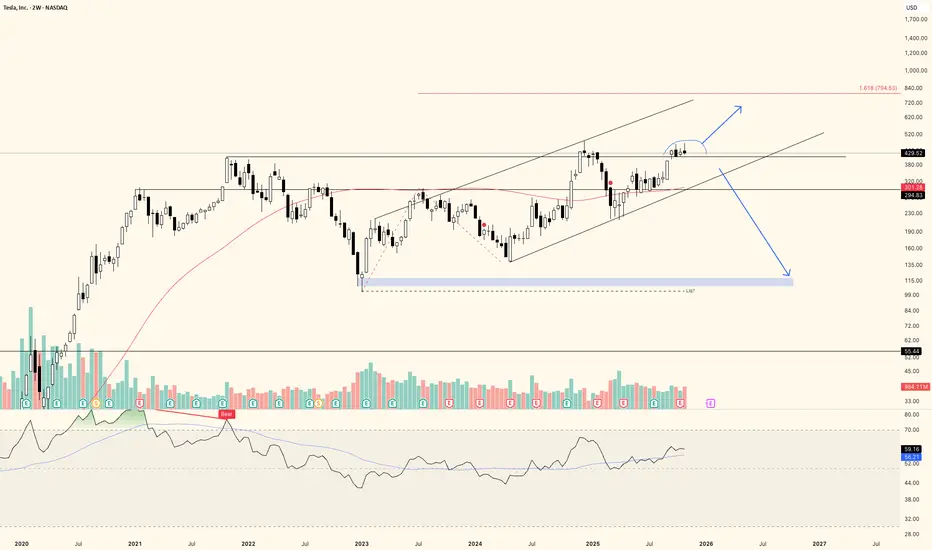
TSLA is giving mixed signals. Range low next move?I must say I have a very dualistic view on TSLA here. I think there is certainly a possibility of this becoming a prolonged consolidation with another move towards the downside of the range. On the other hand, that 1.618 extension to the upside als looks like a very valid target. Needless to say, while most people seem to stare blindly at TESLA great promises, I'm a little more skeptical to say the lest.
- Earnings have been going down over the years
- Revenue has stayed somewhat flat, with high odds of continuing to decline in China
- First their cars were going to change the world, then it was their energy solutions, then FSD became the narrative (Once done, FSD would instantly scale to worldwide usage and work everywhere, but currently their taxi service that would expand rapidly is geofenced), now Optimus is the narrative.
Elon is holding a carrot
- My point is: Elon is holding a carrot in front of us. I'm not saying Tesla is not doing great things. Their progress on FSD is real. But unless they will actually start to deliver real revenue and real profit, it will continue to be hyped up promises.
- For example, the EPS of XETR:VOW is 13x higher than Tesla's. Current Price to Earnings ratio for Tesla is at 300x.
So is it that weird to find that TA is giving mixed signals and possibly pointing towards range low?
Simple outlook
Anyway, this is my plan:
- I'll assume we are going up for 1.618 UNLESS
- We deviate back below previous ATH level. Then I think odds are starting to shift in favor of a bigger downward move.
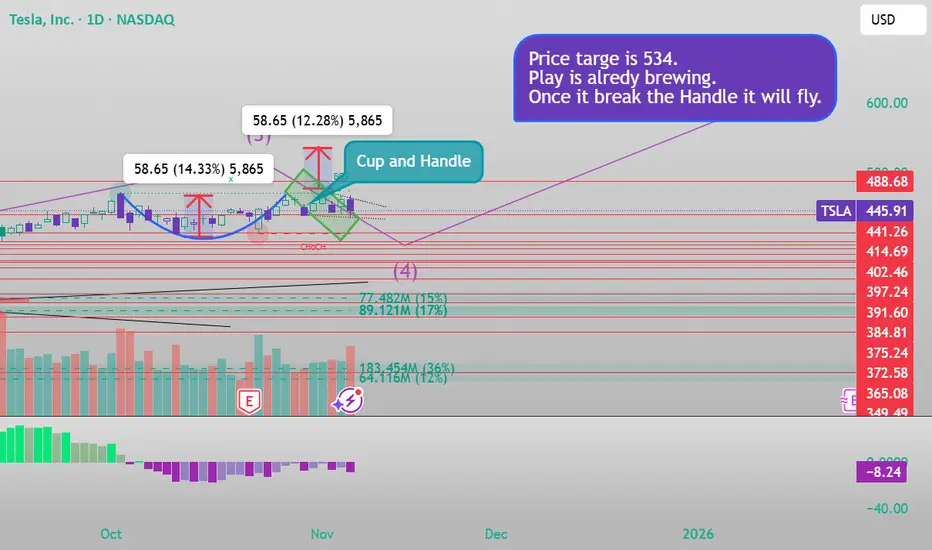
Cup and handleYou can see the cup and Handle in the Daily timeframe. It Will fly soon. My price target is 534 once it break the handle. You see this here at first.
X
@Sandeep194924
Dip to 449 and revers along with RSI divergenceTSLA can di tomorrow to 449 and reverse. a great swing possible with 449 entry l;eading to 460+
A short-term buy tradeCould this be a short-term buy trade?
Stop loss below $411.
The target profit could be around $670. Exiting in case of a change in conditions midway is also possible.

Emotional Trading AreaBehavior Analysis combined with your price-action trading skills can help tremendously in making your trading decisions. I believe that candlestick wicks (shadow) show us where traders will act emotionally before executing their trades. These wicks indicate earlier price rejection and create and area where emotions take over before execution. Decision time.
