$TXN — Watching a clean continuation setupNASDAQ:TXN — Watching a clean continuation setup
Price reclaimed the $165.9 level and is holding strength above VWAP structure. The current pullback looks corrective, not distributive. If buyers defend the mid-zone again, the path toward $180.7 remains open.
Clear liquidity pocket above → bullish
Texas Instruments Incorporated Shs Cert. Deposito Arg. Repr. 0.20 Shs
No trades
0.90 USD
4.24 B USD
13.89 B USD
About Texas Instruments Incorporated
Sector
Industry
CEO
Haviv Ilan
Website
Headquarters
Dallas
Founded
1930
Identifiers
2
ISINARDEUT111622
Texas Instruments Incorporated engages in the design and manufacture of semiconductors. It operates through the following segments: Analog, Embedded Processing, and Other. The Analog segment semiconductors change real-world signals, such as sound, temperature, pressure or images, by conditioning them, amplifying them and often converting them to a stream of digital data that can be processed by other semiconductors, such as embedded processors. The Embedded Processing segment involves handling specific tasks and can be optimized for various combinations of performance, power, and cost, depending on the application. The company was founded in 1930 and is headquartered in Dallas, TX.
Related stocks

$TXN – WaverVanir EdgeNASDAQ:TXN – WaverVanir Edge
Texas Instruments just printed a clean higher-timeframe reversal off a major demand zone.
Structure
Strong reaction from $156–157 demand
First impulse leg forming with momentum
Clear path toward $176.65 → $192.45 → $206.56
Multi-month range reclaim underway
Why i

TXN in BUY ZONEMy trading plan is very simple.
I buy or sell when either of these events happen:
* Price tags the top or bottom of parallel channel zones
* Money flow volume spikes beyond it's Bollinger Bands
So...
Here's why I'm picking this symbol to do the thing.
Price in buying zone at bottom of channels
M

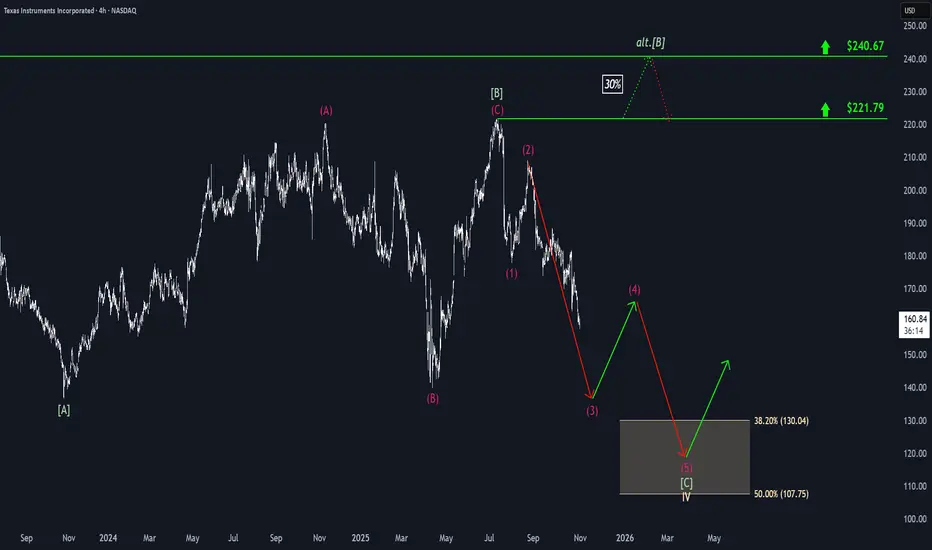
Texas Instruments: Extending DeclinesDespite some interim countermoves, Texas Instruments continued to see further sell-offs, advancing our primary scenario. Currently, we still see additional downside potential in magenta wave (3) before expecting a temporary rebound in wave (4). With wave (5), TXN is likely to dip into our beige Targ
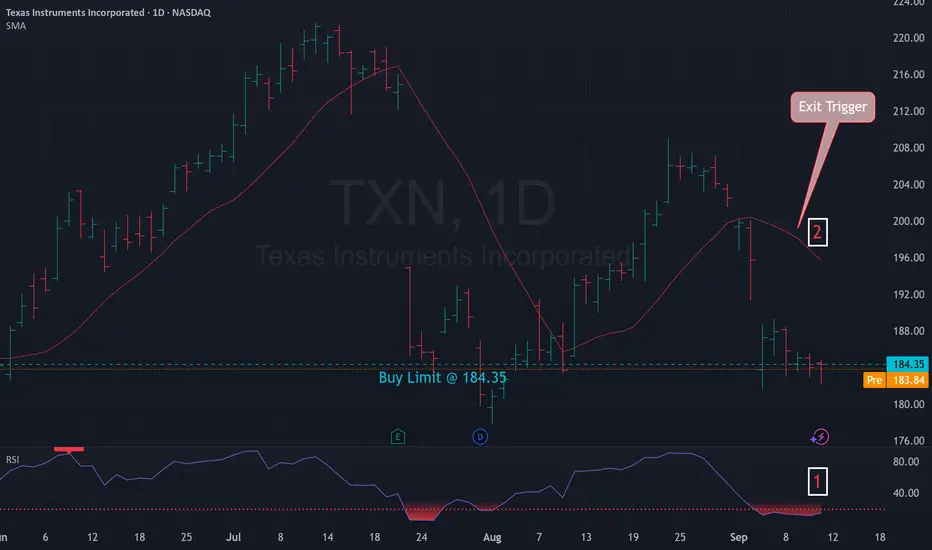
Mean Reversion Setup: TXN1. RSI in oversold region
2. Price likely to rebound back the the mean
Trade Rules:
Entry Trigger - RSI has cross below oversold region, enter limit buy at close price
Exit Trigger - Close at market when close price cross above exit trigger (Red Line)
TEXAS INSTRUMENTS BACK TO 200 Why Texas Instruments (TXN) Could Rebound to $200 by 2026: Semiconductor Revival TXN's trading at ~$182 today (Sep 23, 2025), down ~20% from its $230 peak amid industrial softness and China tariffs, but with EPS surging 20%+ and analog demand roaring back, $200 (10% upside) is a slam-dunk floor by E
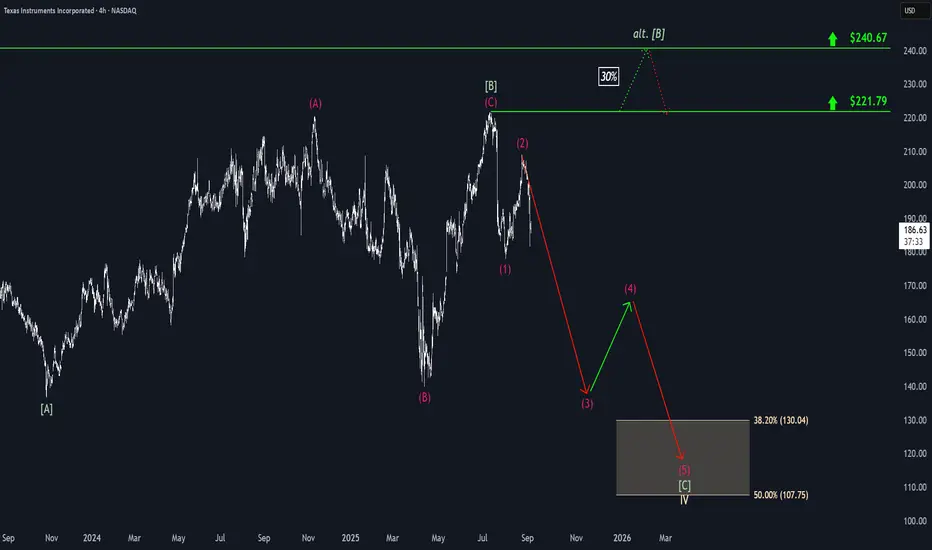
Texas Instruments: Rebound Underway, But Downside Still in PlayTexas Instruments initially continued its decline but has recently shown early signs of a rebound. Nonetheless, we still see greater downside potential in magenta wave (3), and expect the broader bearish magenta impulse to ultimately extend into the beige zone between $130.04 and $107.75. Should a n

Texas Instruments: Second Leg Down CompleteTexas Instruments has experienced sharp sell-offs, leading us to confirm the top of magenta wave (2). This suggests that the stock has completed the second stage of the ongoing magenta downward impulse. The current wave (3) still presents significant downside potential in the near term. After a brie
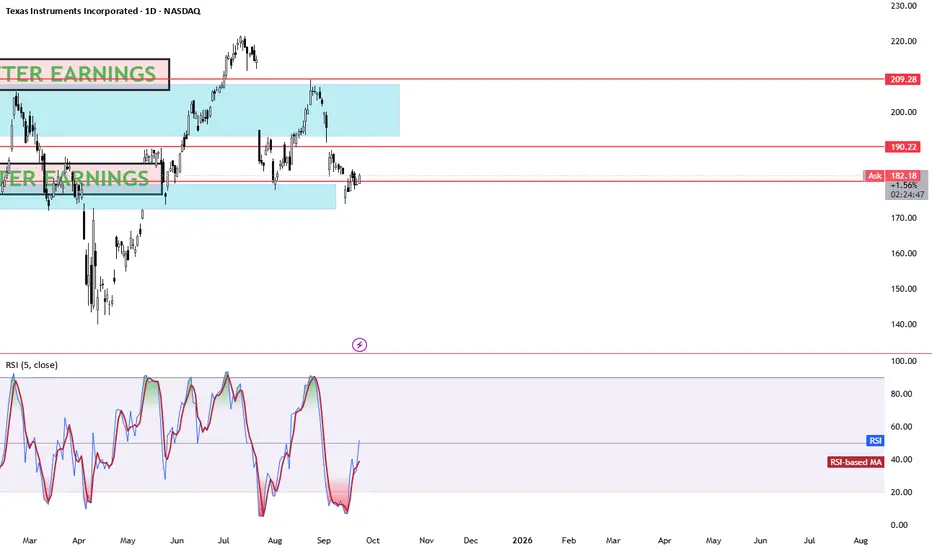
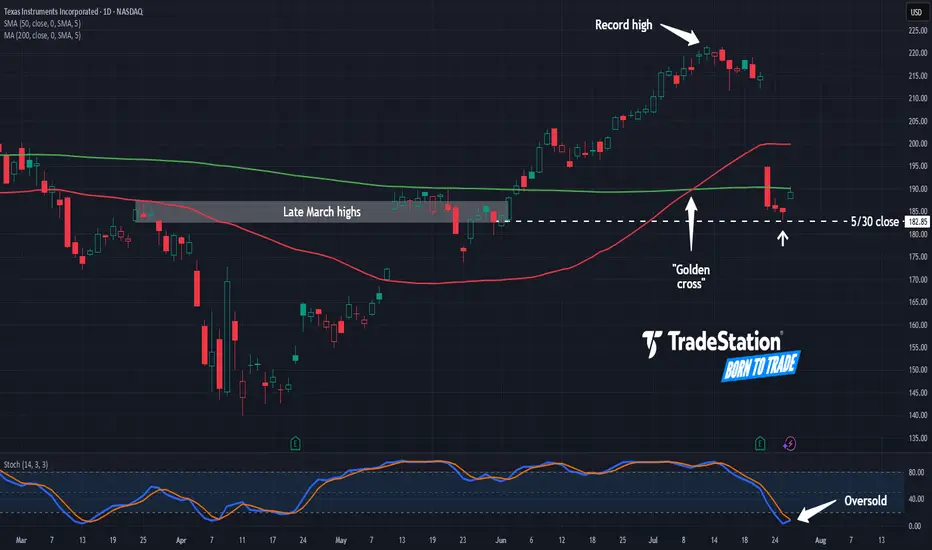
Texas Instruments May Be OversoldTexas Instruments fell sharply last week, and now it may be oversold.
The first pattern on today’s chart is the price zone on either side of $185. It’s near the peaks in late March and a consolidation zone in late May. (The May 30 weekly close is in a similar area.)
TXN held near that level last w
Support zone on TXNTypically these longer term support zones get respected for a retracement. Long here

See all ideas
Summarizing what the indicators are suggesting.
Oscillators
Neutral
SellBuy
Strong sellStrong buy
Strong sellSellNeutralBuyStrong buy
Oscillators
Neutral
SellBuy
Strong sellStrong buy
Strong sellSellNeutralBuyStrong buy
Summary
Neutral
SellBuy
Strong sellStrong buy
Strong sellSellNeutralBuyStrong buy
Summary
Neutral
SellBuy
Strong sellStrong buy
Strong sellSellNeutralBuyStrong buy
Summary
Neutral
SellBuy
Strong sellStrong buy
Strong sellSellNeutralBuyStrong buy
Moving Averages
Neutral
SellBuy
Strong sellStrong buy
Strong sellSellNeutralBuyStrong buy
Moving Averages
Neutral
SellBuy
Strong sellStrong buy
Strong sellSellNeutralBuyStrong buy
Displays a symbol's price movements over previous years to identify recurring trends.
TXN5586961
Texas Instruments Incorporated 5.05% 18-MAY-2063Yield to maturity
5.72%
Maturity date
May 18, 2063
US882508BM5
Texas Instruments Incorporated 2.7% 15-SEP-2051Yield to maturity
5.60%
Maturity date
Sep 15, 2051
TXN5552772
Texas Instruments Incorporated 5.0% 14-MAR-2053Yield to maturity
5.59%
Maturity date
Mar 14, 2053
US882508BD5
Texas Instruments Incorporated 4.15% 15-MAY-2048Yield to maturity
5.58%
Maturity date
May 15, 2048
TXN5748288
Texas Instruments Incorporated 5.15% 08-FEB-2054Yield to maturity
5.56%
Maturity date
Feb 8, 2054
TXN5461342
Texas Instruments Incorporated 4.1% 16-AUG-2052Yield to maturity
5.46%
Maturity date
Aug 16, 2052
US882508BF0
Texas Instruments Incorporated 3.875% 15-MAR-2039Yield to maturity
5.04%
Maturity date
Mar 15, 2039
TXN6082329
Texas Instruments Incorporated 5.1% 23-MAY-2035Yield to maturity
4.69%
Maturity date
May 23, 2035
TXN5748233
Texas Instruments Incorporated 4.85% 08-FEB-2034Yield to maturity
4.47%
Maturity date
Feb 8, 2034
TXN5552752
Texas Instruments Incorporated 4.9% 14-MAR-2033Yield to maturity
4.40%
Maturity date
Mar 14, 2033
TXN5461341
Texas Instruments Incorporated 3.65% 16-AUG-2032Yield to maturity
4.31%
Maturity date
Aug 16, 2032
See all TXND bonds
Curated watchlists where TXND is featured.

