Texas Instruments Incorporated Shs Cert. Deposito Arg. Repr. 0.20 Shs
No trades
Market insights


Texas Instruments (TXN)US is attempting to address the shortage and has called for a massive effort to bolster the domestic chip industry. Bidens proposed $50 billion to build out the chip industry as part of his $2 trillion infrastructure proposal. In doing so, the chip supply chain would be far less complex and able to adjust to market fluctuations much quicker. Currently, the US only produces 12% of worldwide semiconductor manufacturing capacity. Very interesting chart here: www.zerohedge.com
Total profit 2020: 5.595 mil.
Total profit 2021 (est): 6.250 mil.
Total debt: 6.300 mil.


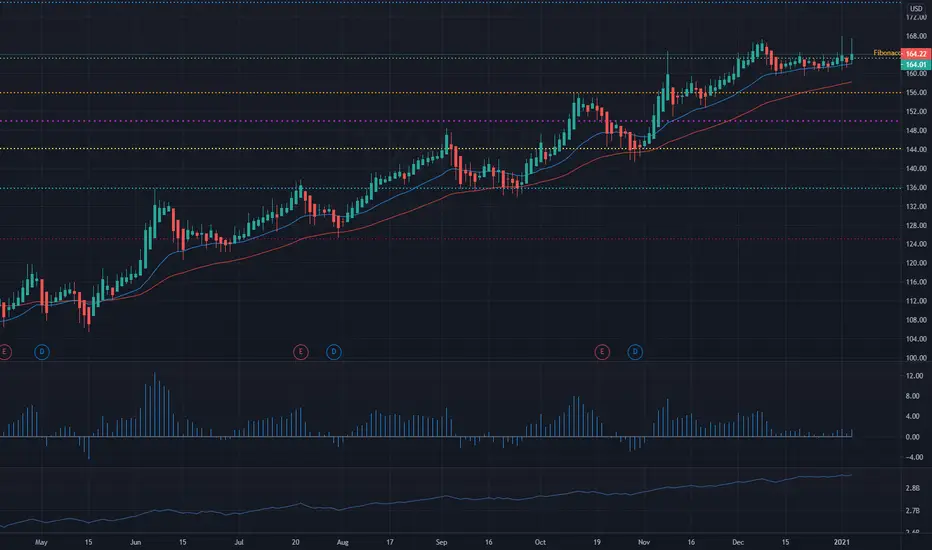
TXN Breaout TradeTXN Looking good. Entered this on the 29th when it looked like it would hold the breakout above highs.
I'd like to see it get up to 200 and then build strength to break through.
Moved stop to 180

A great buy and holdTexas Instruments is a semi conductor manufacturer that appears to have attractive growth prospects within the forecasted high growth semi conductor sector or investment theme.
Stats
The average free cash flow over the last 10 years is 29.9% with an annual dividend yield of 2.27%.
Growth in annual revenue over the last 10 years has been modest.
On average total operating expenses has seen a modest declined since 2006.
As the revenue has grown and operating expenses has declined, the margins at face value has increased. One can see this by the growth in annual gross profit.
What about the debt?
long-term debt to total assets ratio is at 0.34 or 34%. The standard debt to asset ratio is 0.37% which means that most of the debt is long term debt. The effective interest on the total debt is less than 3%. So no real problem or red flags there.
The company is however taking on more debt compared to its historical position. This isn't necessarily a bad thing provided that it is well managed and reinvested into the company. I don't like companies that take on more debt and pay high dividend yields. That's just a personal view.
With regards to the price per share. The company may be trading at a fair value based on traditional metrics and on some metrics such as price to book, it looks expensive. With a 5 year view, i think the company could be in a really good position to continue to grow its revenue particularly if you reinvest the dividends over time.
The trading signals on the weekly chart show mixed results. The Demarker and Stochastic Momentum Indicator suggest that the price may need to consolidate for a while or even retrace before it sees another upward leg. The Stochastic Relative Strength Index shows that the price may increase in the short term, however, this may be suggesting that the price may break through the 185 or 190 mark before retracing to the 160 area. This is all short term guesses.
The question is, should one buy and hold at the current price or wait for a retracement? My feeling is that it shouldn't matter to much if you are looking to hold the company for the next 5 years or more.
Please like and follow for daily posts on various asset classes. Please also share your views on the trading ideas and whether or not you find them to be of any value to you as a trader.
Please note, this idea is shared for educational and discussion purposes only and should not result in speculative investment decisions in any asset class.

TXN 🌦Beautiful patterns, very short bursts, this could be due to high dividend yield. If div yld > 2% I don't buy any options.

TXN (NASDAQ) - Follow TrendGreetings
Humbled, we would like to thanks for your support who has already liked, commented and followed us. Your support, strengthens us, to help in analyzing the market. If you have any questions, feel free to send us message (inbox).
Pra Trading :
- Please care for Money Management
- Have a good psychology
- Do not be hurry to open position and do not do nothing if u see opportunity
- Evaluate and upgrade your trading plan
Execution Strategy :
- Know what you want to buy, see the Fundamental
- Decide that you are on investing or speculating
- Consider what your strategy based on Investing/Speculating
- Make Road Map Of Your Trading Plan
- Decide
a. Entry strategy
b. Cut loss
c. Target of Profit
Post Trading :
a. Do not be sad if you loss or do not be very happy if you win
b. Just become a normal without emotion, Do not put emotion into your trading
c. Evaluate your trading
d. Keep on Learning
e. Be Humble
Idea :
TXN (NASDAQ) - Follow Trend

EMAs SupportTXN is holding up nicely on those EMAS.
If the price holds the longer EMA 350 would be possible entry for me

TXN Long William Alligator : the stock is in a bullish position because the candle sticks are above the Teeth, Lips and Jaw. The lines are “eating with an open mouth” and this show that the stock is in a strong uptrend.
MACD : the line is above the signal line, this is a bullish confirmation. Moreover, the green vertical bars indicate that the price is increasing.
ADX : the line is at 42.52, so the stock is in a strong uptrend.
Candlestick pattern s: there is a bullish engulfing which is a bullish confirmation.
Overall : it can be interesting to take a buy position on this crypto because all the indicators indicate that the price is increasing and will continue like that. Moreover, the stock is in a strong uptrend. Entry price is higher than the current price for assurance and stop loss is set at -5%.

TXN 6 test BreakdownTXN has been in a strong uptrend for the past year. It's 50 sma has been acting as a support zone. It has tested the 50sma now 7 times. With each test lower demand gets taken out. With the market showing strong signs of weakness, i believe that this will crack the upward trend and breakdown to 162 for the near term, and may keep moving lower beyond that.

TXN - Trend FollowingOn the daily chart the ticker bounced off its EMA 50 confirming it as strong support for this well consolidated uptrend

$TXN with a neutral outlook following earnings releaseThe PEAD projected a neutral outlook for $TXN after a negative under reaction following its earnings release placing the stock in drift D
If you would like to see the Drift for another stock please message us. Also click on the Like Button if this was useful and follow us or join us.

Viva la semiconductor*Just an idea, not financial advice*
The chart speaks for itself, this is a friendly trade as dividends are paid.
S1 = Support
R1 = Resitance
Yellow box = Buy zone
White line = Trend line

Possible path for TXNIts been in an uptrend channel for sometime. Will not play this week but will wait to see what happens after earnings.

TXNTXN, and AMD report earnings after close on Tuesday. LRCX reports after close on Wednesday. There is a 9 point move priced in for TXN. If these can report a positive earnings they can help push semi stocks higher. You can play NVDA KLAC, or AMAT, as a sympathy move to avoid paying a high premium.
Lotto Trade Idea: AMAT 108C BID/ASK 1.36/1.45
If you're bearish, AMAT 104P BID/ASK 1.15/1.22 can work.

Texas Instrument: Time to watch & buy: USA By Sun Storm Investment Research
A Profit & Solutions Strategy
Disclaimer: I am not a financial advisor, so please do your own research before trading anything

Long | TXNNASDAQ:TXN
Possible Scenario: LONG
Evidence: Price Action
This is my idea and could be wrong 100%.

Long | TXNNASDAQ:TXN
Possible Scenario: LONG
Evidence: Price Action
This is my idea and could be wrong 100%.
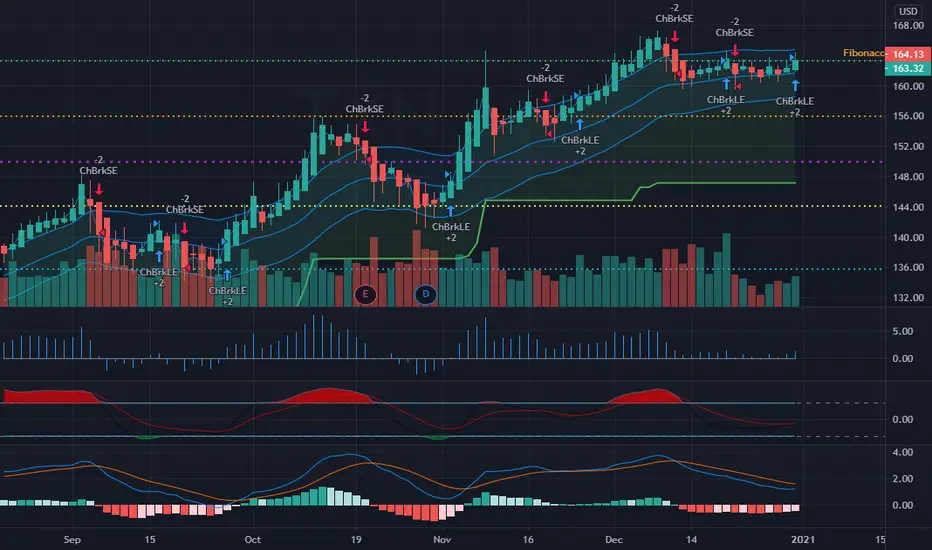
Texas InstrumentsMACD crossover and RSI bullish. Uptrend channel with breakout from support plus above 180 EMA.

TXN consolidating for another run?looks like TXN is following the same trend of run, dip, consolidate, and find new resistance. if this trend continues it should be due for another run to find a new resistance. with a tight stop loss, the risk to reward looks good on this one.
