Texas Instruments Incorporated Shs Cert. Deposito Arg. Repr. 0.20 Shs
No trades
Market insights


TXN Retest/RemountTXN has retested its upper level and old support of $104, it then remounted back to the downside today which is a signal that it will retrace back to breakout lows and possibly to even lower support. That combined with a bearish engulfing candlestick and a pullback off the 13ema signals a very bearish sentiment. I entered at $100 price level before i could post this trade.

Saham syarikat TXNTXN adalah kod bagi syarikat Texas Instruments Inc yang diperbuat dari segi sektor teknologi. Mengikut pemerhatian gelombang sahlun tentang saham ini adalah downtrend@bearish dengan penurunan sebanyak 20.89% dalam tempoh 3 bulan lepas. Dari segi Syariah, saham ini adalah Patuh Syariah


Texas Instruments to All Time Highs
TXN set to rally after nice retrace
Upside target $141
Average price target $135 among analysts | Overweight

TXN - Texas Instruments - Short / Bearish Divergence
Entry: 130.52
Stoploss: 136.32
Target zone 122-118
R/R ratio: 1:1,2 to 1:2
TXN - Texas Instruments
On the weekly I see a rejection on the reistance of 132 $.
We have a bearish divergence on EFI and MACD-H, and the impulse is yellow as well.
RSI is still rising and %D and %K are widening, which is a bit worrysome.
On the daily, we see there is a rejection candle and with that a bearish divergence is drawn on MACD-H, not on EFI though.
It would be good to enter now, althought the market open could give us a better price, or new insights on this ticker.
So I’m carefully monitoring the market on monday, before entering this short.
The target is set on the weekly, and consist of a move of 2 ATR levels. Considering the history, the -1 ATR level is mostly crossed on divergences and strong pullbacks, so this sounds reasonable.
I will evaluate the market on monday en update accordingly. This could be an interesting trade.
Will update here later.


$TXN Texas Instruments into earnings ?Seemingly every stock in this sector has spiked on earnings, but on this occasion we will sit on the sidelines.
The volume has declined consistently.
The RSi is in bearish divergence to price action .
Stock is currently at upper trend-line resistance.
Possible rising wedge forming which is not a bullish structure to trade.

Texas Instruments breakout trade Entry level $133.50 = Target price $143.67 = Stop loss $130.65
Levels of Interest = $132.46
P/E ratio = 24.
Average Recommendation: Overweight Average Target Price:$129.31
12 BUY
01 OVERWEIGHT
18 HOLD
1 SELL
Company profile
Texas Instruments Incorporated engages in the design and manufacture semiconductor solutions for analog and digital embedded and application processing. It operates through the following two segments: Analog & Embedded Processing. The Analog segment semiconductors change real-world signals such as sound, temperature, pressure or images, by conditioning them, amplifying them and often converting them to a stream of digital data that can be processed by other semiconductors, such as embedded processors. The Embedded Processing segment designed to handle specific tasks and can be optimized for various combinations of performance, power and cost, depending on the application. The company was founded by Cecil H. Green, Patrick Eugene Haggerty, John Erik Jonsson and Eugene McDermott in 1930and is headquartered in Dallas, TX.
PLEASE GIVE US A LIKE IF YOU FIND OUR CONTENT HELPFUL, IT IS REALLY APPRECIATED

TXN Bearish EngulfingBearish Engulfing, Bearish Divergence & at resistance level
1 Trade Pullback to 0.382 Fib / Trendline and resume uptrend? or break through?, Place stop above high of candle.
2 Trade Break through trendline and pullback to support / 0.786 Fib, we can expect rebound and test of trendline, if stock sentiment has turned bearish it will probably miss short of retracing all the way back to trendline. Place stop above candle which breaks the trendline.
Earnings 22 Jan After Market Close

Pinbar SetupPinbar off of 20 ma. Also hits 23.6% Fibonacci level. Seems to have a history of respecting pinbars too. I am waiting for price action and setting my entry a little above the previous day's high. NASDAQ:TXN


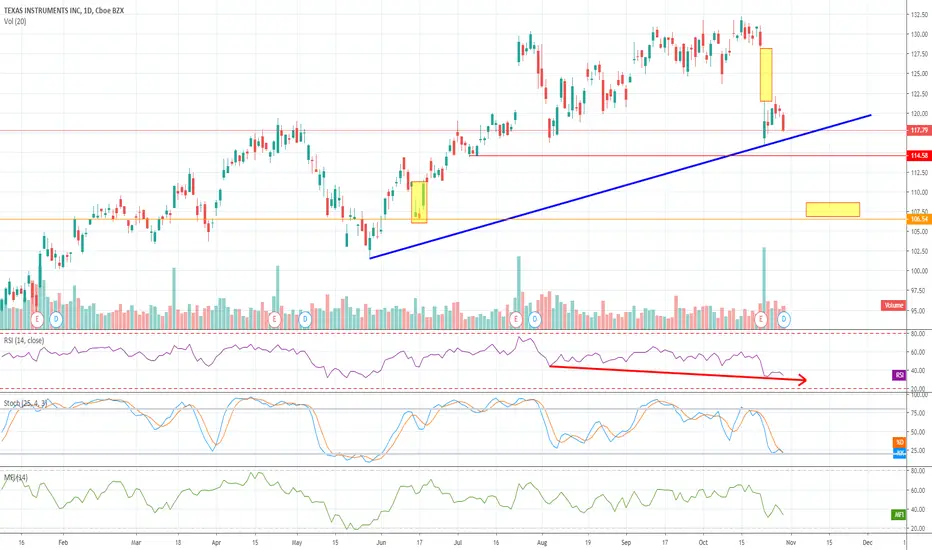
$TXN SHORT IF BREAK DOWN 114.8 TARGETING 106 SL 121 NOW 117.79Possible bearish pattern if break down blue line and close below main support at 114.8 where all this upmove starts . possible targeting point of 106 where investors confirm bull run . stoploss for this idea to close above 121

No clear direction. Wait for next confirmationOn daily chart, the price already hit SMA200, plus it also testing a strong support yesterday.
On weekly chart, it has broken the trend line.
However, there's still no clear direction.. It may got up or may go down.. Too risky to enter trade at the moment.
Wait and see next confirmation either bullish or bearish.

$TXN Broken Trend Bearish trend targeting 114 and 112 SHORTRSI keep weakening with all other indicators suggested further decline to 114 support then to 112 1.62 fibo then we can see bounce to fill up previous earning gap but not soon


TXN is holding support after the gap and looks poised to bounceNASDAQ:TXN gapped down and fell on earnings day with high volume, but the stock immediately stabilized and found support. Notice how broken resistance and the August low mark a clear support zone. The long-term trend is still up and there are also two bounces off the 116 area in late October. Semiconductors are strong overall and I expect TXN to continue higher.

Buy and sell opportunityBuy and sell opportunity: wait for a bullish and bearish reversal in buy and sell zones respectively.
Trend analysis:
Monthly - up
Weekly - down (correction)
Daily - down (correction)
Hourly - down
Long-term opportunity: buy
Short-term opportunity: sell
