Uber: Pulling BackUber has recently pushed higher toward resistance at $101.99 before pulling back noticeably from that level. This move aligns perfectly with our primary scenario, as we continue to expect a broader sell-off into the turquoise Target Zone between $68.29 and $59.15 as part of turquoise wave 4. Within this zone, we anticipate price will reverse and resume its broader upward trend, eventually breaking through the $101.99 resistance. However, if Uber reverses course soon and breaks above the $101.99 mark without setting new lows, we would then expect a new high for turquoise wave alt.3 . We currently assign a 35% probability to such a delay in the ongoing upward impulse.
Trade ideas

UBER Stock Analysis: Trading Range and Earnings ReactionEarnings Report and Market Reaction
On November 4th, Uber ( NYSE:UBER ) reported its latest earnings, surpassing expectations by an impressive 338%. The company’s earnings growth reached 159%, and revenue increased by 20.4%. Despite these strong financial results, the stock price closed lower compared to the previous day. This outcome highlights the often unpredictable nature of the market, where investor reactions to news can differ significantly from initial expectations. In this case, it appears that investors were anticipating even higher numbers.
Establishing a Trading Range
Since late September, Uber’s stock has been trading within a defined range. Recognizing this pattern, I initiated a position on November 4th at $93.33 per share and set a stop order just below that day’s low. To date, the stop has not been triggered, and I continue to hold the stock. My analysis of the stock’s behavior today confirmed the existence of this trading range.
Position Management and Risk Assessment
Based on my observations, I decided to add to my position in anticipation of the price moving toward the top of the established range. There is also the potential for a breakout, which could lead to new highs. For now, I am maintaining my original stop just below $90 per share, establishing a risk of 3.8%. This risk-reward profile is favorable, as I am targeting an upside move of approximately 8%.
Important Considerations for Investors
Readers are strongly encouraged to analyze this trading idea independently and consistently apply their own trading rules. It is crucial to remember that all investments carry risk, and making informed decisions with your own capital is essential.

$UBER Holds Key Support as Q3 Profit Smashes ExpectationsUber Technologies, Inc. (NYSE: NYSE:UBER ) posted a strong third-quarter earnings report last week, but investor reaction was muted as shares slipped 4.5% to $92.12. Despite the short-term dip, the company’s fundamentals remain robust, and the technical chart suggests a potential rebound ahead.
For the quarter, Uber reported revenues of $13 billion, in line with analyst estimates. However, the standout metric was profitability. The ride-hailing and delivery giant surprised markets with statutory earnings of $3.11 per share, blowing past consensus forecasts by more than 350%. This marks a major milestone in Uber’s transformation from a cash-burning startup into a consistently profitable platform business.
Analysts view the latest results as a sign of improved efficiency and stronger margins across both the Mobility and Delivery segments. Revenue per trip rose modestly, while cost discipline and higher utilization helped drive record profits. Looking ahead, Wall Street forecasts continued earnings momentum through 2026, supported by demand growth and operational leverage.
Technically, the stock remains above its multi-year ascending trendline, with strong support near the $85–$88 range. The price action shows a healthy consolidation following a breakout above the $80 resistance zone, with buyers likely to defend the trendline if tested. A rebound from current levels could push NYSE:UBER back toward the $100–$102 resistance area, which aligns with the prior high.
Momentum indicators like RSI also suggest the stock is entering a potential accumulation zone, signaling room for upside continuation once sentiment stabilizes. Overall, Uber’s fundamentals appear solid, and the long-term trend remains bullish despite short-term volatility.

$UBER running out of gas! - NYSE:UBER is valuation doesn't provide meaningful upside.
- NYSE:UBER is buying back shares which is providing floor to the stock price. These amount should have been better utilized in finding growth opportunity.
- EPS is declining in 2026.
- NYSE:UBER is hard pass at 90s as it doesn't offer meaningful upside and base case suggests it will be around $95-100 in 2028
- Therefore, avoiding NYSE:UBER is the best decision.

UBER AFTER EARNINGSUBER 4H
Price rejected near 102 (distribution). Absorption holds at 90.
Watching gaps at 95–100 and 85.
Targets
Upside: 95–100, then 102.
Downside: 90 → 85; below 85 ends the distribution and opens a slide to the 50s.
#UBER #globaltrade #investment #investing #stockmarket #wealth #realestate #markets #economy #finance #money #forex #trading #price #business #currency #blockchain #crypto #cryptocurrency #airdrop #btc #ethereum #ico #altcoin #cryptonews #Bitcoin #ipo

Uber Stock Faces Indecision After Earnings ReportDuring the last trading session, Uber’s stock fell more than 5.5%, as volatility increased following the release of the company’s quarterly earnings report.
Although revenue came in at $13.47 billion, slightly above expectations of $13.28 billion, and earnings per share (EPS) reached $3.11, the stock experienced strong selling pressure. This decline was mainly driven by the company’s announcement that rising costs and shrinking profit margins remain a concern — a trend that could persist in future reports. This outlook has fueled investor uncertainty, leaving the stock in a state of indecision.
Sideways Movement Gains Relevance
In recent weeks, Uber’s share price has formed a consistent sideways range, following the break of an upward trendline that had been in place for several months. The upper boundary of the channel remains near $100, while the lower boundary sits around $91.
Although recent selling activity has been dominant, it has not been strong enough to break the range, making this lateral structure the most relevant technical formation to monitor. As long as the price remains within this channel, market indecision is likely to persist over the coming sessions.
RSI
The RSI line hovers around the 50 level, reflecting neutral momentum between bullish and bearish forces, with no clear directional bias over the past 14 sessions. If the RSI continues to fluctuate near this zone, indecision may continue to reinforce the sideways pattern in the coming weeks.
MACD
The MACD histogram remains close to the zero line, indicating a lack of directional strength in short-term moving averages. This behavior aligns with the dominance of the current sideways channel, suggesting that the market could continue trading without a clear trend in the near term.
Key Levels to Watch:
$100 – Main Resistance:
Marks the top of the sideways range and serves as the most important psychological level. A sustained move above this zone could reactivate the previous bullish trend, which has been inactive for several weeks.
$95 – Intermediate Barrier:
Aligns with the 50-period simple moving average (SMA). If the price consolidates near this level, it could extend the sideways range in the coming sessions.
$91 – Main Support:
Represents the bottom of the lateral channel and aligns with the 23.6% Fibonacci retracement level. A break below this zone could trigger a new bearish trend in the short to medium term.
Written by Julian Pineda, CFA – Market Analyst

UBER QuantSignals V3 Earnings 2025-11-03UBER QuantSignals V3 Earnings 2025-11-03
UBER Earnings Signal | 2025-11-03
• Direction: BUY CALLS | Confidence: 60%
• Entry Plan: Open | Expiry 2025-11-07
• Strike Focus: $100.00
• Entry Range: $3.04
• Target 1: $4.53
• Stop Loss: $1.81
• Implied Move: $6.65 (6.7%)
• 24h Move: +2.07%
• Flow Intel: Neutral | PCR 0.76
• ⚠️ MODERATE RISK WARNING: Consider reducing position size due to moderate confidence level.
• Earnings Date: 2025-11-04 | Estimate: $0.70
⚖️ Compliance: Educational earnings analysis for QS Premium members only. Not financial advice.
🎯 TRADE RECOMMENDATION
Direction: BUY CALLS
Confidence: 60%
Conviction Level: MEDIUM
🧠 ANALYSIS SUMMARY
Katy AI Signal: NEUTRAL (50% confidence) with $98.16 target and $100.81 stop loss - Katy shows slight bearish bias but low conviction
Technical Analysis: Mixed signals - RSI at 66.7 (neutral), MACD negative (-0.1477) but momentum strong (+6.19% ROC), EMA alignment bullish, pre-earnings momentum +2.07%
News Sentiment: Bullish catalysts - Uber partnering with Toast to drive restaurant demand, positive earnings preview coverage, strong revenue growth narrative (13540%)
Options Flow: Neutral bias (PCR 0.76) with unusual volume at $113 calls indicating institutional bullish speculation for big move
Risk Level: MEDIUM - Low volume (0.2x average) reduces conviction, Katy's neutral signal conflicts with bullish fundamentals
💰 TRADE SETUP
Expiry Date: 2025-11-07 (4 days)
Recommended Strike: $100.00
Entry Price: $3.02 - $3.05
Target 1: $4.53 (50% gain from entry)
Target 2: $6.04 (100% gain from entry)
Stop Loss: $1.81 (40% loss from entry)
Position Size: 2% of portfolio
⚡ COMPETITIVE EDGE
Why This Trade: Superior risk/reward setup despite Katy's neutral signal - strong revenue growth narrative + strategic partnerships provide fundamental support
Timing Advantage: Earnings catalyst with implied 6.7% move p
Image
QS Analyst
APP
— 10:46 AM
rovides explosive potential, partnership news fresh (last 24 hours)
Risk Mitigation: Balanced delta (0.484) provides good probability, stop loss protects against Katy's bearish target scenario
🚨 IMPORTANT NOTES
CONFLICT ALERT: Katy AI shows NEUTRAL bias while fundamentals suggest bullish - trade with caution
Low volume (0.2x average) indicates weak pre-earnings conviction
VIX rising to 17.44 suggests increasing market volatility
Position size reduced to 2% due to conflicting signals between Katy and fundamental analysis
Note: This trade recommendation follows Katy's primary directional guidance of BUY CALLS despite Katy's own neutral prediction, as per framework requirements.
📊 TRADE DETAILS 📊
🎯 Instrument: UBER
🔀 Direction: CALL (LONG)
🎯 Strike: 100.00
💵 Entry Price: 3.04
🎯 Profit Target: 4.53
🛑 Stop Loss: 1.81
📅 Expiry: 2025-11-07
📏 Size: 2.0
📈 Confidence: 60%
⏰ Entry Timing: N/A
🕒 Signal Time: 2025-11-03 13:46:48 EST
⚠️ MODERATE RISK WARNING: Consider reducing position size due to moderate confidence level.

Will $UBER earnings push price beyond $100?#UBER has led a charmed life this year riding the coattails of the tech love-in. We have earnings tomorrow before the open, which are expected to be good numbers.
Price has been butting heads against the BRN of $100, whilst finding support from the weekly 20 Period Moving Average. Has this helped create a scrappy ascending triangle that is waiting to explode higher?
Will #UBERs earnings be that catalyst?

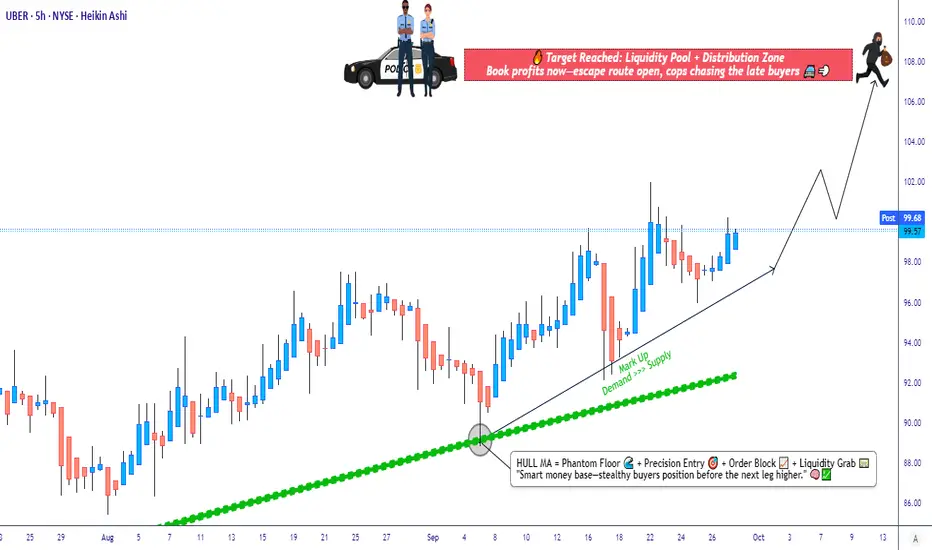
Uber Market Outlook – Swing Trade Opportunity on the Horizon🚖 UBER TECHNOLOGIES, INC — Market Wealth Strategy Map (Swing/Day Trade)
👋 Dear Ladies & Gentlemen (Thief OG’s), welcome to today’s Wealth Strategy Map on $UBER!
🔑 Game Plan (Thief Style)
Trend Bias → Bullish plan confirmed via Hull Moving Average pullback 📈
Entry (Layered Buy Strategy) → Using the Thief’s layering style (multiple buy-limit orders):
$96.00
$97.00
$98.00
$99.00
(You can add more layers if you want — it’s flexible by design) 🧩
Stop-Loss (SL) → $92.00 (📉 “Thief SL Zone”)
⚠️ Note: I’m not recommending you stick only to my SL — adjust based on your risk appetite.
Target (TP) → $108.00 (🚔 Police barricade zone = resistance + overbought trap!)
⚠️ Again, profit-taking is your choice — manage your exits wisely.
📊 Key Notes & Style
Hull MA pullback = Trend confirmation 🔒
Layering Strategy (Thief Style) = Scaling in with multiple limit orders instead of one big bite 🍕
Resistance @108.00 = Our “Escape Point” 🚁
Risk Management = Personal responsibility — don’t blindly copy!
🔗 Related Assets / Correlations
NASDAQ:LYFT (ridesharing peer) 🚗
NASDAQ:TSLA (EV demand + mobility trends) ⚡
NASDAQ:QQQ (tech-heavy index correlation) 📊
AMEX:SPY (broad market driver) 🌍
Watching these helps confirm broader tech + mobility sector sentiment.
✨ “If you find value in my analysis, a 👍 and 🚀 boost is much appreciated — it helps me share more setups with the community!”
⚠️ Disclaimer: This is a Thief Style Strategy shared for fun & educational purposes. Not financial advice. Trade at your own risk.
#UBER #StockMarket #SwingTrade #DayTrade #HullMovingAverage #ThiefStrategy #LayeringEntries #StockAnalysis #TradingCommunity
$UBER | 15-min Outlook📊 Price: $94.61 | Bias: Bullish
🧠 Reclaiming mid-channel — eyes on breakout above $96.
If momentum holds, structure points to $124.78 🚀
⚙️ Plan:
Entry: $94
Stop: $88.6
TP1: $96.2
TP2: $124.8
VolanX DSS: Institutional BUY (65%) 🟢
Short-term pullback risk → Long-term structure intact.
#UBER #VolanX #WaverVanir #AITrading #SmartMoneyConcepts #LiquidityZones #Breakout

UBERAttractive P/E, popular stock, increasing revenue, well known brand - Looks like a solid medium term stock (12 months). Looking to buy calls / stock below $97.
Education purpose only, not a trade recommendation.

My view on UBERFrom the current structure, if the price broke below the trendline that has been supporting the recent move, I think Uber will likely head down to retest the highlighted support zone.
That move would also align with a potential test of the 200-day SMMA, creating a strong confluence level.
🎯 Conclusion: My bias turns bearish if the price breaks the trendline — in that case, I expect Uber to move into support while testing the 200 SMMA. Still, markets are unpredictable, and this remains only my view.
👉 For more structured market insights and professional analysis, follow along.

Uber Technologies, Inc. (UBER) Thrives on Uber Eats GrowthUber Technologies, Inc. (UBER) is a global mobility and delivery platform best known for revolutionizing ride-hailing while expanding into food delivery through Uber Eats and freight logistics with Uber Freight. The company’s growth is fueled by rising demand for on-demand transportation, strong adoption of delivery services, and ongoing innovation in autonomous vehicles, electric mobility, and global logistics solutions.
On the chart, a confirmation bar with rising volume highlights bullish sentiment. The price has entered the momentum zone after moving above the .236 Fibonacci level. A trailing stop can be placed just below this Fibonacci line using the Fibonacci snap tool, helping traders secure profits while leaving room for continued upside potential.

UBER HIGH PROBABILITY SETUP SOON!!!🚨 UBER HIGH PROBABILITY SELL SETUP 🚨
* Here We Can See Clearly The Next Potential Move For UBER Coming Hours/Days.
* Keep Your Eyes Close On Your Trading Positions.
* Happy PIP Hunting Traders.
FXKILLA.
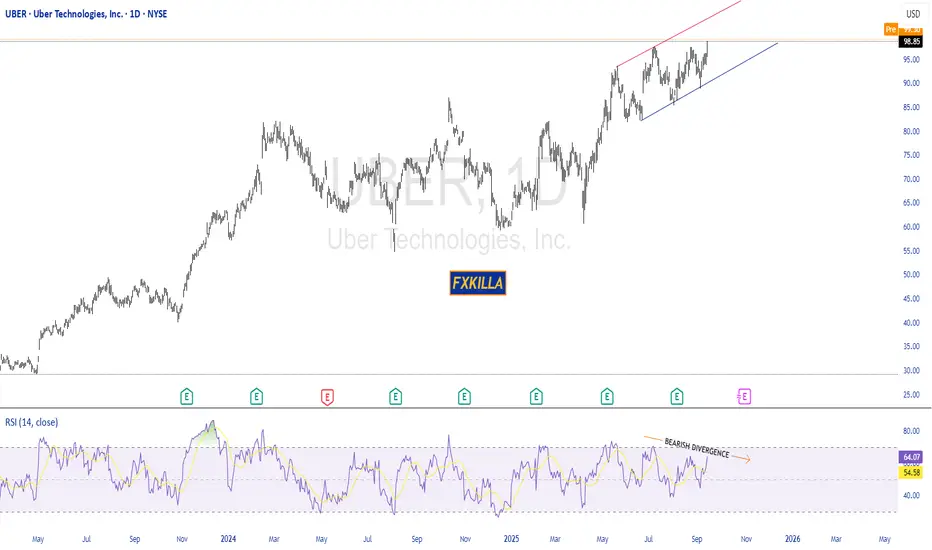
Levels to trade the $UBER discovery phaseThis chart is a textbook example of a stock in Phase D, preparing for a transition to Phase E (Markup).
Accumulation/Cause : A trading range (the "cause") has been built between roughly $88 and $99.
Sign of Strength (SOS) : The push up to the top of the range in late August was a Sign of Strength.
Back Up / Last Point of Support (LPS) : The pullback in early September to the moving average (~$93) on lower volume was a successful test, or a "Back Up" action. Supply was clearly limited on that dip.
Confirmation : Now, the price is rallying again.

Uber Tech - Upside rally to come NYSE:UBER major uptrend remained intact and is likely to go higher after a strong bullish break above the upper resistance turned support of the ascending triangle. Momentum have regained bullish strength and is likely to go higher towards 111.67 as 100.00 psychological level is easily to be broken.

$UBER Technical Analysis: Bullish Momentum ObservedOverview
NYSE:UBER appears to be demonstrating significant bullish activity, as evidenced by a strong follow-through day. The price action is currently breaking above what seems to be a Bull Flag pattern, which is typically considered a continuation signal in technical analysis.
Technical Indicators
• Price is trading above all major moving averages, which supports the bullish outlook.
• NYSE:UBER is also above the All Time High AVWAP (Anchored Volume Weighted Average Price), indicating strong momentum.
Alternative Patterns
While the primary observation is a breakout from a Bull Flag, there is also a possibility that the current rally could be developing from a double top formation. However, confirmation of this pattern would only be possible after further price action is observed.
Positioning and Risk Management
Given the bullish chart setup, a half-size position has been initiated. The stop-loss is set to trigger on a close below the 50-day moving average (red), providing a disciplined approach to risk management.
Trading Reminder
As always, if this idea resonates with you, consider adapting it to your own trading plan. Remember, trading decisions should be guided by your personal strategy and risk tolerance, as your money is at stake.

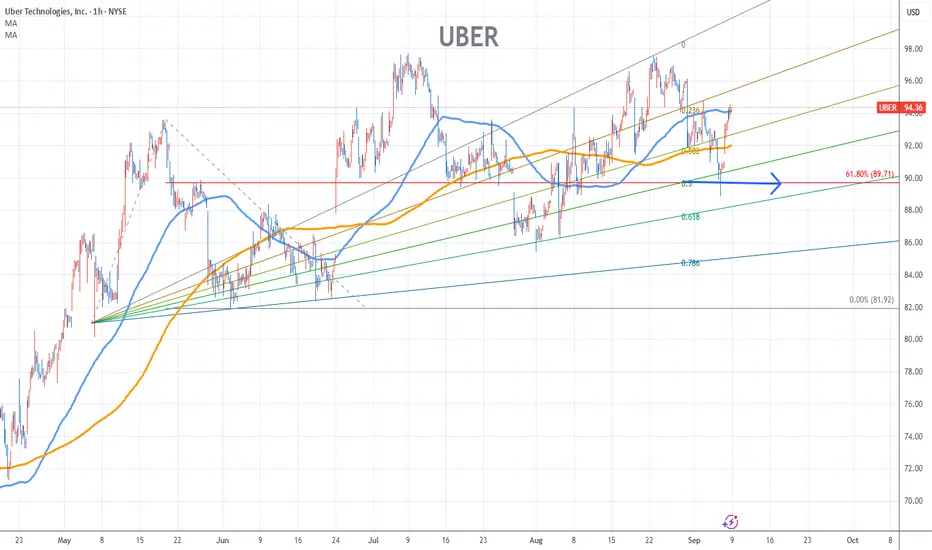
Uber Stock Chart Fibonacci Analysis 090825Trading Idea
1) Find a FIBO slingshot
2) Check FIBO 61.80% level
3) Entry Point > 90/61.80%
Chart time frame:C
A) 15 min(1W-3M)
B) 1 hr(3M-6M)
C) 4 hr(6M-1year)
D) 1 day(1-3years)
Stock progress:A
A) Keep rising over 61.80% resistance
B) 61.80% resistance
C) 61.80% support
D) Hit the bottom
E) Hit the top
Stocks rise as they rise from support and fall from resistance. Our goal is to find a low support point and enter. It can be referred to as buying at the pullback point. The pullback point can be found with a Fibonacci extension of 61.80%. This is a step to find an entry-level position. 1) Find a triangle (Fibonacci Speed Fan Line) that connects the high (resistance) and low (support) points of the stock in progress, where it is continuously expressed as a Slingshot, 2) and create a Fibonacci extension level for the first rising wave from the start point of the slingshot pattern.
When the current price goes over the 61.80% level, that can be a good entry point, especially if the SMA 100 and 200 curves are gathered together at 61.80%, it is a very good entry point.
As a great help, TradingView provides these Fibonacci speed fan lines and extension levels with ease. So if you use the Fibonacci fan line, the extension level, and the SMA 100/200 curve well, you can find an entry point for the stock market. At least you have to enter at this low point to avoid trading failure, and if you are skilled at entering this low point, with the fibonacci6180 technique, your reading skill of to chart will be greatly improved.
If you want to do day trading, please set the time frame to 5 minutes or 15 minutes, and you will see many of the low points of rising stocks.
If you prefer long-term range trading, you can set the time frame to 1 hr or 1 day

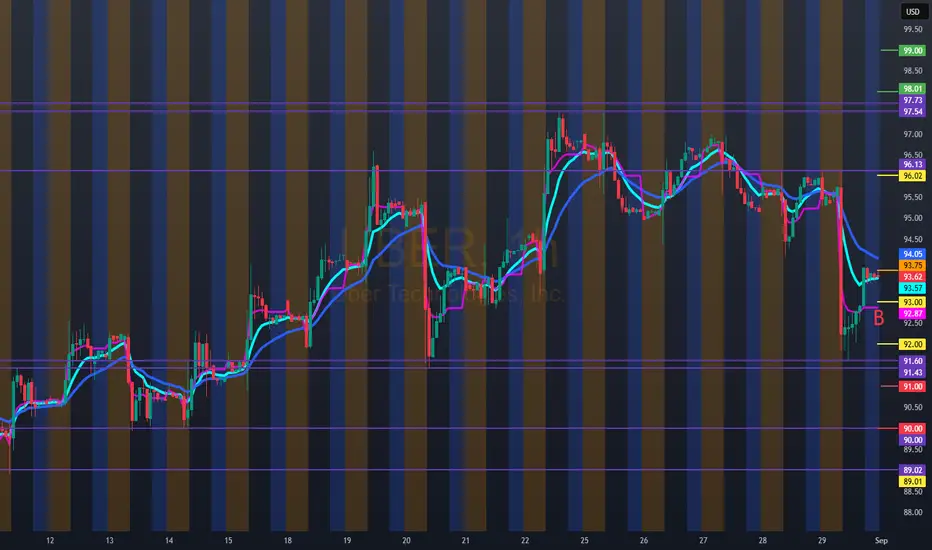
Hello Trader, UBER 93.75 for tomorrow, 9/2/25Bullish entry above 93.00/ possible profit-taking at 96.00, possible up to 97.00, as this area would form a triple top. For another future bullish entry, we must wait for the triple top to break at 97.00 and take a new bullish entry at 98.00.
For the bearish entry: possible rebound zone in the 92.00 area. If this price is lost, it would give bearish continuity to 91.00/90.00 with volume confirmation, as this price has found support in previous days.
Bearish on UberUber seems to be starting a wave C of a flat correction. Hence a short term sell can be explored for this ticker.

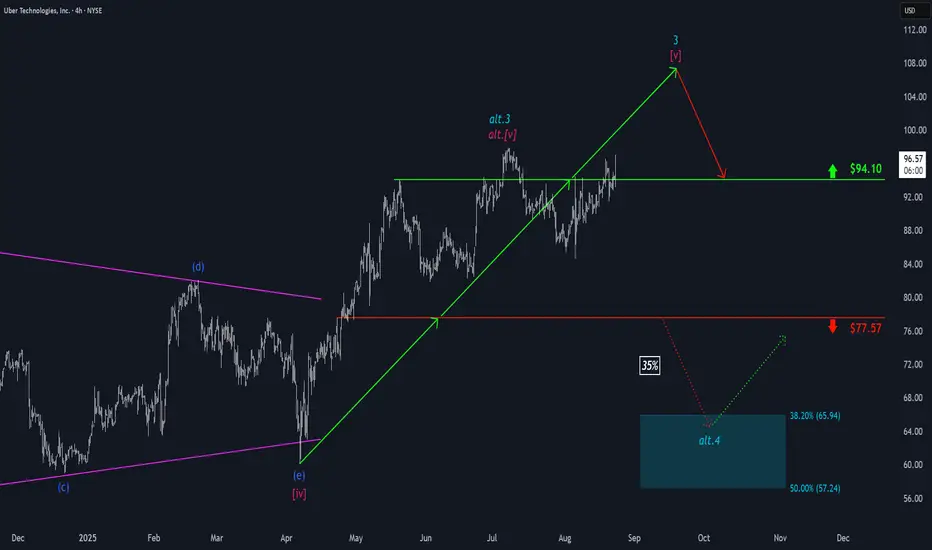
Uber: Another Run at $94.10 ResistanceUber has made another attempt to break through resistance at $94.10 – a move that was briefly successful – but persistent downward pressure prevented a sustained breakout. We still expect the stock to move decisively above the $94.10 level to establish the high of turquoise wave 3; only afterward do we anticipate a more significant pullback. However, there remains a 35% probability that Uber has already completed turquoise wave alt.3 with its highest peak above $94.10 so far, and could next decline into our turquoise alternative Target Zone between $65.94 and $57.24 during wave alt.4 .
UBER to ATHGap filled almost
There is "Hidden Bullish Divergence"
Volume reduced but price not. Time to pump with huge volume bar.
