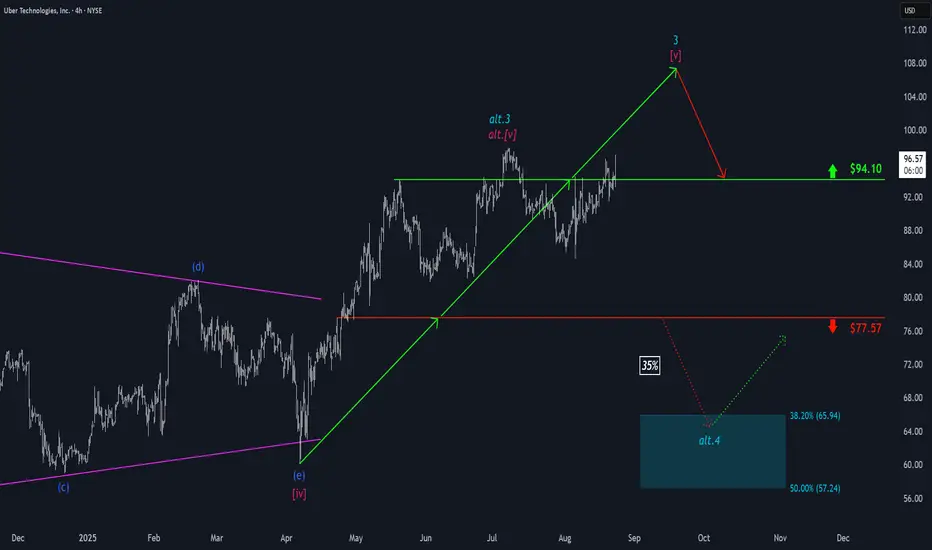
Uber: Another Run at $94.10 ResistanceUber has made another attempt to break through resistance at $94.10 – a move that was briefly successful – but persistent downward pressure prevented a sustained breakout. We still expect the stock to move decisively above the $94.10 level to establish the high of turquoise wave 3; only afterward do we anticipate a more significant pullback. However, there remains a 35% probability that Uber has already completed turquoise wave alt.3 with its highest peak above $94.10 so far, and could next decline into our turquoise alternative Target Zone between $65.94 and $57.24 during wave alt.4 .
UBERC trade ideas
Bearish on UberUber seems to be starting a wave C of a flat correction. Hence a short term sell can be explored for this ticker.

Breaking: Uber’s Growth Momentum Positions $96.79 as Crucial Ent
Current Price: $96.79
Direction: LONG
Targets:
- T1 = $101.50
- T2 = $106.00
Stop Levels:
- S1 = $94.50
- S2 = $92.00
**Wisdom of Professional Traders:**
This analysis synthesizes insights from thousands of professional traders and market experts, leveraging collective intelligence to identify high-probability trade setups. The wisdom of crowds principle underscores that Uber’s stock possesses the significant characteristics of an asset poised for growth, underwritten by both operational expansions and market sentiment. Experienced traders are closely monitoring technical levels and sector rotations as additional signals for a breakout above resistance levels.
**Key Insights:**
Uber operates in a dynamic industry, benefiting from ongoing growth in global mobility demand, ride-hailing services, and food delivery operations. Analysts have noted Uber's successful strategy in diversifying its revenue streams, including its rapidly expanding efforts in logistics and specialized verticals. The company’s emphasis on operational efficiency in recent quarters has supported consistent margin improvements, which could further bolster investor confidence in the stock.
The current price of $96.79 represents a narrow consolidation range after a sustained upward trajectory. A key factor driving bullish sentiment is market-wide interest in high-growth technology platforms benefiting from structural changes in consumer reliance on app-based services. Technical indicators such as a bullish MACD crossover and elevated RSI suggest the asset remains in accumulation mode, with upside potential to test new highs.
**Recent Performance:**
Uber’s stock has displayed solid resilience despite broader market volatility in the technology and consumer markets. Over the last month, Uber posted a modest gain, driven by strong earnings results and improved guidance for future quarters. It has consistently performed above its 50-day moving average, indicating strong trend support. Additionally, volume trends suggest accumulating institutional interest, potentially reinforcing the case for a breakout.
**Expert Analysis:**
Technical analysis highlights that Uber appears to be consolidating sharply at its current price level, marking it as a pivotal juncture. With moving averages aligning to create a bullish crossover, many technical traders consider this an optimal time to take a long position. Professional traders are closely eyeing upper resistance zones near $101-$106, with momentum and earnings-derived upgrades expected to push through these obstacles.
Expert opinions also emphasize the long-term growth story of Uber, benefitting from secular tailwinds around mobility and food delivery trends. The company’s recent strategic partnerships and technology investments position it well for capturing additional market share globally, solidifying its attractive valuation relative to sector peers.
**News Impact:**
Uber’s recent quarterly earnings report highlighted stronger-than-expected growth in gross bookings. Management’s bullish commentary included expectations for sustained growth from cross-platform synergies in ride-hailing and food delivery services. Recent positive news around expansion into emerging markets further reinforces bullish sentiment. Additionally, developments in autonomous vehicle technologies and aggregate industry shifts toward efficiency support Uber’s outlook as a robust player under the mobility platform umbrella.
**Trading Recommendation:**
Based on institutional interest, positive technical signals, and strong company-specific fundamentals, a long position on Uber at the current price of $96.79 presents an attractive opportunity. Price targets of $101.50 and $106.00 highlight meaningful upside potential, while the stop levels at $94.50 and $92.00 safeguard risk for prudent traders. Aligning with expert opinions, this direction offers a well-balanced mix of speculative growth and reliable trend confirmation.
Do you want to save hours every week? Register for the free weekly update in your language!

UBER to ATHGap filled almost
There is "Hidden Bullish Divergence"
Volume reduced but price not. Time to pump with huge volume bar.

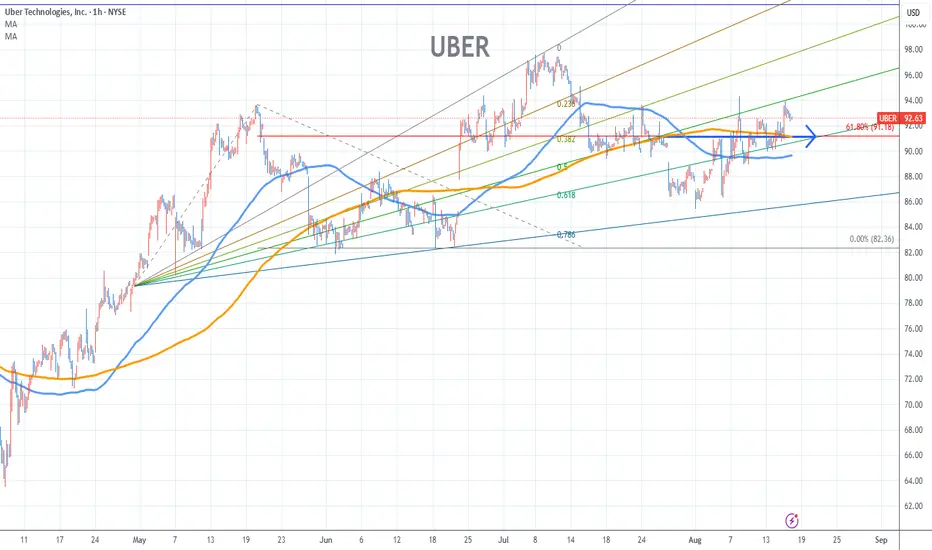
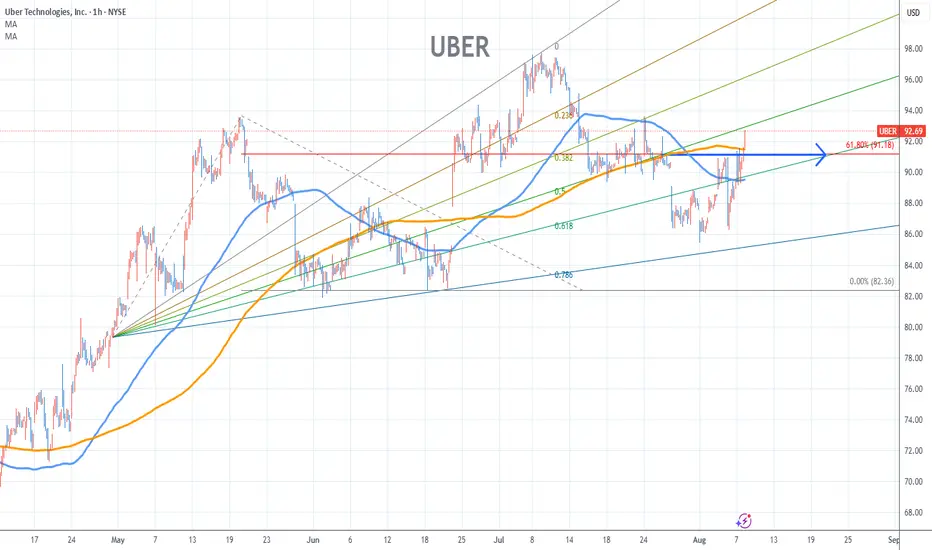
Uber Stock Chart Fibonacci Analysis 081525Trading Idea
1) Find a FIBO slingshot
2) Check FIBO 61.80% level
3) Entry Point > 91/61.80%
Chart time frame:B
A) 15 min(1W-3M)
B) 1 hr(3M-6M)
C) 4 hr(6M-1year)
D) 1 day(1-3years)
Stock progress:A
A) Keep rising over 61.80% resistance
B) 61.80% resistance
C) 61.80% support
D) Hit the bottom
E) Hit the top
Stocks rise as they rise from support and fall from resistance. Our goal is to find a low support point and enter. It can be referred to as buying at the pullback point. The pullback point can be found with a Fibonacci extension of 61.80%. This is a step to find entry level. 1) Find a triangle (Fibonacci Speed Fan Line) that connects the high (resistance) and low (support) points of the stock in progress, where it is continuously expressed as a Slingshot, 2) and create a Fibonacci extension level for the first rising wave from the start point of slingshot pattern.
When the current price goes over 61.80% level , that can be a good entry point, especially if the SMA 100 and 200 curves are gathered together at 61.80%, it is a very good entry point.
As a great help, tradingview provides these Fibonacci speed fan lines and extension levels with ease. So if you use the Fibonacci fan line, the extension level, and the SMA 100/200 curve well, you can find an entry point for the stock market. At least you have to enter at this low point to avoid trading failure, and if you are skilled at entering this low point, with fibonacci6180 technique, your reading skill to chart will be greatly improved.
If you want to do day trading, please set the time frame to 5 minutes or 15 minutes, and you will see many of the low point of rising stocks.
If you want to prefer long term range trading, you can set the time frame to 1 hr or 1 day
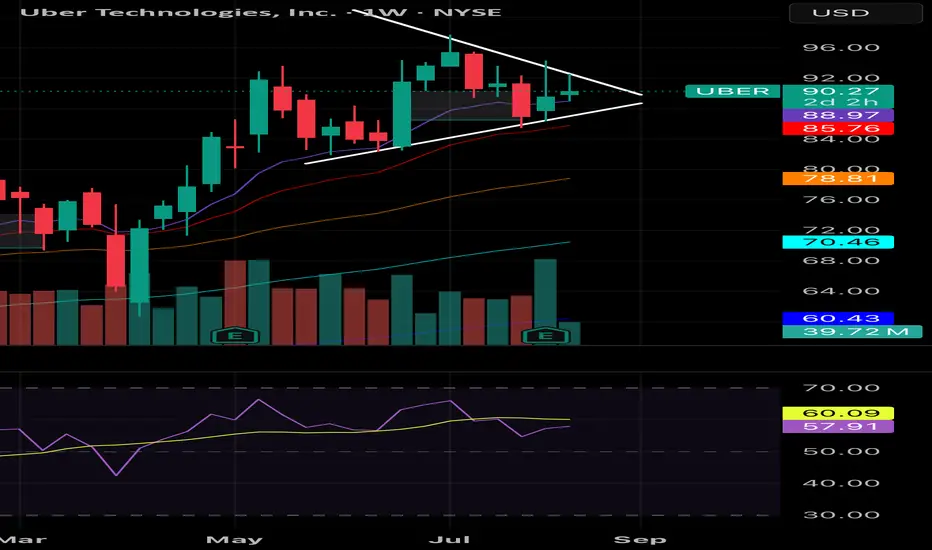
Uber Technologies, Inc. (NYSE: UBER)⚠️ Disclaimer : This chart is for educational purposes only.
Uber Technologies, Inc. - (W),
Price action: the stock is in a medium-term uptrend after a multi-month base — current weekly close $92.60 (+3.39%).
Structure : it has broken above the prior consolidation zone (roughly $82–85) and is now trading just under a near-term resistance band around $93–101.
Key levels : support near $82–85 (short stop area) and a stronger floor around $60; upside targets marked on the chart at about $109, $117, $125.
Volume : recent weekly volume (~76M) is below the plotted volume average (~98M), so momentum accompanying the latest push looks muted compared with earlier spikes.
Technically bullish while above the $82–85 pivot; a clean weekly breakout with rising highs would favour a run toward the $100–125 zone, but weakness back below $82 would negate that view.
Regulatory Note: We are an independent development team. Our services are not registered or licensed by any regulatory body in India, the U.S., the U.K., or any global financial authority. Please consult a licensed advisor before making trading decisions.

3 Digit future for UberUber getting tight on the weekly. May need more time to consolidate and get tighter on the wedge but with a bullish EMA stack, good earnings, and in general a good company with plenty of cash on hand, I think we'll see the 100s soon. 3 digits incoming... nfa
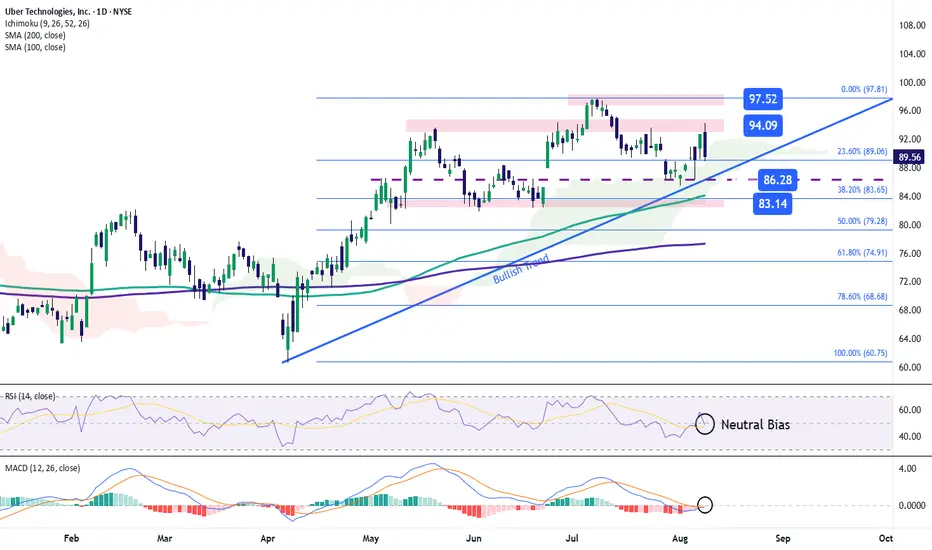
Uber Stock Fails to Hold Above $90Shortly after releasing earnings, Uber’s stock has continued to decline, posting a new drop of over 4% in the latest session, as selling pressure remains dominant in the short term. Although results were in line with expectations —with earnings per share at $0.63 and total revenue reaching $12.65 billion, compared to the expected $12.46 billion— investor sentiment has turned cautious. Doubts have emerged regarding the company's ability to sustain its growth pace, and concerns are rising over potential overspending on autonomous driving projects. These factors have weakened confidence in the stock, and as long as uncertainty persists, selling pressure may continue to build.
Uptrend Remains Intact… for Now
Since April 7, Uber’s stock has maintained a steady uptrend, which remains the dominant structure on the chart in the short term. While the recent downside correction has been notable, it has not yet been strong enough to clearly break the trend, so the long-term bias remains bullish for now. However, if bearish momentum strengthens, the integrity of this structure could begin to be challenged.
Indicators Show Neutral Momentum
Both the RSI line and the MACD histogram currently sit within a neutral zone, reflecting a lack of clear direction in the short term. If this setup persists, the recent sell-off may evolve into a more extended consolidation phase, with the price moving sideways until a new directional catalyst emerges.
Key Levels to Watch:
$94 – Key Resistance:
This level aligns with a neutral zone observed in recent weeks. If the price climbs back above this area, it could reactivate the current uptrend.
$86 – Short-Term Support:
This level forms the base of the uptrend line. If selling pressure continues, it could act as a key support. A break below it may reflect growing uncertainty and trigger a stronger bearish bias.
$83 – Critical Support:
This zone coincides with the 38.2% Fibonacci retracement level and the 100-period simple moving average. A sustained move below this point could terminate the prevailing bullish structure on the chart.
Written by Julian Pineda, CFA – Market Analyst
Uber Stock Chart Fibonacci Analysis 080725Trading Idea
1) Find a FIBO slingshot
2) Check FIBO 61.80% level
3) Entry Point > 91/61.80%
Chart time frame:B
A) 15 min(1W-3M)
B) 1 hr(3M-6M)
C) 4 hr(6M-1year)
D) 1 day(1-3years)
Stock progress:A
A) Keep rising over 61.80% resistance
B) 61.80% resistance
C) 61.80% support
D) Hit the bottom
E) Hit the top
Stocks rise as they rise from support and fall from resistance. Our goal is to find a low support point and enter. It can be referred to as buying at the pullback point. The pullback point can be found with a Fibonacci extension of 61.80%. This is a step to find entry level. 1) Find a triangle (Fibonacci Speed Fan Line) that connects the high (resistance) and low (support) points of the stock in progress, where it is continuously expressed as a Slingshot, 2) and create a Fibonacci extension level for the first rising wave from the start point of slingshot pattern.
When the current price goes over 61.80% level , that can be a good entry point, especially if the SMA 100 and 200 curves are gathered together at 61.80%, it is a very good entry point.
As a great help, tradingview provides these Fibonacci speed fan lines and extension levels with ease. So if you use the Fibonacci fan line, the extension level, and the SMA 100/200 curve well, you can find an entry point for the stock market. At least you have to enter at this low point to avoid trading failure, and if you are skilled at entering this low point, with fibonacci6180 technique, your reading skill to chart will be greatly improved.
If you want to do day trading, please set the time frame to 5 minutes or 15 minutes, and you will see many of the low point of rising stocks.
If want to prefer long term range trading, you can set the time frame to 1 hr or 1 day.
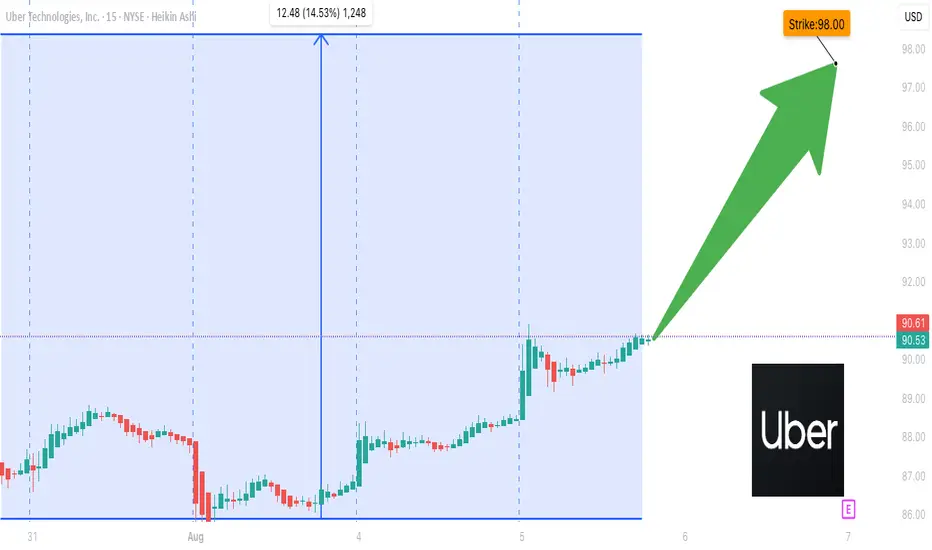
UBER Call Volume Explodes — $98C in Play Before Friday! **UBER \$98C 🚀 Call Volume Surges 3.2x – Weekly Bullish Breakout Brewing (3 DTE) 🔥**
---
### 📊 **Post Body (Optimized for TradingView):**
**UBER Weekly Call Play — Aug 8 Expiry (3 DTE)**
📈 **Sentiment Snapshot:**
* **Call/Put Ratio:** 3.22 — 🟢 Heavy bullish bias
* **Weekly RSI:** 57.6 and rising ✅
* **Volume:** 1.1x vs prior week — institutional demand confirmed
* **Daily RSI:** 42.8 — ⚠️ not yet bullish, but momentum maturing
* **Volatility (VIX):** <22 — favorable macro setup
* **Gamma Risk:** Moderate ⚠️
---
🧠 **Model Consensus Summary:**
* **All Models:** Bullish bias 🟢
* **Strike Preference:** \$98C favored by majority for best risk/reward
* **Confidence:** Avg. \~70%
* **Some Disagreement:** A few models prefer \$96C for safety 🎯
---
### 💡 **Trade Setup:**
* 🟢 **Option Type:** Buy CALL
* 🎯 **Strike:** \$98
* 💵 **Entry Price:** \$0.63
* 📅 **Expiry:** Aug 8 (3 DTE)
* 🎯 **Profit Target:** \$1.25 (\~98% return)
* 🛑 **Stop Loss:** \$0.30 (50% premium risk)
* ⏰ **Entry Timing:** Market Open
* 📈 **Confidence Level:** 70%
---
📍 **Key Risk Flags:**
* 🔻 Daily RSI <55 = potential short-term weakness
* 🕒 Only 3 days to expiry = high decay risk
* ⚠️ Watch \$92.35 resistance — reversal zone
* Monitor IV and gamma spikes
---
### 🧾 **Auto-Logger JSON (for tracking):**
```json
{
"instrument": "UBER",
"direction": "call",
"strike": 98.00,
"expiry": "2025-08-08",
"confidence": 0.70,
"profit_target": 1.25,
"stop_loss": 0.30,
"size": 1,
"entry_price": 0.63,
"entry_timing": "open",
"signal_publish_time": "2025-08-05 09:50:36 UTC-04:00"
}
```
---
### 🏷️ **Suggested Hashtags (TradingView Style):**
`#UBER #OptionsTrading #CallOptions #BullishSetup #TechStocks #WeeklyOptions #MomentumPlay #GammaSqueeze #StockAlerts #TradeSetup #UberOptions #InstitutionalFlow #ShortTermPlay`
Uber swing playBullish Setup (if you think bounce holds)
• Buy Call Spread:
• Buy $90 Call (Sept expiry)
• Sell $100 Call (same expiry)
• Lower premium, defined risk. Target profit if stock runs to resistance.
• Cash-Secured Put:
• Sell $85 Put (Sept)
• Collect premium. If UBER dips, you get assigned at an effective cost basis below support.

Repeating UBER longUBER has found the support at 91 level and will likely retest initial supply area.
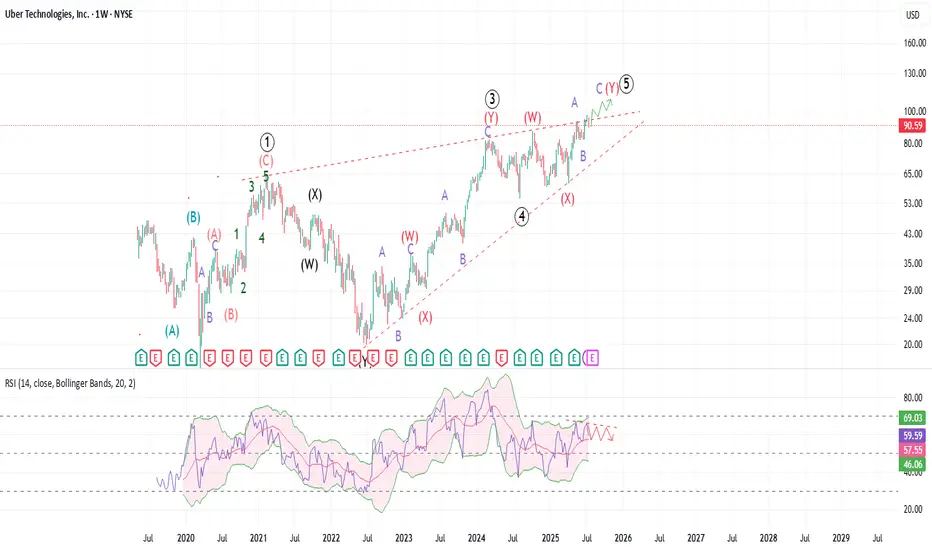
Uber: The end is nigh! Uber is most likely approaching a cycle degree end with a massive leading diagonal structure. The price might get higher than $100 or even close to $150, and it will look like an impulse, but most likely that would a long-term top. Uber is facing maximum pressure from robotaxi competitors and higher labor costs. Even with the recent Uber deal, it might be a little too late for Uber to reinvent the wheel. Even though tariffs do not have direct impact for Uber's core business, the overall economic downturn may significantly impact Uber and Uber eats business.
This count will be wrong if Uber price starts to make highs above $150, specially above $230. But, that is a long way away and the macro structure is anything but impulsive. In the short-term, looking for higher highs as weekly RSI keeps dropping. The drop after the final top will be pretty vicious, if the entire structure is in fact a diagonal. Until then, Uber is a good candidate for quick swing trades.
$UBER: Why $UBER Is a Robotaxi WinnerUber is on the verge of a major transformation, with robotaxis set to become a game-changing profit engine.
Technical charts indicate we can enter a long position today with low risk, while aiming for a long term rally resumption from here. Monthly and quarterly timeframe Time@Mode trends are bullish, suggesting price can reach heights between $111, $176 and $265 per share long term.
Here’s why the future looks bright for Uber investors from a fundamental perspective:
The global robotaxi market is projected to surge from $0.4B in 2023 to $45.7B by 2030, with Uber aggressively expanding its autonomous fleet in the U.S. and Europe through partnerships.
Uber’s approach is to integrate autonomous vehicles from partners (Waymo, May Mobility, Momenta, Avride, Volkswagen) into its platform, avoiding the massive costs and risks of building its own AVs.
Autonomous vehicles will slash Uber’s largest expense -driver payments- unlocking higher margins and scalability. CEO Dara Khosrowshahi calls AVs Uber’s “greatest future opportunity” for profit expansion.
Robotaxi pilots are already live in cities like Austin, with plans to expand to Atlanta, Dallas, and Europe by 2026. The average Waymo vehicle on Uber is busier than 99% of human drivers, showing strong demand and efficiency.
Uber’s core business is robust: Q1 2025 gross bookings up 14% to $42.8B, net income of $1.8B, and adjusted EBITDA up 35% to $1.9B. This profitability funds AV investments without sacrificing financial health.
Uber is uniquely positioned to lead the robotaxi revolution, leveraging its platform, partnerships, and financial strength. As AVs scale, expect a step-change in profitability and long-term shareholder value.
Best of luck!
Cheers,
Ivan Labrie.

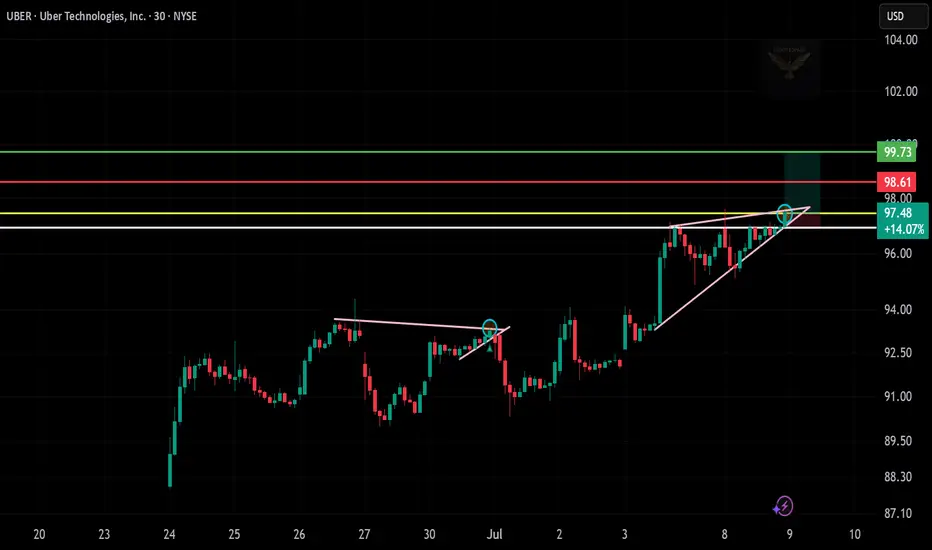
Long Trade Description (UBER | Uber Technologies Inc.)📄
Ticker: NYSE:UBER
Timeframe: 30-Minute Chart
Trade Type: Long – Ascending Triangle Breakout
UBER is forming a strong ascending triangle near resistance, with bullish momentum and clean structure. Entry is taken around $97.48, anticipating a breakout above the horizontal level. Target is set at $99.73, while the stop-loss is placed just below the triangle trendline at $96.00.
With strong trend continuation and multiple rejections at resistance, this trade offers a clear risk-to-reward opportunity with solid breakout confirmation.
📌 Trade Levels:
Entry: $97.48
Target: $99.73
Stop-Loss: Below $96.00
💡 Chart shared for educational use only — not financial advice.
📊 Follow @ProfittoPath for more actionable trade setups and real-time breakdowns.
UBER longBroken long term resistance, retested, and once again pushed 20 day Donchian Channel.
Turtles are coming out of their shells taking UBER to the new ATHs.
Long term hold.


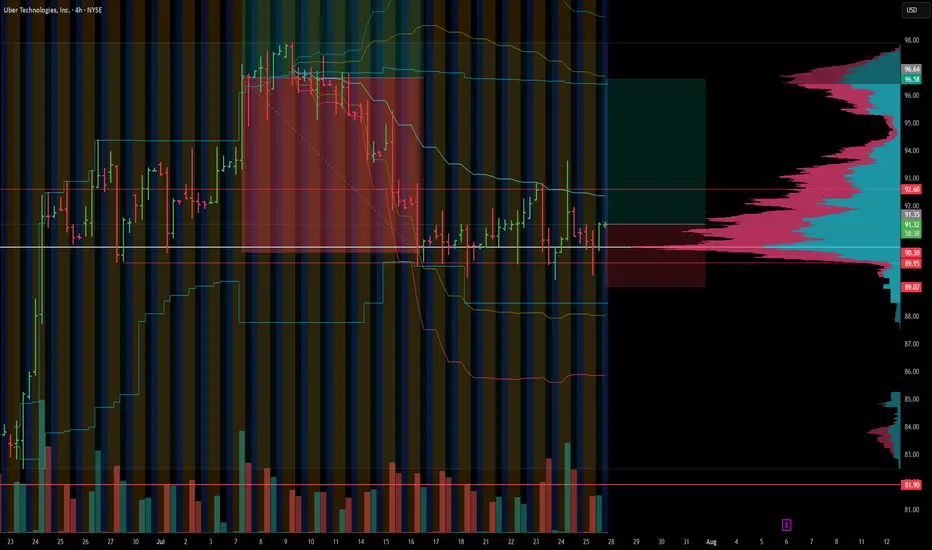
UBER · Daily — “Channel-Break” Idea Toward $110 → $125Why I Like the Setup
Secular Up-Channel: Since mid-2023 price has respected a textbook rising channel (~$30 tall).
Fresh Breakout Attempt: UBER is now pressing the upper rail near $100. A daily close above it would signal a new expansion phase.
Measured-Move Math: Projecting the channel’s height from the breakout pivot (~$80) gives Target-1 ≈ $110-113; the 127 % fib expansion points to Target-2 ≈ $124-128.
Volume Profile Tailwind: The histogram thins sharply once price is north of $100, meaning little “stored” supply until $112; a larger node re-appears near $120, my second profit zone.

Uber’s Path to $95+Uber Technologies (UBER) is positioning itself for long-term growth by expanding beyond its core ride-hailing and delivery businesses into advertising, travel, service partnerships, and autonomous vehicle (AV) technology. These strategic moves aim to diversify revenue streams and enhance operational efficiency.
Key Growth Drivers:
- Strong Core Business Performance – Uber continues to benefit from robust demand in both ride-hailing and delivery, generating significant economic profit.
- Artificial Intelligence Integration – AI plays a crucial role in optimizing pricing, reducing wait times, personalizing user experiences, and preventing fraud.
- Autonomous Vehicle Expansion – Uber is increasingly leveraging AV technology to reduce driver-related costs and scale its services.
- Strategic Investments – The company is using its strong cash flow to fund innovation, product development, acquisitions, and minority investments, driving long-term value.
- Capital-Efficient Growth – Uber’s ability to expand its service platform with minimal capital investment is expected to accelerate revenue growth and shareholder value creation.
Price Target & Options Flow:
Tigress Financial has raised Uber’s price target from $103 to $110, maintaining a Buy rating. Additionally, option flow on Uber is showing strong bullish activity, suggesting institutional interest. Given this momentum, Uber could potentially surpass $95 before August, especially if AV advancements and AI-driven efficiencies continue to strengthen its financial outlook

UBER long-term gemOn the monthly chart, Uber broke out from a massive ascending triangle and successfully retested the upper resistance, flipping it into support. You’re not ready for what’s coming!

UBER Breakout Alert!
Breaking above resistance with rising support — eyes on $95.75 🎯
Entry: $93.28 | SL: $92.70 | TP: $95.75
📈 Bullish momentum in play.
#UBER #BreakoutTrade #StockTrading #BullishSetup #ProfittoPath

Uber (UBER, 1W) Tightening Structure Ready for BreakoutOn the weekly chart, UBER has formed a strong ascending wedge / tightening channel, showing clear higher lows and repeated rejections near upper resistance. The price is now approaching the apex of the pattern, with a possible breakout setup above $82.42.
If confirmed, the projected measured move (H = $27.67) aligns with Fibonacci extension targets at:
– $89.86 (1.272)
– $93.74 (1.414)
– $99.32 (1.618)
Technical structure:
– Price held support twice, confirming bullish intent
– Structure tightening — breakout likely on sustained volume
– Bullish divergence forming on the weekly stochastic oscillator
– A breakout above $82.42 activates the next impulse wave
– Volume is stable, with no signs of heavy distribution
Fundamentals:
Uber has reached a major financial milestone: consistent profitability and positive EBITDA growth. The company continues to expand across mobility and delivery, with a focus on cost efficiency, platform monetization, and retention. Increased user activity and growing institutional interest support a bullish mid-term thesis. Uber is increasingly seen as a core holding in next-gen tech and services portfolios.
The technical structure is approaching resolution. A confirmed breakout above $82.42 opens the door for a move to $89.86 → $93.74 → $99.32. With bullish structure and improving fundamentals, Uber is positioned for the next leg higher. This is a setup worth watching.

