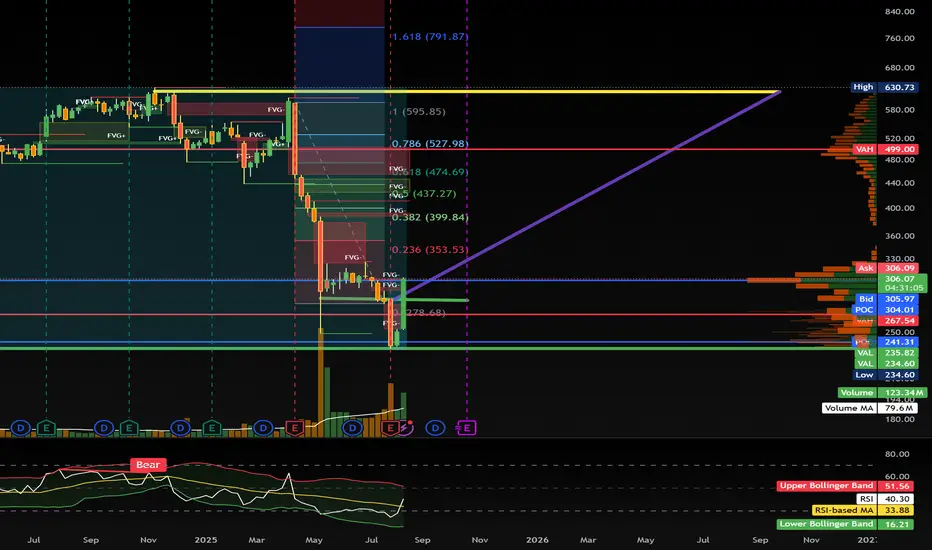
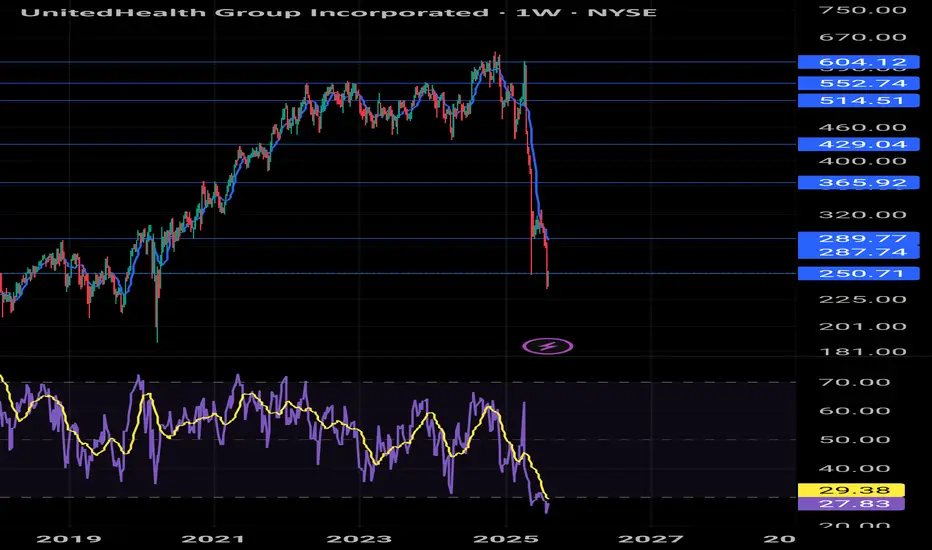
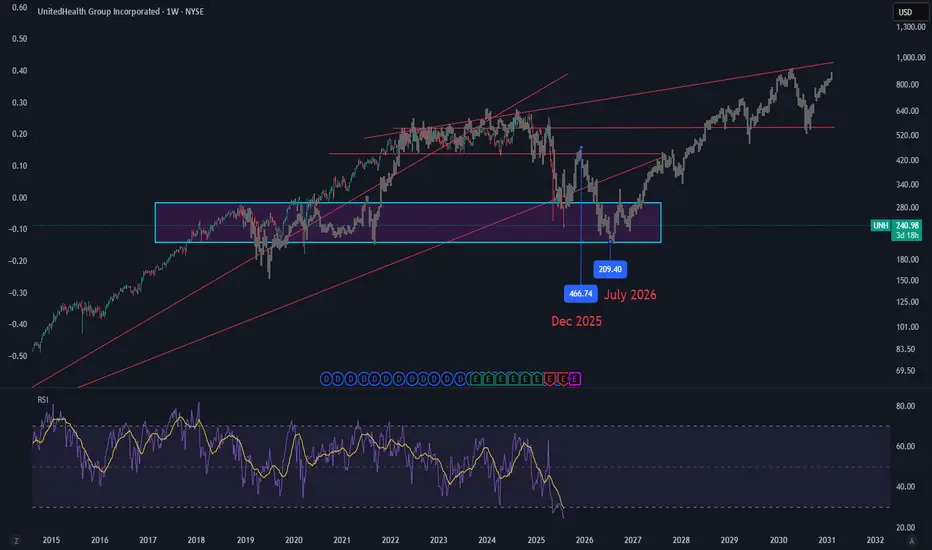
UNH clean breakoutUNH can crawl back to its trading price above $600 within the next 12 months.
After today's load up based on Buffett's news, FOMO will kick in by September for the rally to stabilize. When levels dictate the outcome, the target is obviously correct.
Next stop is $360, then stabilize, followed by $470 and stabilization, then continue to $600 and longer. The presented weekly chart shows the levels and my target. Thank you Buffett & Burry!
Trade ideas
UNH - Looking for a short-term bounce NYSE:UNH is looking at a possible bullish mean reversion to the upside after it has broken out of the steep falling wedge and a small V-shaped bottom is in. Stochastic oscillator shows an oversold crossover with bullish divergence. 23-period ROC is showing bullish divergence as well. Prices has also closes above bot the conversion and base line of the ichimoku.
Short-term target is at 320

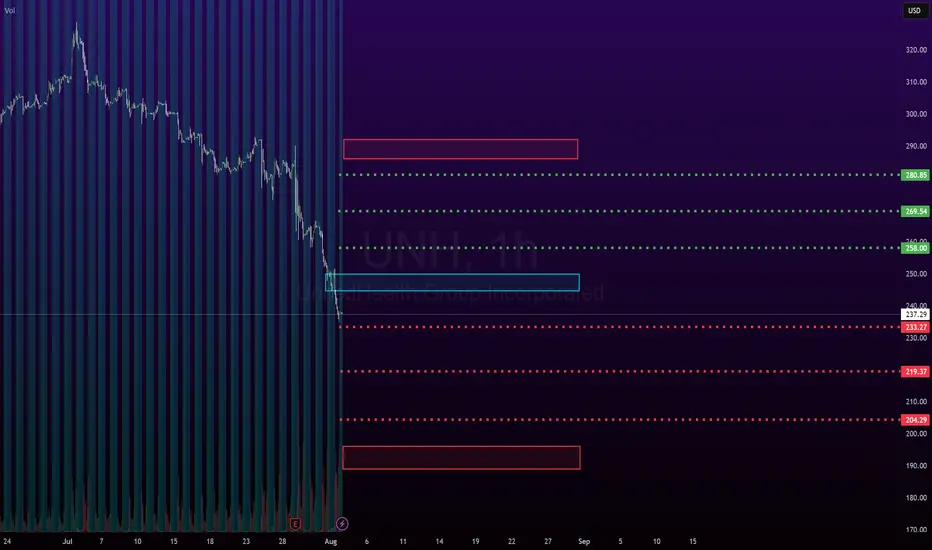
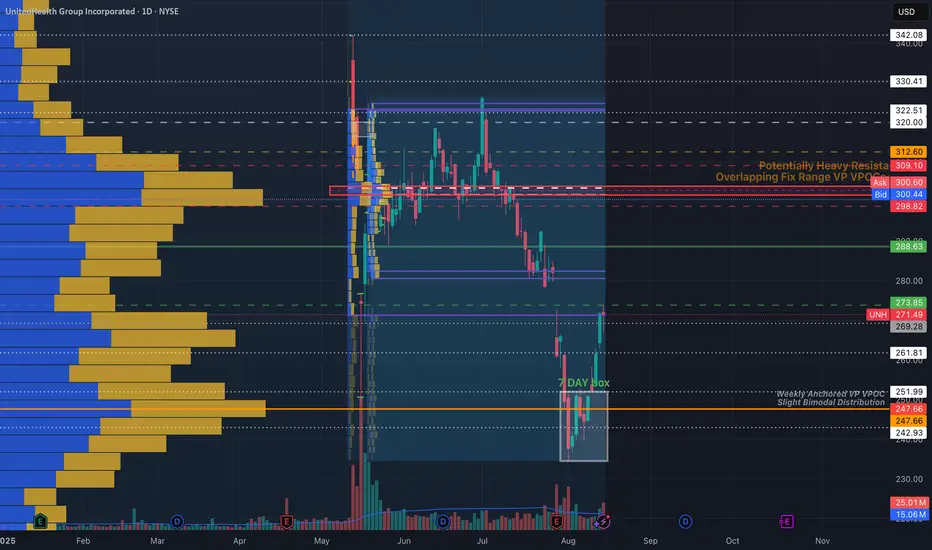
UNH LevelsJust sharing my UNH chart. Levels have been reactive so far.
Berkshire Hathaway announced their position today so the stock could get a much needed boost through that VPOC overlap area($301-304). If it goes through without issue, $309 -> $312->$320/$322. Let's see if a gap up holds into tomorrow's regular trading hours.
Pissed at the moment because I haven't gotten a chance to enter those 1/15/27 and 12/17/2027 $320 LEAPS yet.
~The Villain
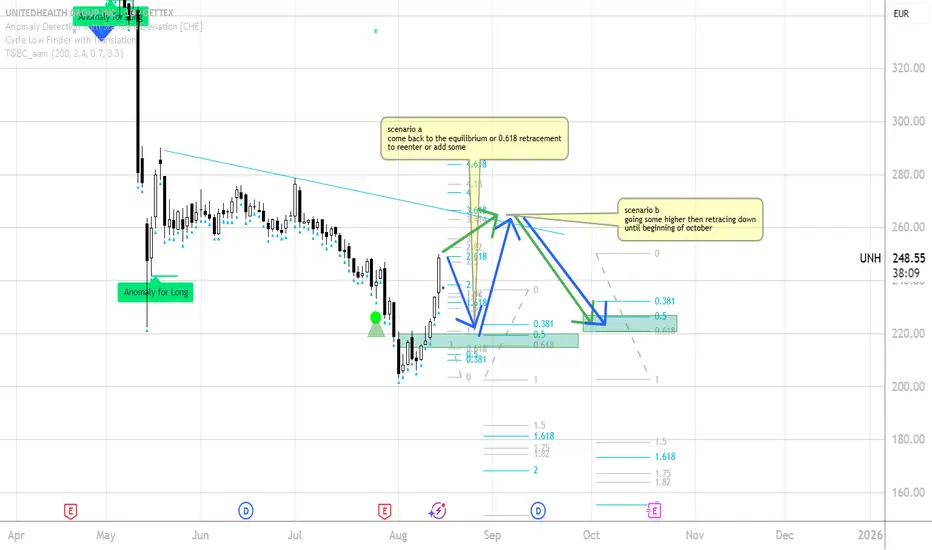
UNITED HEALTH UNH - Two scenarios based on my understanding a sescenario a:
coming back to the 50% or 0.618 retracement then up, then in a typical seasonal bearish period down until beginning of october
scenario b:
First target could be at the descrending trendline then retracement until beginning of october
to the 50% or 0.618
this is of course not a trade call or advide. for educational purpose only...
please comment or chat with me about it!
cheers!
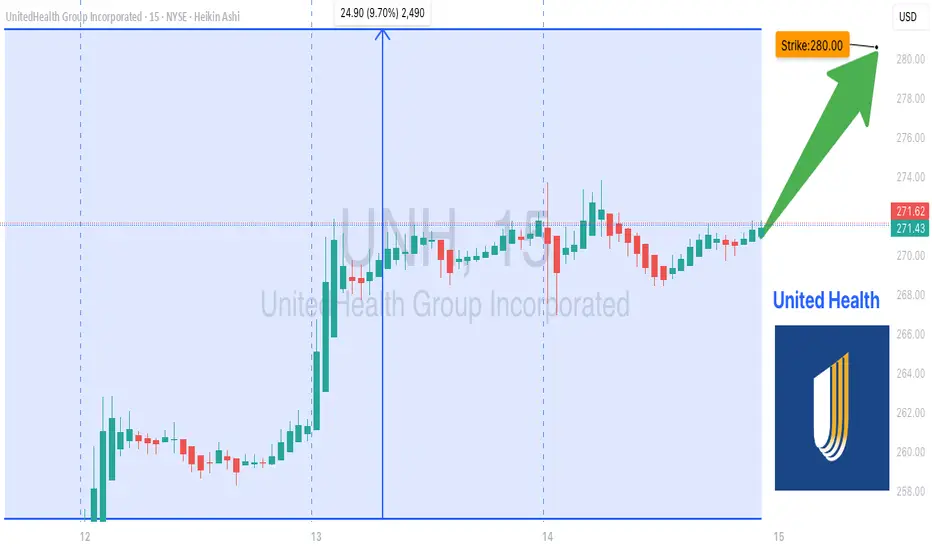
UNH $280 Calls on Fire – Momentum Exploding Today!🚀 UNH Bulls Target \$280 – One-Day Call Sprint
**Sentiment:** 🟢 *Moderate Bullish*
* **Daily RSI:** 55.7 📈
* **Call/Put Ratio:** 2.82 → strong bullish flow
* **Volume:** Weak (0.5× last week) → watch for hesitation
* **VIX:** 15.0 → favorable for directional trades
* **Gamma Risk:** HIGH — expiry in 1 day ⚡
---
### 📊 **Consensus Snapshot**
✅ Multiple models highlight bullish options flow
⚠️ Weak volume & resistance near \$272.19 = caution
💡 High gamma requires tight risk management
---
### 🎯 **Trade Setup**
* **Type:** CALL (Single-leg)
* **Strike:** \$280.00
* **Expiry:** 2025-08-15
* **Entry:** \$0.70
* **Profit Target:** \$0.91 – \$1.40 (+30–100%)
* **Stop Loss:** \$0.42 (≈40%)
* **Confidence:** 65%
* **Entry Timing:** Market open
---
💬 *High-risk, high-momentum expiry play — monitor closely.*
📌 *Not financial advice. DYOR.*
---
**#UNH #OptionsTrading #CallOptions #TradingSignals #DayTrading #StocksToWatch #GammaRisk #OptionsFlow**
United Health - The perfect time to buy!⛑️United Health ( NYSE:UNH ) finished its massive drop:
🔎Analysis summary:
Over the past couple of months, United Health managed to drop an incredible -60%. This drop however was not unexpected and just the result of a retest of a massive resistance trendline. Considering the confluence of support though, a bullish reversal will emerge quite soon.
📝Levels to watch:
$250
SwingTraderPhil
SwingTrading.Simplified. | Investing.Simplified. | #LONGTERMVISION

Update ( UNH ) As I mentioned earlier
Breaking and stability above 252, the stock goes to the targets mentioned in the chart
Currently, the stock has achieved the first and second goals
And we take our precautions now between 280 - 270

LONH UNHWill Long UNH. Patiently waiting for my entry which is monthly sweep and back above. Entry, SL & Exit all there.
Manage your risk! #DYOR

$UNH - Going InWe picked up 100 shares of UNH here, it's just too oversold and beat to ignore to at this point.
A 40-50% drop on earnings with speculation on regulatory concerns just seems a bit dramatic. The stock has a conservative dividend growth rate of 14% over the past 5 years. Several analysts still have a Buy rating for the stock with a price target of around $379 (some $400).
Disclaimer:
I do not provide personal investment advice and I am not a qualified licensed investment advisor. I am an amateur investor.
All information found here, including any ideas, opinions, views, predictions, forecasts, commentaries, suggestions, or stock picks, expressed or implied herein, are for informational, entertainment or educational purposes only and should not be construed as personal investment advice. While the information provided is believed to be accurate, it may include errors or inaccuracies. I will not and cannot be held liable for any actions you take as a result of anything you read here.
Conduct your own due diligence, or consult a licensed financial advisor or broker before making any and all investment decisions. Any investments, trades, speculations, or decisions made on the basis of any information found on here, expressed or implied herein, are committed at your own risk, financial or otherwise.
Feel free to give us a follow and shoot us a like for more analysis updates.

UNH Ready to Rip – $265 Calls Set for Liftoff!🚀 **UNH Bulls Take Charge – \$265 Calls in Play!** 🚀
AI models flash **Strong Bullish** this week with a **5.17 Call/Put ratio** and **low VIX (15.9)** – perfect storm for upside momentum. 📈
**Setup:**
🎯 Strike: \$265C (Aug 15)
💵 Entry: \$0.80 | PT: \$1.20–\$1.60
🛑 Stop: \$0.39
⚡ Confidence: 65% – Watch volume!

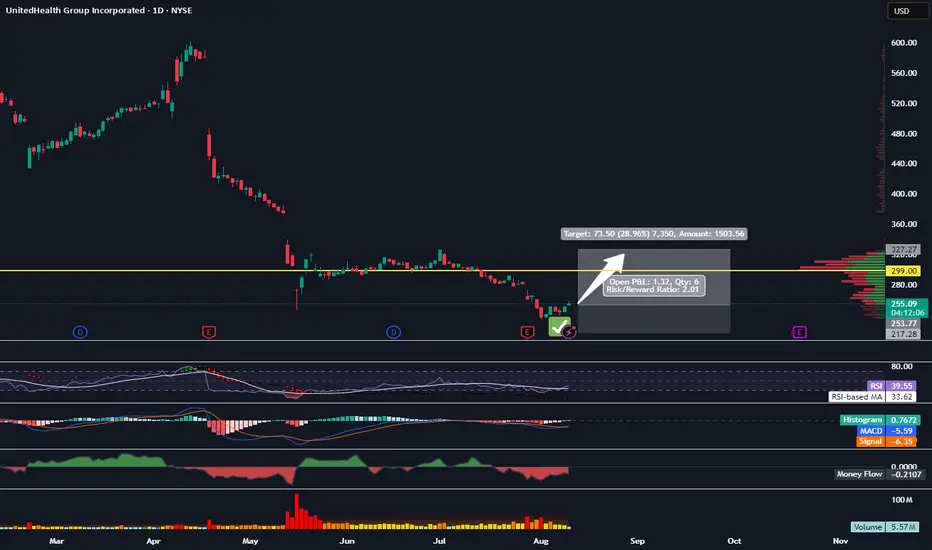
Entering UNH HereTrading Fam,
I'm not going to go into a long exposé about how great the technicals are here because, truthfully, they are not great. In fact, there is relatively little that supports any kind of entry here other than the fact that this stock is extremely oversold. Really, the only reason I even considered an entry here is that my indicator has given me a buy. If you have been following me for any length of time, you know that this thing is knocking it out of the park in stocks. But to keep it safe, I am entering a 1:2 long rrr, shooting for $327 with a $217 SL. Let's see if my little indicator can keep its amazing win streak going even without a lot of technicals to support it.
✌️Stew
Generational Buying Opportunity?UnitedHealth Group, a complete sh*t show of a company. The CEO gets murdered, public sentiment towards insurance companies remain at an all time low.
Is this business salvageable? Well, we now have the veteran CEO return to his former job, he was already on the board and understands the company and industry well.
Can the experienced CEO save this sinking ship? Or will all the rats on board sink, drowning investors along with it?
Nobody knows, that's the truth. And if they do know, no amount of insider buying will save the stock when the selling occurs. It could end up like Enron. I am watching the chart on this very closely. There is a potential huge reward from a return to normality for this business, that is only if you believe.
They will be able to repice their premiums later this year around September/October. Margins should improve over the long turn, this could be one big panic. It remains to be seen. For now we are in a brutal downtrend, any brave dip buyers may be rewarded only in the long term, at buying at any level between here down to $200 DCA.
Not financial advice, do what's best for you.

UnitedHealth: Deeply oversold but worth a closer lookUnitedHealth (UNH) is the largest private healthcare company in America. Eight million Medicare Advantage members. Optum’s network reaches tens of millions more. It has the data, the reach, and the pricing power. At today’s valuation, it’s worth adding to your watchlist. Forward P/E at 11× versus a five-year average of 14×. Price-to-sales at 0.6×. RSI at levels not seen in decades. Oversold. Under-owned.
Mispriced? Potentially. We must make it very clear that there could be more downside. But upside is also worth considering.
The AI angle is real. UNH’s health data trove is unmatched. AI can strip billions in waste, automating claims, flagging fraud, predicting costly illnesses before they happen. This isn’t science fiction. It’s execution. Done right, it builds margins and widens the moat. Few can play at this scale. UNH can.
Healthcare as a sector trades 20-30% cheaper than the S&P 500. Aging demographics and chronic care demand are long-term tailwinds. A re-rating here could be swift and brutal for anyone short.
Now, the problems. Medical costs are spiking. Medicare Advantage margins are squeezed. Guidance was pulled, and that spooked the market. Leadership turnover added uncertainty.
These are real headwinds. But they’re fixable.
Premium hikes are already being set for 2026. Stephen Hemsley, the architect of UNH’s prior growth, is back. He’s cutting, reviewing, and bringing in outside talent.
Price implications? The market is pricing in permanent damage. That’s why you can buy a market leader at a crisis multiple. If margins recover and AI efficiencies kick in, this stock doesn’t just bounce, it re-rates. The gap from 11× to 14× earnings on UNH’s scale is tens of billions in market cap.
The bear pit is noisy. The bull case is quiet. But it’s there, and it’s strong. Stop losses are important to manage more downside risk.
The forecasts provided herein are intended for informational purposes only and should not be construed as guarantees of future performance. This is an example only to enhance a consumer's understanding of the strategy being described above and is not to be taken as Blueberry Markets providing personal advice.

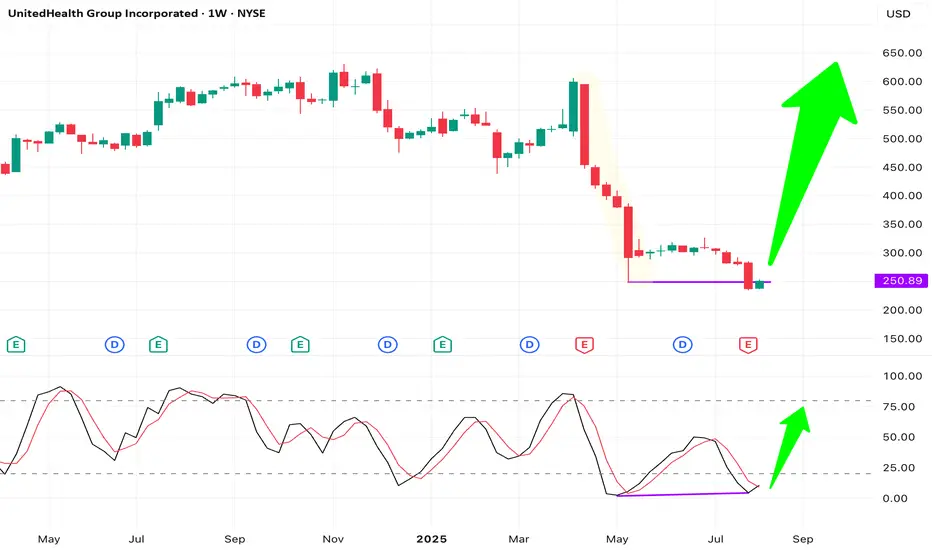
UNH – Force Bottom with Bullish Divergence at Support(Weekly Chart) NYSE: UNH remains a fundamentally strong company, even though healthcare is not currently the market’s leading sector. On the weekly chart, price action shows a force bottom (double bottom with take-out stops pattern), flushing stop-losses below the previous low at $248.88.
Last week, price closed back above the $250 support with a bullish candle. Price action and stochastic show a bullish divergence, with stochastic oversold and starting a golden cross. Risk-reward looks very favorable from this level.
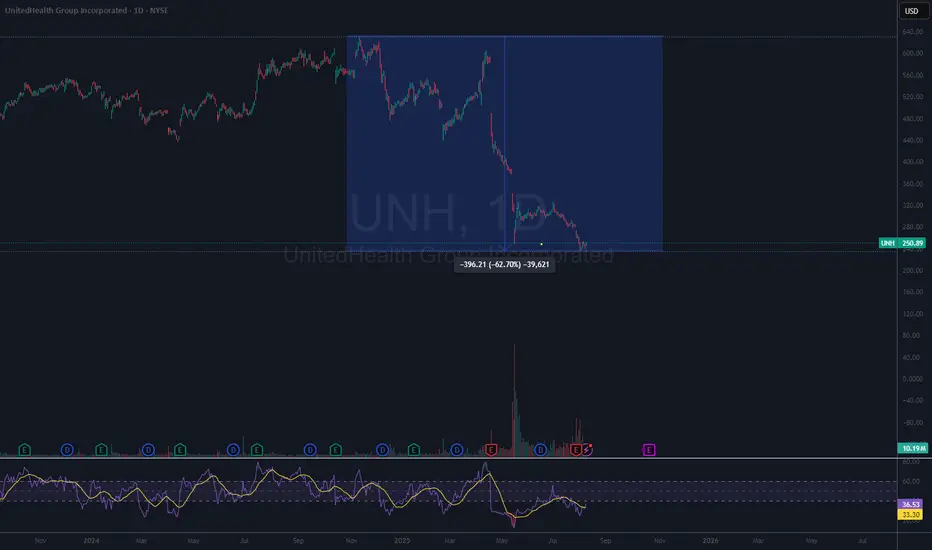
UNH a dead stock?After a 63% drop this year from its high, the stock has started seeing rebound.
- UNH's trailing P/E is near 10–11×, while forward P/E is compressed to ~15×
- The RSI had dropped to extreme oversold levels (~20) before rebounding above 39
- Despite current headwinds, UNH raised its dividend by 5%—marking 15 consecutive years of increases. Their current yield (~2.9%) is well above S&P 500 average.
- Q2 operations generated strong cash flow ($7.2B) and delivered a 20.6% return on equity, signaling disciplined capital allocation.
- High upside potential if earnings and sentiment recover.
- according to the quarterly call, New metrics set clearer expectations and reflect internal control.
This is a good stock to get into if you are looking at a 1-2 year horizon.
UNH 4H #UNH
4 hours frame..
Breaking and stability above 252 by closing the stock's targets
259 - 270 - 280
We raise the degrees of caution when the price reaches the levels of 270 - 280
Stop loss per stock Trading closes below 240
In case of closing 4 hours below 240, the stock is looking for a new bottom
Not a recommendation to sell or buy
Trade smartly

Bull Run SignalA recent negative news event has caused a sharp drop in the stock’s price. While this initially seems bad, it has actually created what I believe is a once-in-a-lifetime buying opportunity.
The Relative Strength Index (RSI) is showing extremely oversold levels across multiple timeframes — weekly, monthly, 3-month, 6-month, and even yearly. In fact, the 6-month RSI is lower than it was during the 2008 market crash.
Given these rare conditions, I am investing with strong confidence. I expect both short-term and long-term price targets to be reached before the end of the year, and I believe the stock could even reach new all-time highs over the long term. My outlook includes the possibility of the stock price entering four-digit territory in the future.
Once the market momentum shifts and the bull run begins, I expect heavy media coverage to follow. By then, smart investors who recognized this opportunity early will already be in position to benefit.
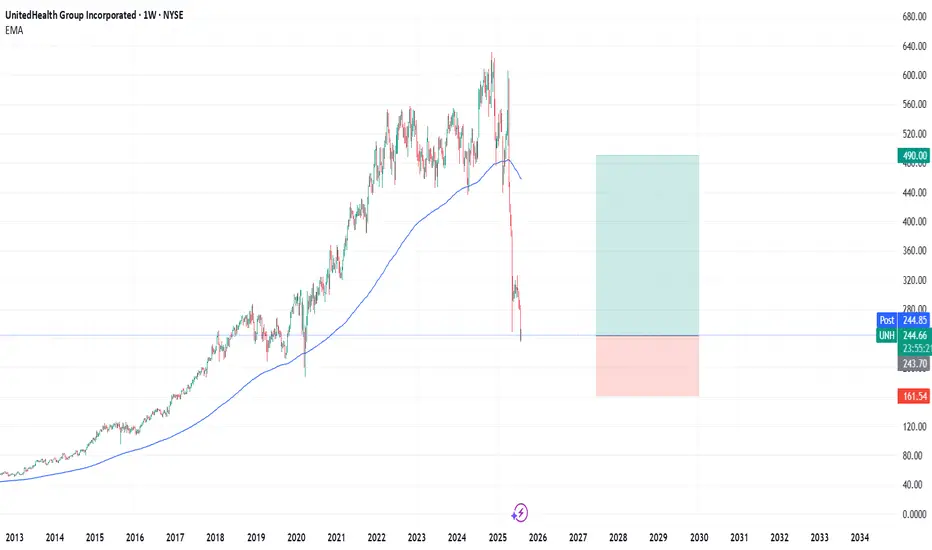
UNH : Stubborn is my First Name Hello friends,
While stubbornness and determination are very different concepts, "stubborn" is more meaningful for events whose outcome we cannot predict.
1- First of all, hedge amount for this trade should be allocated to very safe and more stable financial instruments, at least 6-7 times the position size of this trade.
2- This idea is a continuation of my opinion regarding UNH.
3- I defend the following general view:
This was a situation I carefully considered and formulated (holding UNH shares for the medium term).
Therefore, a price drop will not change my opinion in any way.
Increased costs are mentioned for some items, but their share of stock revenue is not stated.
4- Still valuable Risk/Reward Ratio
5 - Reasonable P/E Ratio and financials
Let's not forget item 1, because it will be necessary in three situations:
a- A major financial collapse in the stock
b- A global economic crisis.
c- Even if these are not the case, a gradual buyback (total x amount pos size) at 215 and 200
Parameters (for People who dont want to hold) :
Risk/Reward Ratio : 3.00
Stop-Loss : 161.54
Take-Profit Point : 490.00
Best Regards.
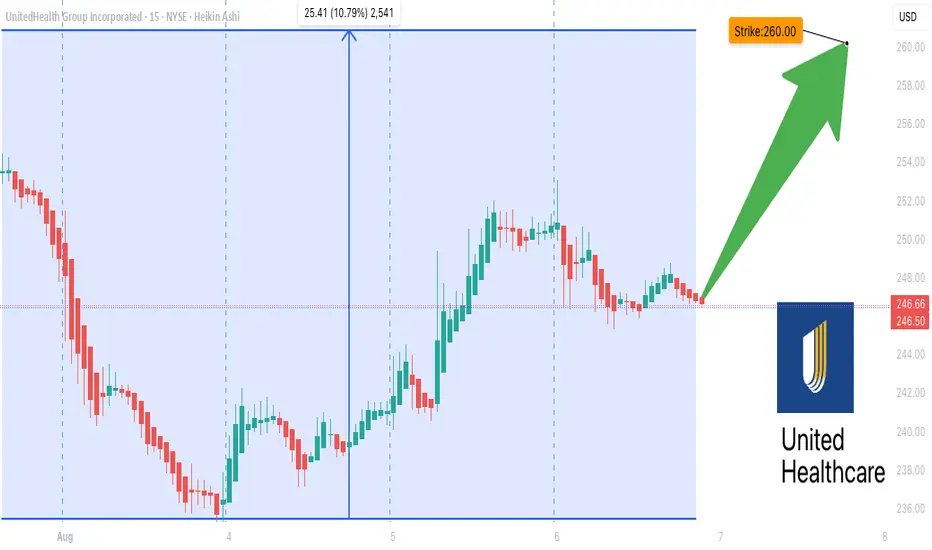
Big Money Is Betting on UNH — Are You In Yet?## 🚀 UNH Weekly Trade Idea: Bullish Momentum Brewing at \$260! 📈💥
UnitedHealth Group (\ NYSE:UNH ) is flashing bullish signals across the board:
📊 **Call/Put Ratio: 3.12** → Heavy institutional bullish flow
📈 **Daily & Weekly RSI: Rising**
💰 **Volume Increasing** → Accumulation Mode?
⚠️ **Gamma Risk HIGH** → Perfect storm for explosive moves!
---
### 🔥 Trade Setup:
🟢 **Buy 260 Call** (Exp: 08/08)
💵 Entry: \$0.69
🎯 Profit Target: \$1.03 – \$1.38
🛑 Stop Loss: \$0.34
📈 Confidence: 65%
All models aligned on this: **Bullish Bounce Likely**
Range of strikes (\$255–\$260) show heavy interest = 🚨 breakout setup
💡 **Risk Management:** High gamma = fast moves. Lock profits or cut quick. Stay nimble!
---
### 📌 Suggested Hashtags/Tags:
```
#UNH #OptionsTrading #CallOptions #BullishSetup #RSI #GammaRisk #WeeklyTrade #StockSignals #MomentumPlay #HealthcareStocks
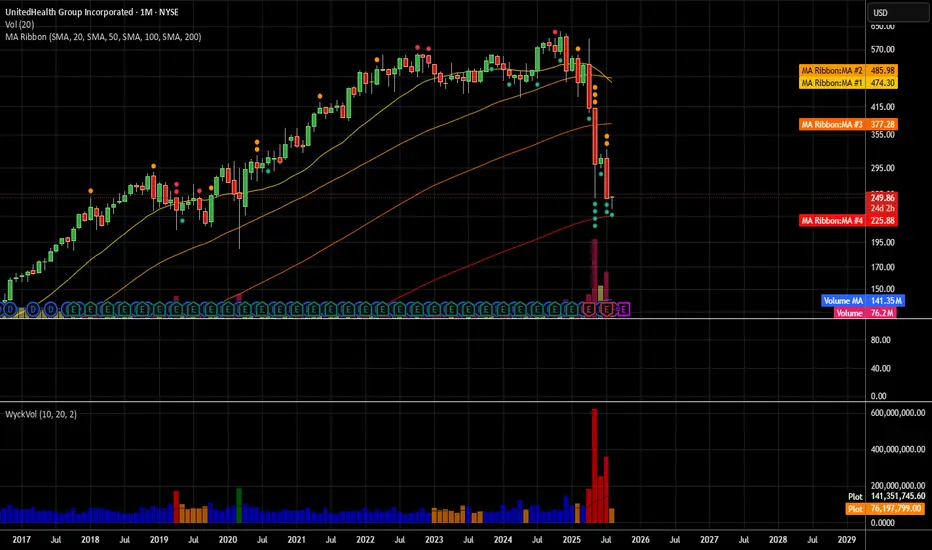
UNH Overview 1M candlesThe price is currently around $250.51, rebounding after a steep drop.
There’s strong volume spike on the recent candles, suggesting capitulation selling and potential reversal.
The price is sitting near the SMA 200 on the monthly chart which historically acts as major long-term support.
Overhead resistance MAs: SMA/EMA 20/50 around $267–$280.
📈 Bullish Target Zones
First target (T1): $267 – near the 20/50 EMA/SMA cluster, where initial resistance is likely.
Second target (T2): $280–$285 – prior consolidation zone before breakdown.
Stretch target (T3): $300 – 310 retest of breakdown highs.
UNH: Possible pattern lasting years.Hello,
As soon as I saw this pattern on UNH, i remembered few years ago i have seen same pattern.
Mostly it matches the current pattern.
This is just a guess work.
Happy investing NYSE:UNH
Turning Stock Declines Into Your Best Trading OpportunityTurning Stock Declines Into Your Best Trading Opportunity
When stocks fall dramatically, many investors panic. But what if those drops were actually the set-up for some of the most lucrative opportunities?
In this article, you’ll discover why sharp declines can set the stage for outsized gains, how the mathematics of recovery works, and how to use classic technical patterns to identify the ideal entry points. And the most important, how to do it easily on Tradingview!
The Power of Recovery: Why a Drop = Big Upside
Every percentage drop in a stock’s price requires a much larger percentage gain to return to its previous high. Recognizing this simple truth can turn “market fear” into “trader’s opportunity.”
Here’s exactly what a stock would need to climb, after various drops, to reclaim old highs:
| Drop (%) | Required Gain to Recover (%) |
|----------|-----------------------------|
| 10 | 11.1 |
| 20 | 25.0 |
| 30 | 42.9 |
| 40 | 66.7 |
| 50 | 100.0 |
| 60 | 150.0 |
| 70 | 233.3 |
If a top-quality stock drops 50%, it needs to go up 100% just to get back, so smart entries after steep drops can double your money on a bounce.
When These Pullbacks Are Opportunity: The Case of Market Leaders
Stocks like Eli Lilly, UNH, Novo Nordisk, ASML, AMD, or Lululemon are examples of quality growth companies that sometimes undergo sharp, hype-driven sell-offs.
Recent history shows:
- Eli Lilly, UNH or Novo Nordisk : Leaders in innovative health solutions, frequently see pullbacks despite strong demand in their sectors.
💊 NYSE:LLY (Down up to 30%)
Most analysts are highly bullish on Eli Lilly , with most giving it a "Strong Buy" rating. The 12-month consensus price target ranges between $956 and $1,016 , suggesting a 25–32% upside from current levels . Optimism is driven by strong momentum in its obesity and diabetes drug pipeline, especially GLP-1 treatments like orforglipron. Risks include high valuation and dependence on future drug approvals.
Technically speaking, Eli Lilly is currently trading within a channel , also known as a flag pattern when it forms during a bull trend. There are two common ways to trade this setup:
You can either wait for the price to drop to the bottom of the channel for a lower-risk entry, or wait for an upside breakout to join the rally at its strongest point.
Both approaches are considered low-risk, high-reward trades. However, entering a position right now is not ideal , as there is still room for the price to decline before a potential breakout in this premium stock.
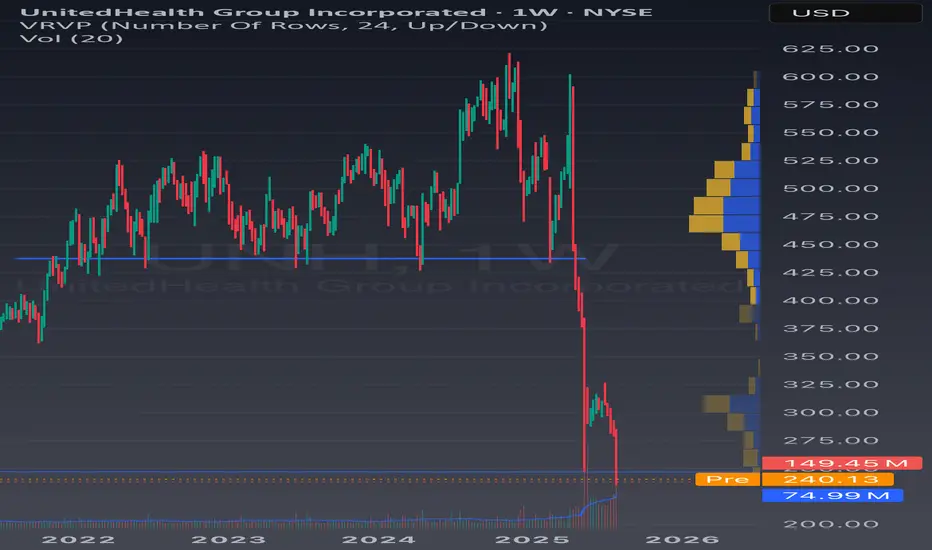
💊 NYSE:UNH (Down up to 60%)
The Analysts are generally positive on UnitedHealth Group , despite recent challenges like CEO changes and regulatory concerns. Most believe the company has strong fundamentals and expect it to recover over time. The average 12-month price target ranges from $380 to $400, which suggests a potential upside of over 60% from current levels . While a few firms have lowered their outlook, the majority still recommend buying the stock.
Technically speaking , the price dropped after breaking below its support zone (red).
It briefly paused in a first support area (blue), where some optimistic buyers stepped in, but eventually continued down to a more important zone.
The green area marks the main trading zone from before COVID , with high volume and strong interest, this is where many institutional investors are likely to see value and start buying this premium stock again .
Interestingly, analysts’ average price targets are below the previous support, suggesting a possible pullback to that area. If this happens, it could mean a 60% to 90% rally for UNH from current levels (though some further decline within the green zone is still possible and as we saw at the start, even more profits!).
💊 NYSE:NVO (Down up to 70%)
Analysts have a cautious but constructive outlook on Novo Nordisk, with an average 12‑month price target of around $80.
While some firms maintain buy ratings, many have recently lowered their views amid mounting competition from Eli Lilly and concerns over copycat semaglutide products depressing growth. A few stronger bulls still point to the long-term potential in obesity and diabetes markets as reasons for future upside. Others see significant headwinds, noting falling demand for legacy drugs and disappointing trial outcomes such as CagriSema setbacks. Overall, most analysts expect a recovery from current levels.
Technically speaking , the price dropped after breaking below a Head and Shoulders pattern , which led to a sharp decline in Novo Nordisk's stock.
The price has now reached a key previous support zone, where the Volume Profile (VRVP) shows significant activity, this often suggests institutional investors may start buying again, viewing the current levels as a bargain. While it's wise to be cautious ahead of tomorrow’s earnings report, the overall downside risk appears limited, given the company’s strong cash flow and solid product pipeline.
That said, investor expectations around obesity and diabetes treatments are no longer as optimistic as they were a few years ago, which could weigh on future growth. Still, from a technical and fundamental standpoint, this area may offer an attractive entry point to sell at $80 for a 70% profit!
Other well-known stocks that could present an amazing opportunity soon include NASDAQ:LULU , EURONEXT:ASML , NYSE:MRK , NASDAQ:PEP , SPOT NYSE:SPOT or $NYSE:PFE. Right now, I don’t see strong patterns in these charts , but they’re approaching interesting buy zones. I’ll be keeping a close eye on them, just in case a setup starts to form.
These tickers, as of August 2025, stand well below consensus price targets, so a recovery from current levels toward analyst consensus highs could deliver powerful returns.
⚠️ An example of previous opportunities
I like to understand the past before trying to predict the future , so it’s fair to show some previous examples of stocks that were "on sale."
The first example is NASDAQ:META
A well-known premium stock that experienced a massive crash during 2021 and 2022 due to the failure of its metaverse strategy. The stock lost more than 75% of its value , a truly astonishing drop. During this period, a falling wedge pattern formed on the chart , indicating that bearish sentiment was fading. After confirming the pattern, the stock went on to rally more than 700% , yes, you read that right, a 700% rally followed.
Later, another crisis, this time triggered by Trump, hit the stock, causing a sharp 35% drop in just a few weeks. Eventually, the price reached a strong buy zone (high VRVP and previous important supports), and in the weeks that followed, we’ve seen a 63% rally that is still unfolding.
During 2025 , we’ve also seen
NASDAQ:NVDA fall 35%, only to come back with a 110% rally .
NASDAQ:MSFT dropped 25% and then delivered an impressive 60% gain afterward.
NYSE:ORCL lost 40% in just a few months, and now we’re seeing a massive rally, up 120% , even outperforming NVDA. Simply amazing.
🚀 Finally, some previous published ideas based on the same principle:
⭐ Buying COINBASE:XRPUSD after a large decline (Yes, the methodology also work for other assets!)
⭐ Buying NASDAQ:DLTR at the bottom, after a 65% decline to enjoy a (for now) 90% rally.
⭐ Buying AMEX:GROY after doing two Double Bottoms and breaking the resistances for a 25% rally.
You can find more Ideas on my profile, always based on Chart patterns with low risk and high returns profile .
⏳ Entry Timing: Rely On Technical Patterns, Not Indicators
The key to entering these stocks efficiently isn’t about moving averages, RSI, or fundamentals. It’s about reading price action, volumes and technical chart patterns that reflect buyer behavior and sentiment shift.
Some famous examples:
- Double Bottom : Two clear lows near the same support zone, signaling sellers are losing strength and buyers may take control. The breakout above the intermediate high is usually a decisive signal of a trend reversal. I have published multiple ideas with double bottoms recently.
- Hammer Candle at Support : After a strong decline, a single candle with a short body and a long lower wick near a known support. This shows aggressive intraday buying, hinting that the sell-off momentum is vanishing.
- High Volume at Support: While volume isn’t a classic “indicator,” a surge in transactions as price holds support often marks institutional buying, confirming higher conviction in a potential bottom. Also the VRVP lateral indicator is a great help to know price levels with masive volume.
Spotting these technical structures on stocks deeply “on sale” lets you step in with a skewed risk/reward: your downside is defined (below support), your upside is open (toward recovery), and your edge comes from patient pattern recognition, not luck.
The TradingView screener is a great tool for finding “on-sale” stocks by filtering based on % Change. Pro Tip : The % Change is set to 1-day by default, but you can adjust it to show up to 1 month using the blue dropdown at the top.
After that, you have pattern recognition indicators like double bottoms or the VRVP for volume zones which are both AMAZING.
🔍 Visualize the Opportunity
Here’s your roadmap :
1. Scan for sharp declines in leading names, ideally those with price objectives far above current prices.
2. Strong technical pattern (double bottom, hammer on support, high-volume reversal days).
3. Wait for confirmation of pattern completion with renewed bullish price action or buy in the support, that is risky, but gives a unique risk reweard ratio when it works!
4. Act decisively when patterns confirm, your entry is efficient, your risk controlled, and your recovery math is in your favor.
> Remember : Technical patterns are your best ally for timing entries during periods of panic-driven price drops. Used well, they help you capture robust returns with clear risk management, making market sell-offs a trader’s opportunity, not a threat.
It seems that this August is a good month to start practicing finding bargains.
💬 Does this post helped you?
🚀 Hit the rocket if this helped you spot the opportunity and follow for more clean, educational Chart Patterns trade ideas!
UNH: Monthly outlook UNH is an interesting case study, fundamentals vs technicals vs math.
If you were sleeping, here are the cliff notes on UNH:
UNH is alleged to have commited the following violations/criminal offences
Medicare Overbilling: The U.S. Department of Justice has accused UNH of overcharging Medicare by more than $2.1 billion, allegedly by manipulating diagnosis codes to inflate payments.
Securities Fraud: A class action lawsuit claims UNH misled investors by denying coverage to boost profits, which allegedly contributed to a sharp drop in stock value.
Undisclosed Payments: Reports suggest UNH made secret payments to nursing homes to reduce hospital transfers, potentially compromising patient care.
How did it come to light, you ask?
From whistleblowers, investigative journalists and a DOJ probe (department of justice).
While the investigation is ongoing, if they are found guilty of any or all of these allegations, the penalties could be:
Billions in fines
Civil damages
Criminal charges
Sanctions that can fundamentally interfere with how they do/conduct business
With that out of the way, ask yourself: Am I buying this while there is an ongoing criminal investigation that could very well result in the insolvency of an organization?
I know a lot of people think the charts tell the news, but something this serious unfortunately can't be foretold by a chart, in my opinion.
But let's humour the fallacy that these traders have, and entertain whether or not UNH could theoretically be a buy.
Technicals:
Oversold, obviously.
No clear bottom pattern.
No clear chart pattern at all.
Massive investor exodus, with the current selling volume being almost as much as the flash crash we had the beginning of this year and the third highest in UNH's long, long life on the NYSE.
Math:
While UNH is below is quadratic mean, it has not triggered a bullish mean reversion signal yet.
Forecast into next week is bullish with some upside bouncing expected.
Mid term forecast (over the next month) has it coming down to 220.
The math levels are posted in the chart and 220 is actually the second low target on the month, so that's interesting.
This will go lower obviously if guilt is found or damming evidence comes forth in the media over the next days. I say this because UNH popped up on my sweep alerts. Four (4) very large option orders have popped up on my order flow screener for UNH, totaling over 7 million in short premiums (puts).
First is the 480 put strike expiry 08-15 of this year with 4.2 million in premiums bought.
Second is the 530 put strike, expiry 09-19 of this year with 634 k in premiums bought.
Third is the 540 put strike, expiry 09-19 with 815 k of premiums bought.
Last is the 600 put strike, expiry 01-16-2026 with 554 k of premiums bought.
This obviously has me interested that someone knows something about stuff.
But this is not advice, just reporting what I see.
Safe trades everyone!