UNH Liquidity Grab Signals Cycle Reversal - Are you ready?A multi-decade bull cycle doesn’t end quietly.
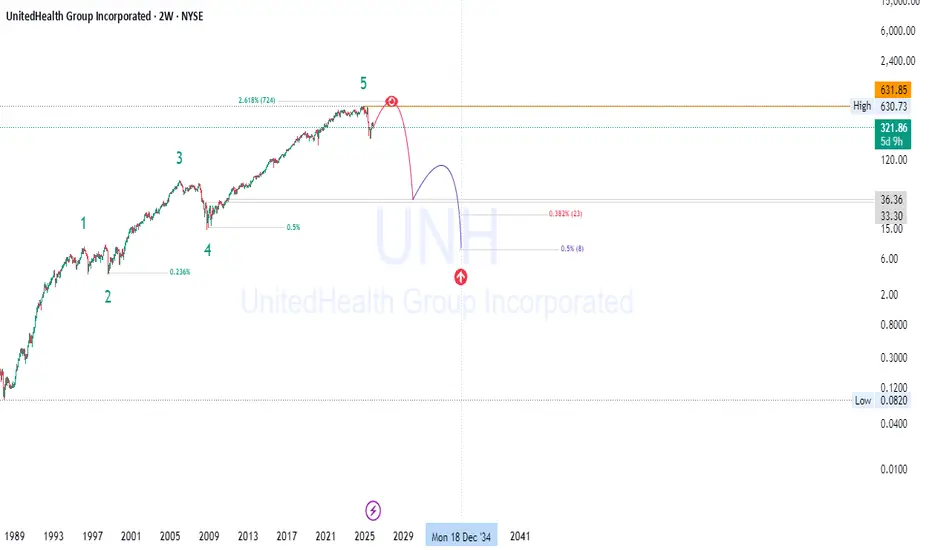
UNH’s Wave 5 has reached exhaustion, and the chart is finally revealing what the next macro chapter might look like.
When price, structure, Fibonacci geometry, and smart money behavior all align — the market is speaking.
🌀 Wave Theory
UNH has completed a full 5-wave macro cycle , with Wave 5 extending unusually far. Extended fifth waves often lead to deep corrections as the trend matures.
🔍 Market Structure
For the first time in years:
higher highs stopped forming
internal structure broke
price failed to reclaim the breakdown
These are early signs of long-term reversal.
🧠 Smart Money Concepts
Institutional behavior is visible at the top:
liquidity sweeps above prior highs
distribution in premium pricing
immediate sell-offs after stop hunts
These are not accumulation behaviors.
📈 Price Action
Wicks, compression, and fading demand show exhaustion.
Large inefficiencies remain unfilled far below current price — and markets revisit these over time.
📊 Fibonacci Geometry
Wave 5 halted nearly at the 2.618 extension , a textbook termination point.
Retracement zones at 0.382–0.5 match the likely landing zone for a large ABC correction.
🔮 Takeaway
Even fundamentally strong companies undergo cycle resets.
This setup suggests UNH may be entering a multi-year corrective phase , fully consistent with long-term market cycles and technical exhaustion.
If you found this breakdown valuable, follow for more multi-timeframe analysis, wave theory insights, and institutional-level charting.
Drop your tickers in the comments 👇 — We’ll analyze the next one 📊🔥
#UNH #WaveTheory #ElliottWave #SmartMoneyConcepts #SMC #FibonacciTrading #MacroCycles
#PriceAction #MarketStructure #TradingView #TechnicalAnalysis #ChartPatterns
#LongTermInvesting #MarketCycles #Liquidity #TraderEducation #StocksAnalysis
Trade ideas
Hate to say this but $UNH should test the gap below at $273- I didn't want NYSE:UNH to act this weak and was expecting a break above $400 after earnings but price action of NYSE:UNH is weak.
- NYSE:UNH isn't behaving like safe heaven like it did back in Feb 2025 and 2022.
- Overhang from previous episodes of draw downs has affected NYSE:UNH appeal of safety.
- It's better that it closes the gap below so that we don't have to do BS again
- Next quarter would be more critical
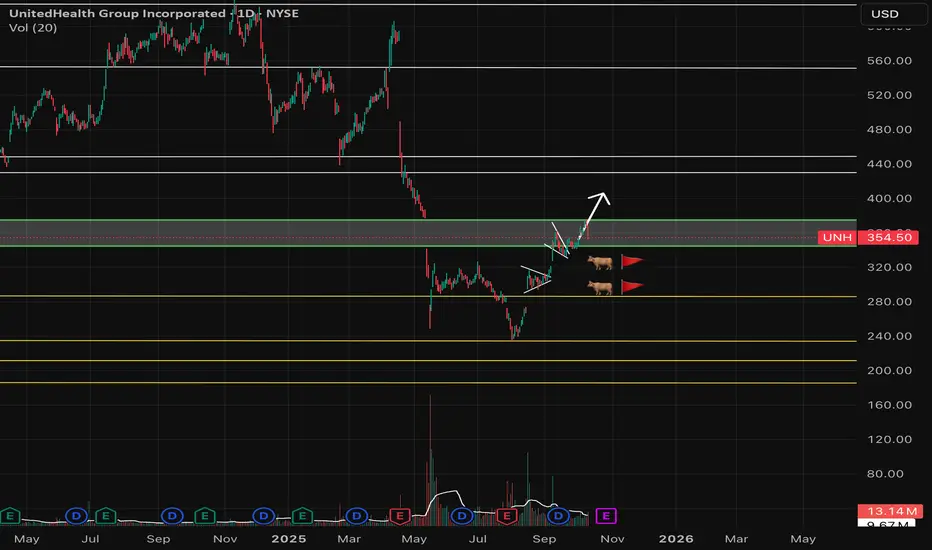
UNH Momentum Play ¦ MA Breakout + Structure Aligning for Bullish📈 UNH – UNITEDHEALTH GROUP INC. (NYSE) | Swing Trade Profit Playbook 🟢
🧠 Trade Thesis
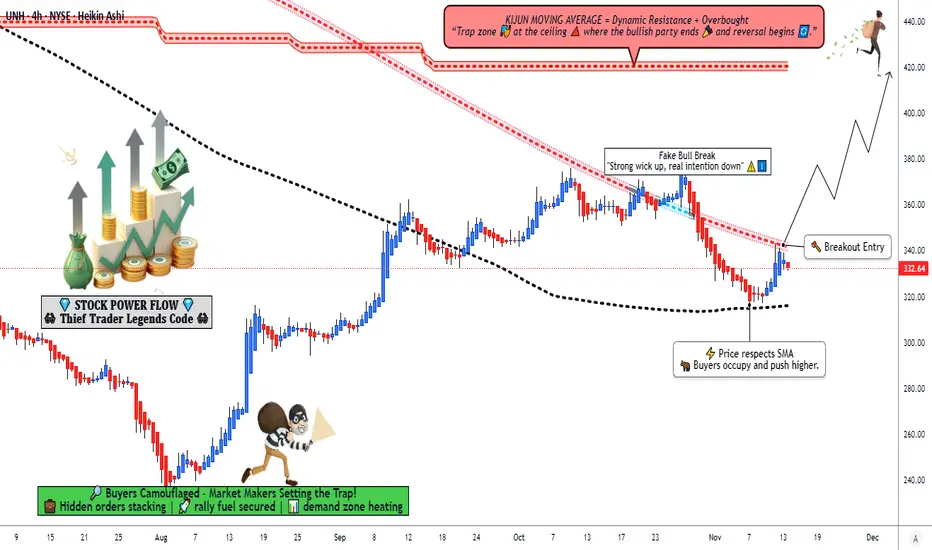
UNH is building momentum after clearing major pressure zones, and the chart structure hints at a bullish continuation once price powers above the breakout zone. Trend strength + MA positioning + momentum shift = a clean technical setup for swing traders. ⚡📊
🚀 Trade Plan (Bullish Breakout Play)
🔓 Breakout Entry Zone
Primary Entry: Above $340.00 breakout level
OR: Any price after a clean MA breakout confirmation 🔥📈
(Whichever comes first with volume is valid.)
🛑 Stop-Loss (Thief SL)
SL: $300.00
💬 "Dear Ladies & Gentlemen (Thief OGs), I’m NOT recommending you copy my SL blindly. Entry & SL are your own choice — you make money, you take money at your own risk." 😎🔐
🎯 Take-Profit Zone
Targeting $420.00
Why?
Kijun Line acting as strong resistance
Overbought conditions aligning
Likely bull trap zone → perfect place to escape with profits 🏃♂️💨💰
💬 "Dear Ladies & Gentlemen (Thief OGs), TP is YOUR choice too — this is just my map. Manage your bag wisely." 😉
📌 Additional Market Notes
Kijun MA = heavy ceiling.
Price currently sitting in a trap-prone region, so trade execution timing matters.
Breakout confirmation + sustained volume = stronger conviction.
🔍 Related Pairs / Correlations to Watch
These assets often reflect broader US healthcare / insurance sector flows or large-cap market sentiment:
NYSE:CVS – Healthcare services correlation; weakness/strength often echoes UNH structure.
NYSE:HUM – Similar managed-care trend behavior; watch for sector rotation.
NYSE:ELV – Moves in tandem with medical insurance majors; confirms sector direction.
AMEX:SPY – Large-cap market momentum; strong SPY = supportive wind for UNH.
AMEX:XLV – Healthcare ETF; acts as a sector-strength indicator.
Key Point:
If AMEX:XLV & AMEX:SPY are trending bullish while $HUM/ NYSE:ELV ** show momentum, UNH breakout continuation becomes more reliable. Sector rotation → strong confirmation tool. ⚖️📊
✨ “If you find value in my analysis, a 👍 and 🚀 boost is much appreciated — it helps me share more setups with the community!”
Disclaimer: This is thief-style trading strategy just for fun. 🕵️♂️💸
#UNH #SwingTrade #NYSE #BreakoutStrategy #ThiefStrategy #HealthcareStocks #StockMarket #TechnicalAnalysis #MomentumTrading #TrendTrading #Investing #TradingView
Long Position Thesis: UnitedHealth Group (UNH)UnitedHealth Group (UNH) represents one of the most fundamentally solid long setups in the market right now. The company operates in both the insurance and healthcare services sectors through its UnitedHealthcare and Optum divisions, giving it a diversified revenue base that performs well across economic cycles. As the largest health insurer in the U.S., UNH consistently delivers strong earnings, cash flow, and dividend growth—characteristics that attract institutional investors during both bull and bear markets.
The broader macro environment supports a long bias. With rate cuts expected in 2026, capital will likely rotate from high-growth technology names into stable, cash-rich companies that can compound earnings in lower-rate environments. Healthcare is a prime beneficiary of that rotation. UNH, in particular, stands out because it provides predictable growth and resilience even when economic data fluctuates. Lower interest rates also help reduce borrowing costs and improve margins in Optum’s data and health services units

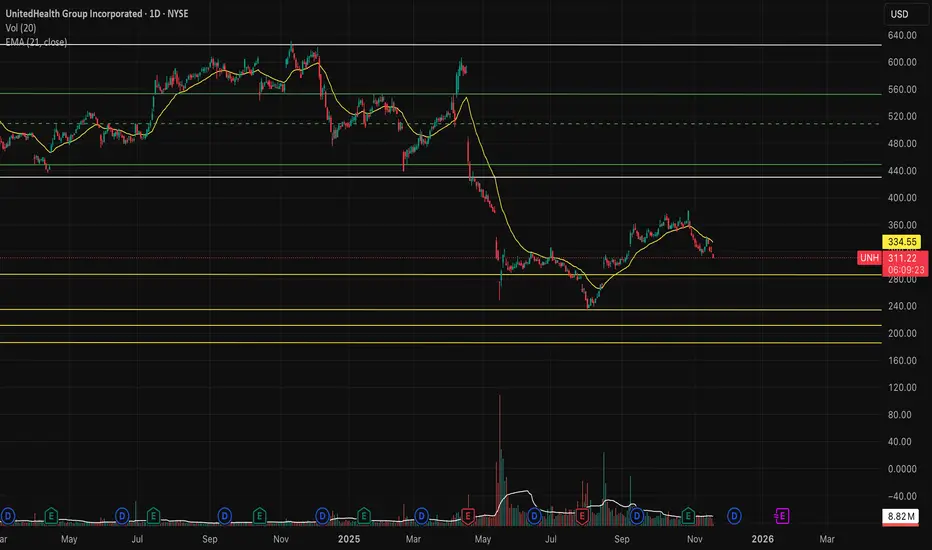
UNH testing support. Next level $290.UNH is testing support level here and if we break the $315, we can continue lower down to $290.

UNH (UnitedHealth Group) Bullish Reversal Setup Long Lim PendingUnitedHealth Group (UNH) is displaying a clear **bullish reversal pattern** following a period of downside correction within a descending channel. Current price action suggests **accumulation** within a 45-minute **demand zone** overlapping a **bullish fair value gap (FVG)** — an area where institutional buying interest typically re-enters the market.
A **long limit order** is positioned at this confluence zone to capture the next leg higher as order flow transitions bullish. Price has reclaimed short-term structure and may target liquidity resting above the 324–328 region.
### **Trade Plan Overview**
* **Asset:** UNH (UnitedHealth Group Inc.) – NYSE
* **Market Cap:** Mega-cap
* **Trade Direction:** Long (Buy Limit – Pending Order)
* **Entry:** 316.33
* **Stop Loss (SL):** 313.88
* **Primary Take Profit (TP1):** 324.10
* **R-Multiple:** 3.17
* **Position Type:** Swing / Intraday Continuation
### **Take Profit Management Plan**
**TP1 – Conservative Target:**
* **324.10** → Key short-term liquidity pool and prior structural resistance.
* Suitable for **scalpers/intraday traders** seeking to secure profits at the first sign of exhaustion.
**TP2 – Extended Target:**
* **327.50 – 328.80 zone** → Next liquidity cluster aligned with the **premarket resistance** and **channel midline**.
* Ideal for **swing traders** holding for continuation and structure expansion.
**TP3 – Position/Runner Target:**
* **335.00** → Major liquidity sweep area; aligns with a potential higher-timeframe fair value gap fill.
* Suitable for **position traders** or those trailing stops to capture the larger structural move.
> **Execution Note:**
>
> * Consider partial profit-taking at TP1, trail the stop to breakeven, and let the remainder run toward TP2/TP3.
> * Manage risk dynamically: once price breaks above 324.30, watch for potential re-entry or add-on setups on smaller timeframes.
### **Technical Confluence**
* Bullish FVG + Demand Zone overlap (institutional buying footprint).
* Short-term market structure break (BMS) confirming reversal intent.
* Volume accumulation building above 316 handle.
* Liquidity resting above 324.30 acting as a magnet for continuation.
### **Institutional Bias**
* **Macro Bias:** Neutral-to-Bullish
* **Structure:** Accumulation → Expansion
* **Sentiment:** Improving as market reclaims key levels
* **Volatility Outlook:** Moderate; aligned with broader healthcare sector rotation

Insider Activity QuantSignals AI Tracker 2025-11-07Insider Activity QuantSignals AI Tracker 2025-11-07
🔍 INSIDER ACTIVITY DETECTED - FOLLOW THE SMART MONEY
AI Analysis of Corporate Insider Buying Patterns
════════════════════════════════════════════════════════════════════════════════
💰 INSIDER ACTIVITY SIGNALS
Generated: November 07, 2025 at 12:37 AM
════════════════════════════════════════════════════════════════════════════════
📊 5 Total Opportunities • ✅ 2 Ready to Trade • ⏸️ 3 Monitor
────────────────────────────────────────────────────────────────────────────────
┌─ #1 ✅ NYSE:UNH • Score: 75/100 • ENTER NOW
│
│ 📅 DTE: 90-180 days
│ 🟢 Risk Level: Low Risk (3/10)
│
│ 📰 Catalyst: 5 txns, 5 insiders, $31.6M total, 0 in 30d
│ 📊 Setup: Large purchases: $31.6M total value - significant skin in game
│ 🎯 Target: 10-20% upside in 3-6 months (moderate insider signal)
│ 📈 Options: CALL options 3-6 months out for insider momentum
│
│ 💡 Trade - Solid insider signal
│ ⚠️ Risk: Insider buying is leading indicator, not guarantee - monitor fundamentals
└───────────────────────────────────────────────────────────────────────────────
┌─ #2 ✅ NYSE:LLY • Score: 65/100 • ENTER NOW
│
│ 📅 DTE: 90-180 days
│ 🟡 Risk Level: Medium Risk (4/10)
│
│ 📰 Catalyst: 8 txns, 8 insiders, $4.5M total, 0 in 30d
│ 📊 Setup: Insider accumulation pattern developing
│ 🎯 Target: 10-20% upside in 3-6 months (moderate insider signal)
│ 📈 Options: CALL options 3-6 months out for insider momentum
│
│ 💡 Trade - Solid insider signal
│ ⚠️ Risk: Insider buying is leading indicator, not guarantee - monitor fundamentals
└───────────────────────────────────────────────────────────────────────────────
┌─ #3 ⏸️ NASDAQ:TSLA • Score: 35/100 • WAIT
│
│ 📅 DTE: 90-180 days
│ 🟡 Risk Level: Medium Risk (6/10)
│
│ 📰 Catalyst: 1 txns, 1 insiders, $1000.0M total, 0 in 30d
│ 📊 Setup: Large purchases: $1000.0M total value - significant skin in game
│ 🎯 Target:
Image
5-15% upside in 3-6 months (developing insider signal)
│ 📈 Options: CALL options 3-6 months out for insider momentum
│
│ 💡 Watch - Developing insider interest
│ ⚠️ Risk: Insider buying is leading indicator, not guarantee - monitor fundamentals
└───────────────────────────────────────────────────────────────────────────────
┌─ #4 ⏸️ NASDAQ:OPEN • Score: 35/100 • WAIT
│
│ 📅 DTE: 90-180 days
│ 🟡 Risk Level: Medium Risk (6/10)
│
│ 📰 Catalyst: 2 txns, 2 insiders, $2.8M total, 0 in 30d
│ 📊 Setup: Insider accumulation pattern developing
│ 🎯 Target: 5-15% upside in 3-6 months (developing insider signal)
│ 📈 Options: CALL options 3-6 months out for insider momentum
│
│ 💡 Watch - Developing insider interest
│ ⚠️ Risk: Insider buying is leading indicator, not guarantee - monitor fundamentals
└───────────────────────────────────────────────────────────────────────────────
┌─ #5 ⏸️ NASDAQ:AVGO • Score: 25/100 • WAIT
│
│ 📅 DTE: 90-180 days
│ 🔴 Risk Level: High Risk (7/10)
│
│ 📰 Catalyst: 1 txns, 1 insiders, $1.2M total, 0 in 30d
│ 📊 Setup: Insider accumulation pattern developing
│ 🎯 Target: 5-15% upside in 3-6 months (developing insider signal)
│ 📈 Options: CALL options 3-6 months out for insider momentum
│
│ 💡 Watch - Developing insider interest
│ ⚠️ Risk: Insider buying is leading indicator, not guarantee - monitor fundamentals
└───────────────────────────────────────────────────────────────────────────────
────────────────────────────────────────────────────────────────────────────────
📖 QUICK GUIDE:
✅ ENTER NOW → High probability setup, optimal timing, low-medium risk
⏸️ WAIT → Monitor for better entry or catalyst resolution
🟢 Low Risk → Heat 1-3 (stable, far from catalysts)
🟡 Med Risk → Heat 4-6 (moderate volatility)
🔴 High Risk → Heat 7-10 (near catalysts, high volatility)
💎 Position Sizing: 2-5% per trade • Max 2-3 concurrent positions
🎯 Exit Strategy: Take profit at 50% max gain or stop at 2x loss
════════════════════════════════════
════════════════════════════════════════════

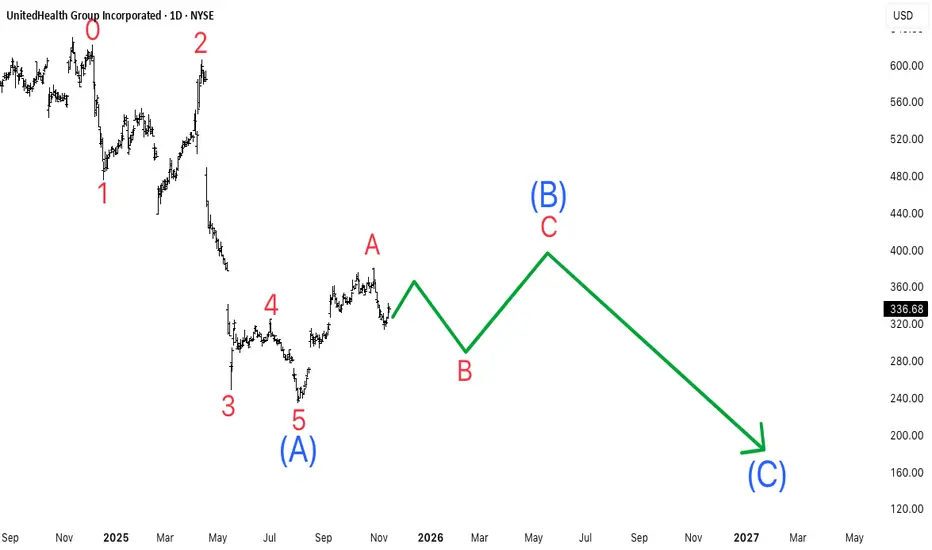
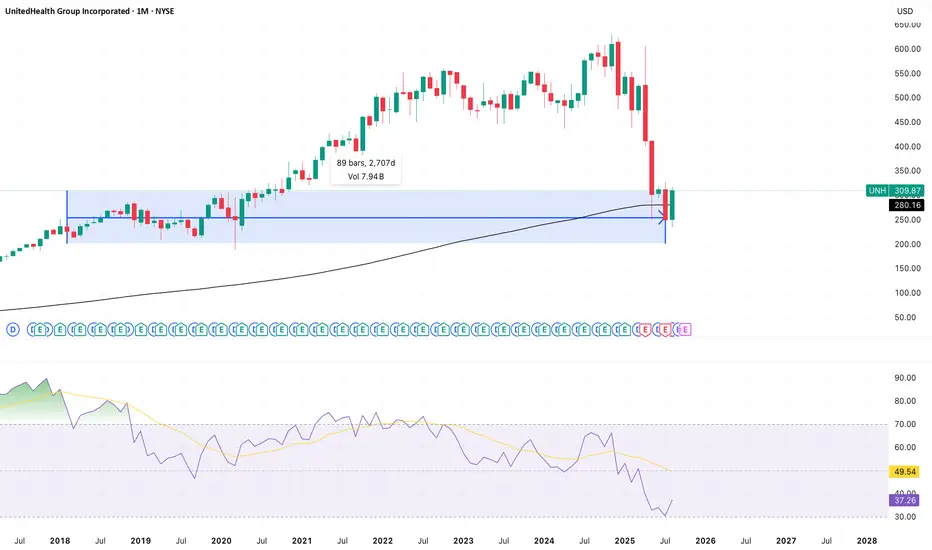
Crashed 61.8% from ATH, after making series of bullish waves.In my opinion, UNH is making overall correction of its huge bullish trend in past couple of decades. It has touched the 61.8% of overall bullish trend. Is that it or is it just wave-(A) of three wave zigzag correction?
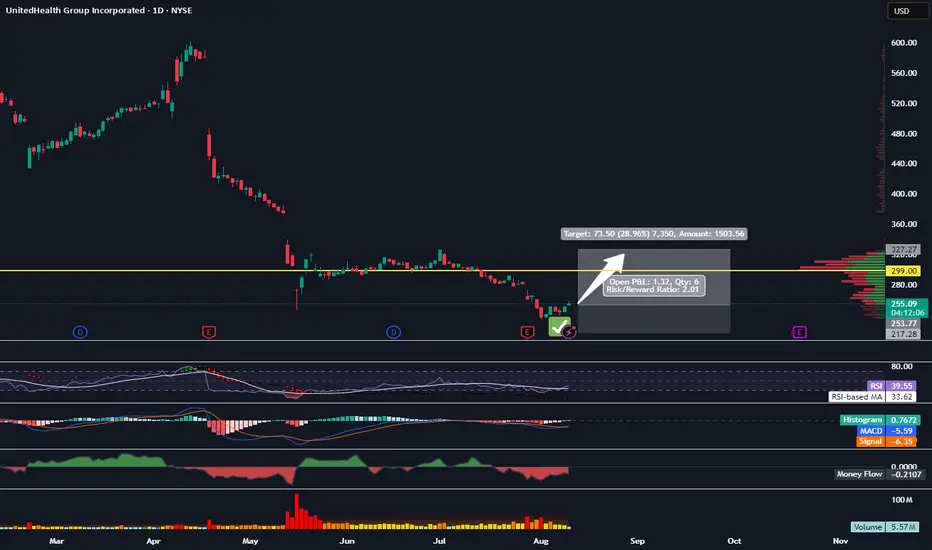
Entering UNH HereTrading Fam,
I'm not going to go into a long exposé about how great the technicals are here because, truthfully, they are not great. In fact, there is relatively little that supports any kind of entry here other than the fact that this stock is extremely oversold. Really, the only reason I even considered an entry here is that my indicator has given me a buy. If you have been following me for any length of time, you know that this thing is knocking it out of the park in stocks. But to keep it safe, I am entering a 1:2 long rrr, shooting for $327 with a $217 SL. Let's see if my little indicator can keep its amazing win streak going even without a lot of technicals to support it.
✌️Stew

UNH ready to FLY? Double Golden LaunchPad the ideal BOTTOMUNH trying to paint a bottom thanks to Buffet et al
Break-n-Retest of Double Golden zone $287.91-296.92
This could be a once-in-a-lifetime bottom for this stock.
See "Related Publications" for Previous Analysis
.

UNH set to breach 430$ in the near termNYSE:UNH UnitedHealth Group Incorporated (UNH) is showing all the technical and fundamental signs of a major bullish reversal. After a steep decline, the weekly chart has now triggered a powerful signal: the 9-period Simple Moving Average (SMA) has crossed above the 20-period SMA, confirming short-term momentum and marking the start of a new uptrend.
This crossover, highlighted in the chart, historically precedes large moves higher, especially when supported by rising trading volume and positive company developments. What’s even better, UNH just released robust earnings that beat market expectations, demonstrating the company's resilience and growth potential even in challenging environments. Q3 revenue reached $113.2 billion, a 12% year-over-year increase driven by double-digit growth in both UnitedHealthcare and Optum segment
Technically, there’s a clear path towards the near-term resistance around $436, and a break above this level could open the door for a run back to previous highs near $487. With a recovery in fundamentals and a high-probability technical setup, UNH now has the potential to deliver gains of over 40% from current prices—backed by both chart dynamics and a strong earnings trend.

Breaking: UnitedHealth Group Incorporated (UNH) Up 4% PremarketThe share price of UnitedHealth Group Incorporated (NYSE: NYSE:UNH ) is up 4% in Tuesday's premarket session as the company reports earnings results 28 October, 2025 before the bell.
UnitedHealth Group raised its 2025 earnings outlook to reflect net earnings of at least $14.90 per share and adjusted net earnings of at least $16.25 per share.
Third Quarter 2025 Key Performance Metrics
Consolidated revenues of $113.2 billion, up 12% year-over-year.
Earnings from operations were $4.3 billion; net margin of 2.1%.
Adjusted EPS of $2.92; GAAP EPS of $2.59.
Medical care ratio (MCR) of 89.9% was in line with expectations outlined in the second quarter 2025.
Operating cost ratio of 13.5% reflecting investments to support future growth.
UnitedHealthcare revenues grew 16% year-over-year to $87.1 billion, driven by growth in Medicare & Retirement and Community & State; UnitedHealthcare served 50.1 million consumers domestically, up 795,000 year-over-year.
Optum revenues grew 8% year-over-year to $69.2 billion, driven by growth in Optum Rx.
September 30, 2025, debt-to-capital ratio of 44.1% unchanged from the second quarter 2025 and inclusive of the impact of closing the Amedisys transaction on August 14, 2025.
Technical Outlook
With the RSI at 58, NYSE:UNH is poised to break the $381 resistant zone paving the way for a much more greater strides. Similarly, on a more bullish tone, the stock's moving averages have cross paths indicating possible resurgence of a golden cross.

UNH - Weekly Long Strong Trend Line being retested
I expect as bounce off this trend line as price history extends back quite a long time.
Good dip buy long option.
Weekly chart.

$UNH breakout continues; Next leg $400-450 range!- NYSE:UNH offers best risk to reward for 2026
- Increase in premium is going to kick off starting 2026
- All these revisions by analyst would be easy to beat.
- NYSE:UNH has been eating up the shares when it was beaten down should also boost eps
- Technically, breakout -> consolidate -> breakout is more sustainable. Good luck everyone!

UNH: Bounce or Breakdown? Watch This LevelLooks like the buyers are stepping in — short covering? Dead cat bounce? Or real value buyers?
Time will answer that, but here’s what we do know: the stock is trading at the same levels it did when it was earning half as much.
All the investigations and allegations? Priced in.
But here’s the kicker: why is UNH leading the gainers in the Dow when the Dow itself is red? If it holds here and pops a few points, we might see a real run.
⚠️ Caution: This is a high-volatility name.
If you’re still learning, use stops, stay small — or better yet, just paper trade and pay with your time, not your capital. 😉
#unh #unitedhealthcare
UNH | Oversold Giant Setting Up for a Rebound?📰 What’s happening?
UnitedHealth ( NYSE:UNH ) just made headlines after Berkshire Hathaway disclosed a multi-billion stake, fueling one of the stock’s strongest single-day rallies in years. This comes on the back of months of selling pressure tied to the DOJ probe, CEO changes, and suspended guidance.
Now, the question is: Was that the bottom, or just a pause in the storm?
📉 Trade Setup (Swing Idea)
🟢 Entry Zones
$304 (current level – speculative buy)
$280 (support zone)
$250 (deep pullback entry)
🎯 Profit Targets
TP1: $325 (short-term resistance)
TP2: $340
TP3: $355
📌 Takeaway
This is a high-risk, high-reward swing trade. Oversold conditions and Buffett’s backing could drive a rebound toward $325–$355, but legal and regulatory risks remain a heavy cloud. Manage position size and keep stops in place.
⚠️ Disclaimer: This is not financial advice. Trading involves risk. Do your own research and use proper risk management

$UNH has nothing to do with China-US trade war.- NYSE:UNH has nothing to do with China-US trade war because all of its business is in US.
- Companies which will get hurt by China - US tensions would be MNCs ( multi national companies) , Chips related companies, Retail like clothing, beauty products and some healthcare which get raw materials from the china for drug.
- Insurance related companies should do well amidst this macro development.
- NYSE:UNH selling on china related trade war is so stupid and I believe it's algorithmic selling but once institutional investors and fund managers come back to senses.
- They should consider parking money in NYSE:UNH for safe compounding amidst this new macro shenanigan.
- NYSE:UNH is still undervalued, defensive & doesn't have any exposure to US-china trade wars.
- NYSE:UNH is increasing rates for premium starting 2026 that's one more big tailwind.
Bearish Divergence Signals Further DownUNH is still grinding down after making a lower high, lower low, and forming bearish divergence. Possible support is marked via fibs

$UNH Call Alert – Oct 31 ’25 $375 Calls | 107% ROI PotentialEnter: NYSE:UNH OCT 31 2025 $375 CALLS
Buy in Price: $15.75 - $15.90
Take Profit: $32.60
Stop Bleeding: $13.86
ROI Potential: 107%
Exit Within: 255 Minutes

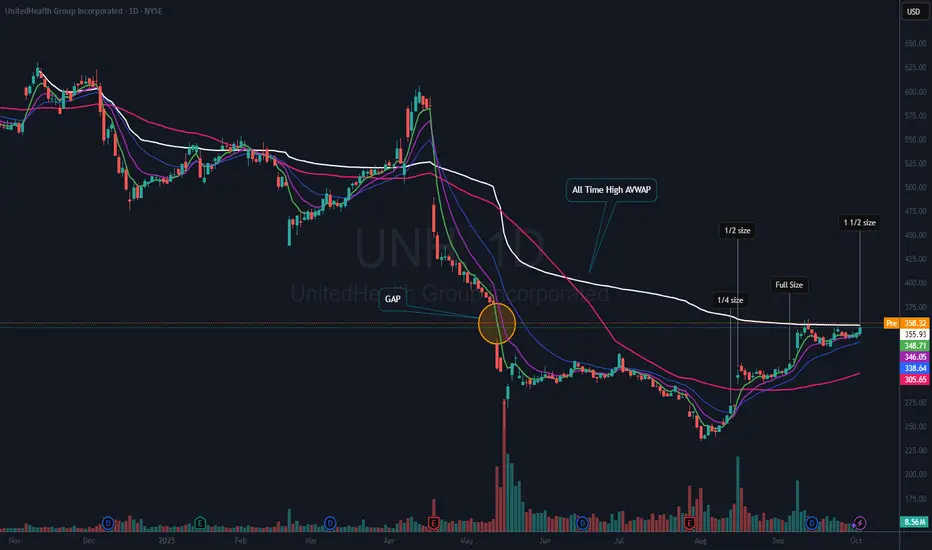
$UNH Testing All-Time High AVWAPNYSE:UNH is currently testing its All-Time High Anchored Volume Weighted Average Price (ATH AVWAP), while simultaneously forming what appears to be a flat base. In pre-market trading today, the stock price has moved above the AVWAP, potentially indicating reduced overhead resistance and the possibility for continued upward momentum.
Position and Strategy
I initiated a position in NYSE:UNH on August 13th and have steadily increased my holdings up to and including yesterday. As the stock approaches a critical juncture, there is potential for it to continue rallying, especially with earnings scheduled to be announced in 25 days.
Analyst Ratings and Price Targets
The consensus among analysts is generally positive for NYSE:UNH , with 16 rating it as a buy or strong buy, 7 assigning a hold rating, and 3 recommending a sell. The highest 12-month price target currently stands at $440.
Future Plans
If NYSE:UNH can move above the $362 level, I plan to further increase my already oversized position, as this would present a compelling opportunity to at least fill the gap.
UNH UnitedHealthNYSE:UNH UnitedHealth just broke above the downtrend resistance today and looks set to close over that line — a strong setup. From here, price could push higher tomorrow, or we might see a retest of the downtrend line, which now flips into support. The next target sits at the $378 gap-fill, as long as sentiment stays positive and no negative headlines hit the tape.

UNH - Bottom formed - Ideal entry levelsUNH recently bottomed and may be retracing into a last opportunity before it continues upwards. A follower had asked me about this stock so I thought others might be interested.
May the trends be with you.
