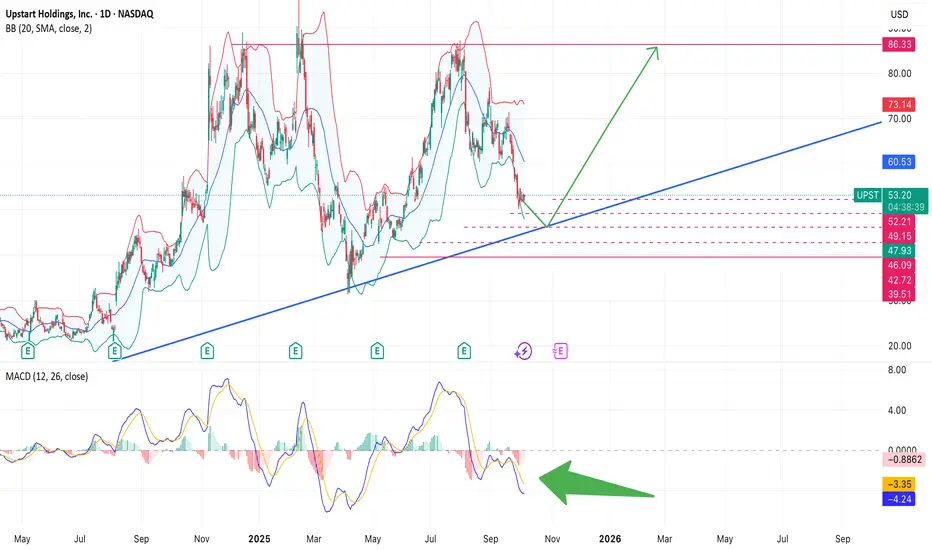
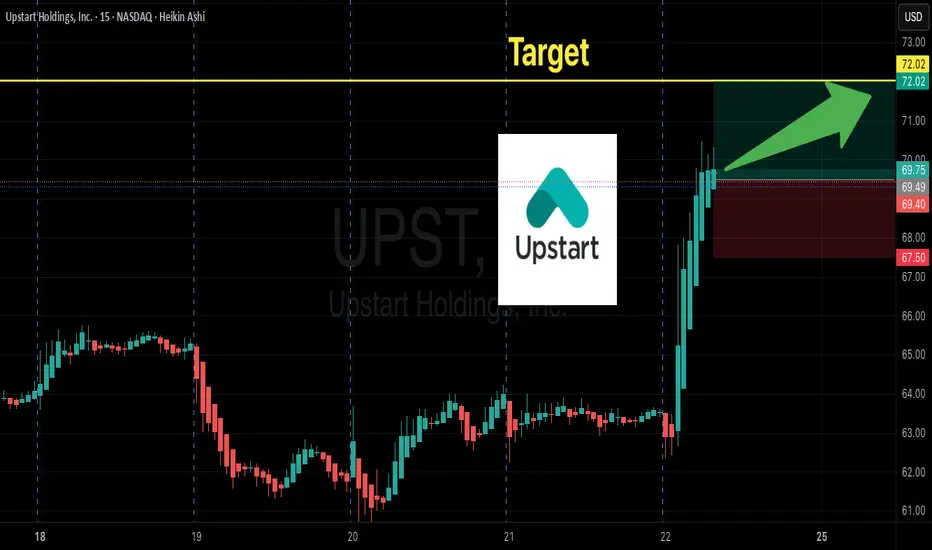
$UPST- A Black Friday SpecialUpstart chart is simple.
Channel held. Interest rates will continue to fall and will increase Upstart revenue. The effects of the interest rates will lag so it will take 3-6 months for the stock to reflect in price.
Targets:55,87, and 112
Time to final target: end of Q1 2026/ early Q2 2026
#SPY #QQQ #interestrates #financial
Trade ideas

$UPST Daily: Watching for a Trend Reversal BreakoutUPST is approaching a major technical inflection point as it rallies back to test a long-standing descending trendline that has defined the downtrend since the $87 peak. The recent bounce from the mid-$30s shows improving momentum, but the stock now sits directly at trendline resistance around $47, where price will either break out and signal a potential trend reversal or face rejection and continue its downward structure. Volume has begun to increase, suggesting early accumulation, and the next move from this level will likely determine whether UPST targets the $50–$52 resistance zone or pulls back toward the low-$40s.

Upstart UP? Or a FI-like crash?If FI didn't get absolutely smoked this week, and earnings next week I'd absolutely be buying here. However, "new finance" and fintech seems to be getting hit hard this month. So with earnings coming up, I'm not going to buy this stock, but I'm tempted to buy a call option.
Going back to the weekly chart, UPST is really close to hitting it's lower upward trendline which is somewhere around 40.
The current price is 46.
The 200 day moving at about 66 (20pts up)
The upper downward trendline (triangle forming) is at about 80. That's a lot of room to move, and a call option seems like limited risk/reward.
On the daily chart, it's currently falling in a falling wedge.
It looks like the perfect scenario for a swing trade.
I'll look at call options on open and update if I initiate a trade.

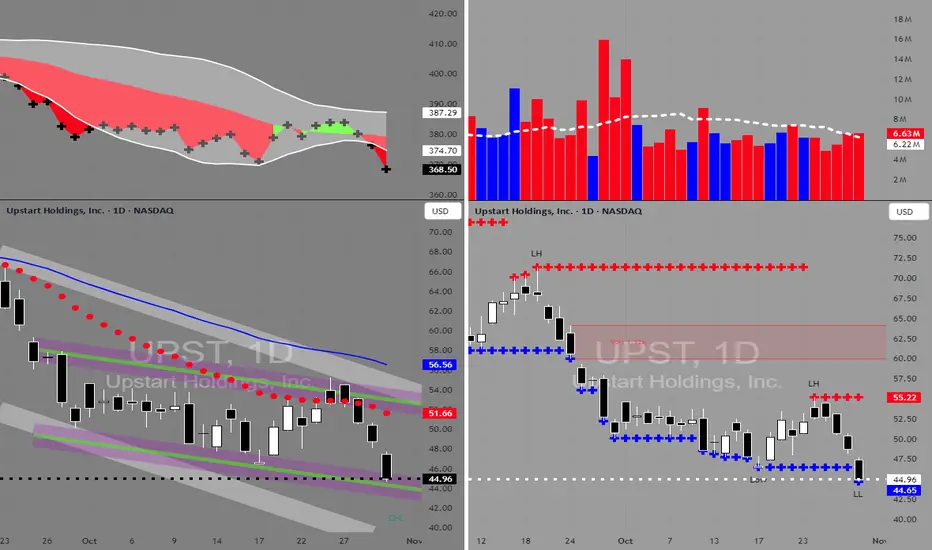
UPST in BUY ZONEMy trading plan is very simple.
I buy or sell when at either of these events happen:
* Price tags the top or bottom of parallel channel zones
* Money flow volume spikes beyond it's Bollinger Bands
So...
Here's why I'm picking this symbol to do the thing.
Price in buying zone at bottom of channel
Money flow momentum is spiked negative and under bottom of Bollinger Band
Entry at $44.95
Target is upper lower channel around $52
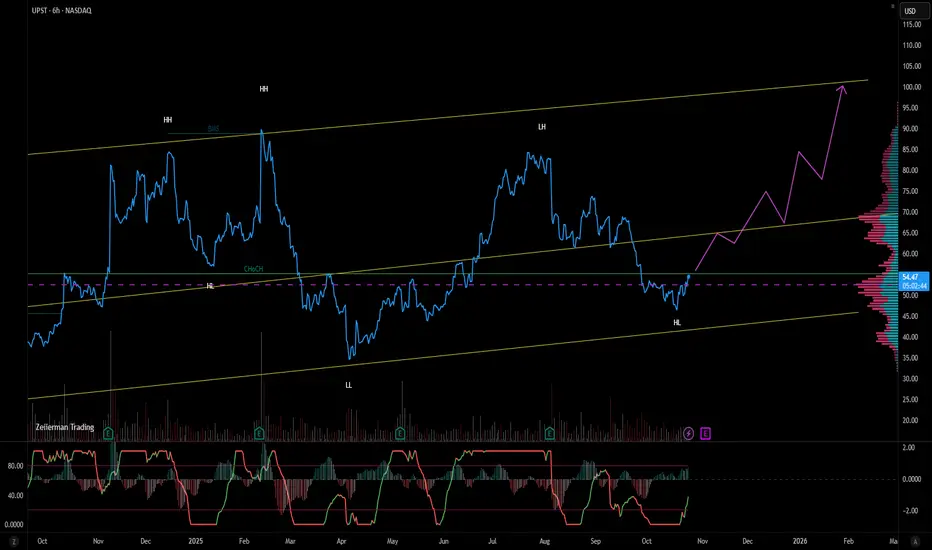
UPST, follows all trendsIn sequence,targets 65,85 and 100. As in the backward movements generally follows the trend lines and the support and resistance levels.
UPST next big move up! TA: Oversold!
FA: More Rate cuts coming!
Federal Reserve Chair Jerome Powell said the central bank is nearing a point where it will stop reducing the size of its bond holdings, but gave no long-run indication of where interest rates are heading.
Why it tagged 51.01 today.Great support from the April lows. I think we have found a a short term bottom here. Potential upswing to 60 here.
$UPST — Ready for a Trendline Rebound?Upstart Holdings ( NASDAQ:UPST ) is once again testing its long-term ascending trendline
The price is hovering near a key support zone around $49–50, where buyers have stepped in before.
NASDAQ:UPST Bullish scenario:
If support holds — a rebound toward $60 → $70 is possible, matching the mid-Bollinger band and prior resistance area.
Bearish scenario:
A breakdown below $49 could open the way to $46–42, where previous accumulation took place.
Technical setup:
The price is near the lower Bollinger Band, hinting at a potential reversal zone.
MACD is close to its historical lows:
Statistically, when MACD reached similar levels (in Dec 2024 and Mar 2025),
NASDAQ:UPST rallied 30–50 % within the next 2–4 weeks.
The long-term trend remains upward since early 2024.
Bottom line:
NASDAQ:UPST is at a decision point — if the pattern repeats, current levels could mark the start of a new bullish wave.
UPST upstartUpstart is holding firmly on a long-term uptrend line that’s been in play for about a year. This green line has acted as reliable support, and we’re now seeing the third straight day of stabilization on it — a strong signal that higher levels may be coming. Looking at the volume shelf, there isn’t much heavy resistance until around 62, so price has room to move up toward 62–63 fairly easily. As long as sentiment on both Upstart and the broader market remains positive, upside toward those levels looks likely. Follow me on X Enginv777
Upstart maybe stage 2 begins now...NASDAQ:UPST has been in stage 1 basing pattern since 2022 and now showing multiple bullish signs listed here:
* Weekly inverse head and shoulder
* Daily flag just above MA cluster
* Potential daily double bottom
* Rate cuts
all this is happening as UPST is just under the top of the basing range
let's see...

UPST | Upstart Bullish Pennant SetupUPST is consolidating within a bullish pennant pattern, setting up for potential continuation higher.
Catalysts to watch in the next 2–3 months:
- Q3 2025 Earnings (early Nov): Strong revenue and profitability growth expected based on recent momentum.
- Partnership Expansion: New collaborations with credit unions (Cobalt, Cabrillo) should boost loan origination volume.
- New Verticals: Rapid growth in auto loans and HELOC markets, both with significant long-term potential.
These catalysts support the technical setup and could drive bullish momentum into year-end.
NFA
UPST: Bottom?UPST:
.
Bottom?
Many key support here, with less supply volume.
.
US STOCKS- WALL STREET DREAM- LET'S THE MARKET SPEAK!

UPST Ready to Rip? | $77C Swing Setup
# 🚀 UPST Swing Trade Idea | \$77C Sept 5 | Momentum Setup 💎
📊 **Bias**: Moderately Bullish (5–10d swing)
✅ Short-term trend +9.1% (5d)
✅ RSI rising + low VIX (\~14)
✅ \$77C flow = institutional activity (1681 vol / 1565 OI)
⚠️ Weak link = no volume breakout yet (1.0x avg)
---
### 💡 Trade Setup
* 🎯 **Instrument**: UPST
* 🔀 **Direction**: CALL (long)
* 💵 **Strike**: 77.00
* 📅 **Expiry**: 2025-09-05 (11d)
* 💰 **Entry**: 0.97
* 🛑 **Stop**: 0.58
* 🎯 **Targets**:
• +50% = \$1.46 (scale)
• +100% = \$1.94 (final)
---
### ⚡ Risk Notes
* Keep size **small** (1 contract, \~1–2% risk)
* **Theta risk** → must move fast, exit early if no vol pickup
* News tape can flip momentum fast
---
🔥 **Consensus**: Multi-model majority = Buy \$77C now for a 5–10 day swing. Small, tight, and momentum-dependent.
---
### 📌 Tags
\#UPST #OptionsTrading #SwingTrade #Bullish 📈🚀🔥
Mid-Week SPX Check, Another Wait & See Moment!TLDR...or TLDW ;)
If SPX holds above the 20 EMA and reclaims that short-term uptrend, this could have been just be another orderly pullback in a rising market.
If it crosses back under the 20 EMA and closes below, I’d watch for a move toward the 50 SMA (about 6,255).
My stocks, the indices (Dow, Nasdaq, SPX), were met with buyers midday, and even if we roll over, that is expected.
My hourly charts on my trading list do show potential setups for my retest strategy (similar to how you'd trade a pullback on a run up), and I'd like to see the market follow through with weakness as a whole.
So we wait.
Cheers,
Emanuela

UPST Call Setup — Momentum Heating Up!🚀💎 UPST Swing Trade Alert — Call Setup for Quick Gains!
📊 Consensus Recap
✅ Momentum: Short-term bullish (5–10 day)
⚠️ Volume: Weak → caution needed
📈 Sentiment: Mixed but leaning bullish
🎯 Trade Setup
🔀 Direction: CALL (LONG)
🎯 Strike: $72.00
💵 Entry: $2.60
🎯 Profit Target: $4.50
🛑 Stop Loss: $1.70
📅 Expiry: 2025-09-05
📈 Confidence: 65%
⏰ Timing: Market Open
UPST Possible Cup & Handle BreakoutI'm watching NASDAQ:UPST for a potential breakout from the Handle portion of a the Cup& Handle pattern. Feds are closer to lowering rates which have held down this stock. I will enter Call options to $100 if we close above the Handle resistance line.

UPST –61.5 Support Holding, Watch Reclaim of 68.6 → 77.3 → 91.4Summary
Upstart (UPST) delivered a strong earnings beat: EPS surprise +41% ($0.36 vs $0.254 est.) and revenue surprise +14% ($257M vs $225M est.). Despite the beat, the stock sold off into a key support zone (61–63). Technically, UPST is forming a Cup & Handle pattern on the weekly chart. The current pullback may represent the “handle” phase, setting up for a continuation toward the previous high 91.4.
🔍 Technical Analysis
Cup & Handle:
Cup formed between $31.6 and $91.4.
Handle in progress, with price retesting Fib 0.5 (~$61.5) and rising trendline.
Fibonacci Levels (31.6 → 91.4 move):
0.236 = $77.3 → major resistance/handle breakout trigger.
0.382 = $68.6 → must-reclaim level to flip back bullish.
0.5 = $61.5 → current support + trendline.
0.618 = $54.5 → next support if $61 fails.
Indicators:
RSI cooled to ~40, watch for rotation upward on reclaim of $68.
MACD still red but flattening, potential for bullish cross if bounce confirms.
Stochastics oversold, primed for reversal.
Volume: Pullback volume lighter than earnings spike = constructive for a re-accumulation handle.
🎯 Trade Setup
Scenario A – Reversal from Support (higher risk, better R:R):
Entry: $63–61 with confirmation (higher lows, intraday reversal).
Stop: < $59.5 (below Fib 0.5 & trendline).
Targets: T1 $68.6, T2 $74, T3 $77.3.
Scenario B – Confirmation Breakout (conservative):
Trigger 1: Daily close > $68.6 with volume ≥ 1.5× 20D avg.
Trigger 2: Weekly close > $77.3 (handle breakout).
Stop: below reclaimed level (e.g., < $66.8 after $68.6 reclaim).
Targets: T1 $77.3, T2 $84–86, T3 $91.4 (prior high), T4 $98–102 (Fib ext).
Invalidation: Weekly close < $61.5 weakens the bullish Cup; below $54.5 negates the setup.
📈 Fundamental Context
Earnings: Beat on EPS (+41%) and revenue (+14%) supports the bull case.
Macro Sensitivity: Business tied to credit cycles and interest rates. Stabilizing/declining rates and stronger securitization = tailwinds. Rising defaults or tighter funding = risks.
Catalysts: Monitoring partner funding updates, loan volume guidance, Fed policy signals.
✅ Execution Notes
Only take entries on support confirmation or breakout with volume.
Scale out at targets; move stop to breakeven after T1.
Manage size carefully—UPST is high-beta and volatile.
TL;DR
UPST pulled back post-earnings into Fib 0.5 + trendline (~$61.5). If support holds and $68.6 is reclaimed → upside toward 77.3 → 91.4. Break below $61.5 opens risk to $54.5. Constructive Cup & Handle continuation setup, but needs confirmation.

UPST Bear Breakdown Incoming! Put Strike $58
# ⚡ UPST Swing Alert – 2025-08-15 ⚡
**Sentiment:** Moderate Bearish
**Setup:** Put Option Trade
---
## 📉 Market Snapshot
* **Daily RSI:** <45 → Bearish momentum
* **5 & 10-Day Trend:** Negative → Confirmed downtrend
* **Volume:** Avg (1.0x) → Weak breakout confirmation
* **Call/Put Ratio:** 1.00 → Neutral
* **VIX:** Favorable low volatility for controlled downside
---
## ⚖️ Consensus & Conflicts
**Agreement:**
* Bearish momentum confirmed across models
* Structural weakness supported by multi-timeframe negative performance
* VIX favors swing execution
**Disagreement:**
* Timing & execution vary: some models recommend immediate puts, others await volume confirmation or breakdown
* Strike selection differs slightly (\$58 vs \$61)
---
## 🎯 Trade Setup – UPST PUT
**Entry Condition:** Confirm bearish breakdown at market open
**Strike:** \$58.00
**Expiration:** 2025-08-29
**Entry Price:** \$1.00
**Confidence:** 72%
**Profit Target:** \$2.00 (100% gain)
**Stop Loss:** \$0.60 (≈40% of premium)
**Key Risks:**
* Corporate developments (e.g., convertible notes) may alter price direction
* Sudden bullish reversals or volume spikes
---
## 📝 TRADE DETAILS (JSON)
```json
{
"instrument": "UPST",
"direction": "put",
"strike": 58.0,
"expiry": "2025-08-29",
"confidence": 0.72,
"profit_target": 2.00,
"stop_loss": 0.60,
"size": 1,
"entry_price": 1.00,
"entry_timing": "open",
"signal_publish_time": "2025-08-15 16:14:27 UTC-04:00"
}
```
---
## 📊 Quick Reference – TradingView Ready
🎯 **Instrument:** UPST
🔀 **Direction:** PUT (Short)
💵 **Entry Price:** \$1.00
📈 **Profit Target:** \$2.00
🛑 **Stop Loss:** \$0.60
📅 **Expiry:** 2025-08-29
📏 **Size:** 1 contract
⏰ **Entry Timing:** Market Open
🕒 **Signal Time:** 2025-08-15 16:14 EDT
---
### Suggested Viral Title & Tags:
**🔥 UPST Bearish Swing Alert: Put Strike \$58 Ready ⚡**
\#UPST #SwingTrade #OptionsTrading #Bearish #PutOption #Momentum #TradeSetup #TechnicalAnalysis #StockAlerts #Finance #TradingSignals #MarketWatch #ShortTrade

UPST watch $67.57-68.55: Major Support might hold earnings DUMPUPST earnings were apparently not pleasing to the Street.
We got a bull trap then a dump to support zone at $67.57-68.55
Looking support to hold and Break-n-Retest to start adding longs.

Upstart Holdings – Cup Bottom and Ascending Channel Setup📊 General Overview
- The stock is currently trading at $50.07 , showing a -1.79% daily loss.
- The price is moving within an ascending channel (orange dotted lines), suggesting a long-term uptrend.
- A strong rebound since the April 2025 bottom stands out, with a 76.37% rise from lows.
🔍 Chart Patterns & Indicators
🟥 Resistance Zones and Price Targets
- The $55 range (pink zone) is acting as a strong resistance.
- A breakout above this zone may repeat the previous move upward ( $23.84 gain / +41.97% ), targeting the $80 level.
🔻 Reverse Head and Shoulders Recovery Pattern
- The sharp drop and rapid rebound formed a V-bottom, often signaling strong reversals and bullish momentum.
- This is reinforced by increasing higher lows since April.
📈 Ascending Channel
- The price is clearly respecting the ascending channel boundaries.
- The lower orange dotted line acts as dynamic support, while the upper line may - define the next ceiling near $95–100 .
📊 MACD Indicator (Momentum)
- The MACD lines are about to cross upward in the positive region—an early bullish momentum signal.
- However, a yellow warning symbol indicates possible caution due to increased volatility or overbought conditions.
🎯 Strategy & Expectations
- The $50–55 area is a critical resistance zone to watch.
- A successful breakout above $55 could technically extend the move toward $80 .
- Confirmation from MACD and volume spikes would strengthen the bullish case.
- A stop-loss below $45 can be considered if the price gets rejected again at resistance.
Upstart wanna get startedNASDAQ:UPST is ready to go... forming an inverted head and shoulder on the daily and testing the neckline. nuff said

UPST Classic BUMBUM ReversalNASDAQ:UPST Classic Bumbum is a new term and I will probably file copyrights to it 😃
UPST has attempted to breakout of a cup and handle twice on the weekly chart and failed.
The second attempt is extended and recently broke upward from the handle.
The Bumbum simultaneously formed a saucer formation in the process which is a bullish reversal trend.
With increasing volume and momentum and favorable market conditions I expect this to to easily scale the immediate resistance of $59, then to $85. At $85 there is probably a pullback to the $70is range before any catalyst could push it beyond $85 to the $120 range.
With the fundamentals of the company aligning favorably, this is a long term buy.

UPST( Upstart Holdings Inc. ) - Great chance take 10 % ?NASDAQ:UPST 🔹 Current Price: $53.56
🔹 Candlestick Pattern: A candle resembling an inverted hammer has formed — this may signal potential weakness from buyers or a possible reversal after an upward move.
🔹 Technical Channel: The price is moving within an ascending channel. Target level is marked around $59.96 (+10.41% in 6 days).
🔹 Indicators:
• Bollinger Bands show price nearing the upper band, which can indicate overbought conditions.
• Stochastic RSI is approaching overbought territory (>50), suggesting a potential pullback.
🔹 Volume: Volume remains moderate with no significant spikes.
Conclusion:
UPST is showing a short-term bullish trend, but the appearance of an inverted hammer suggests caution. A pullback to the midline of the channel ($50–51) is possible before a potential continuation higher.
