Short VISAHi traders,
Entering a short position in VISA, while below 200 MA.
From fundamental stand point, crypto payments might affect future revenues
I will update idea if scenario changes
My 6 trading rules, audited track record at my signature
1. Never add to a losing position: Avoid averaging down to prevent compounded losses.
2. Don’t be the first to buy low/sell high, and don’t be the last to exit: Avoid trying to nail the exact top or bottom; wait for confirmation.
3. Think like a fundamentalist, trade like a technician: Understand the market context but use technical, price-based rules for entries and exits.
4. Keep your analysis simple: Avoid over-complicating charts to prevent analysis paralysis.
5. Start small and increase exposure when the trend confirms your analysis: Build positions only when the market moves in your favor.
6. The hard trade is the right trade: Often, the trades that feel the most uncomfortable to take (e.g., stopping out, buying at support) are the correct ones, while "easy" trades are emotional traps.
Visa Inc. Shs A Cert Deposito Arg Repr 0.055555555 Shs
No trades
What traders are saying

Visa ($V) just broke down from a one-year range. Further downsidVisa ($V) just broke down from a one-year range.
Further downside looks likely. Why? 👇
• Range break = expansion.
A year-long consolidation builds pressure. The longer the range, the more significant the eventual move tends to be. Breaks from extended ranges often lead to strong follow-through.
• Extended long-term run.
Since the 2009 financial crisis, Visa has appreciated more than 30x without a major structural correction. Moves of that magnitude rarely go uninterrupted forever. Over a 100 years of history you can see that these very extended trends always have an end.
Trade plan:
Stop: $335
Target: $280 zone
Thanks to an attentive member who brought this to my attention, I was able to initiate this short yesterday.


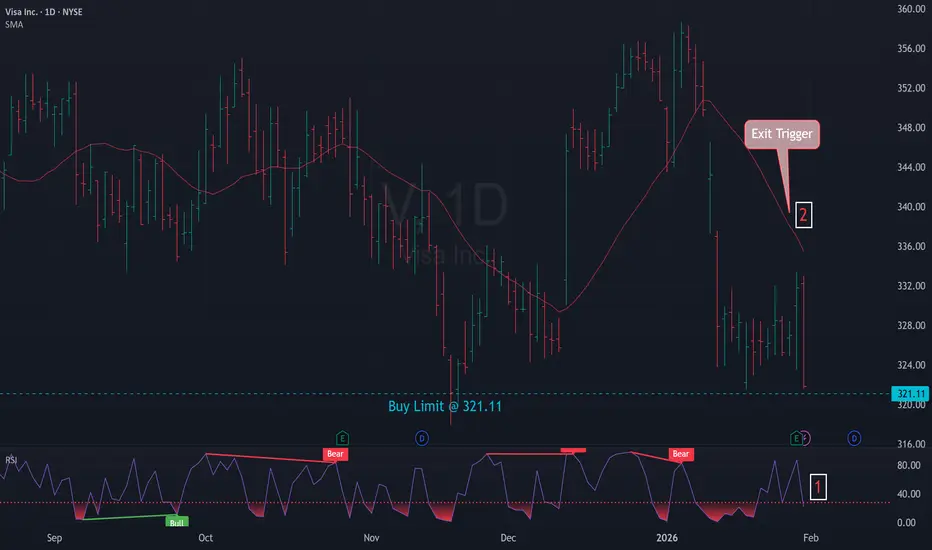
Mean Reversion Setup: V1. RSI in oversold region
2. Price likely to rebound back to the mean
Trade Rules:
Entry Trigger - RSI has cross below oversold region, enter limit buy at close price
Exit Trigger - Close at market when close price cross above exit trigger (Red Line)
Notes: Maximum of 3 open positions
V Earnings Setup — Positive Gamma, Dealer Support Above 330💳 V (Visa) — Earnings Liquidity Playbook
🧭 Market Structure Snapshot
📈 Trend: Higher-timeframe pullback into weekly support + value
🏗 Structure: Acceptance holding above prior weekly lows
⚡ Momentum: SMI curling up from oversold → bullish momentum rebuild
📊 Volume: Selling pressure exhausted, volume stabilizing at support
🎯 Bias: Upside favored while above HVL
🗺 Key Levels (This Is the Map)
🟢 Bullish Control Zone
HVL (Gamma Flip): 327.5
0DTE HVL: 330
➡️ Above this zone = dealers stabilize price → upside expansion favored
🛡 Immediate Support
Primary Support: 326–328
Put Wall / Dealer Defense: 320
⛔ Hard Risk Line: Below 320 = thesis invalid
🚀 Upside Targets (Gamma-Driven)
330-335 → first squeeze zone
340 → major call resistance + gamma wall
345–350 → extension if earnings reaction is strong
🧲 Gamma + Liquidity Read
Gamma Condition: ✅ Positive / Call-Dominated
Net GEX: +10.15M (≈ +87% day-over-day)
DEX Explosion: +1700% → dealers increasingly long gamma
Volume Skew: Calls > Puts, P/C ratio falling
Heavy Call Interest: 330, 335, 345, 350
👉 Translation:
Above 327.5–330, dealers hedge upward → dips get bought, rips accelerate.
🎯 Execution Playbook
🟢 Bullish Scenario (Primary)
🔔 Trigger
Hold above 327.5–330
SMI crosses up with price holding value
No heavy rejection wick at 330
⚙️ Execution
Calls or call spreads after acceptance above 330
Scale on pullbacks into 330–328
🎯 Targets
Trim into 335
Core target 340
Runner toward 345–350 if volume expands
🔴 Bearish Scenario (Secondary / Hedge Only)
🔔 Trigger
Hard rejection at 330
Breakdown + acceptance below 327
SMI rolls over + downside volume expansion
🎯 Targets
322
320 (put wall / dealer defense)
⚠️ Below 320 = full reset, step aside

Mean Reversion Setup: V1. RSI in oversold region
2. Price likely to rebound back to the mean
Trade Rules:
Entry Trigger - RSI has cross below oversold region, enter limit buy at close price
Exit Trigger - Close at market when close price cross above exit trigger (Red Line)
Notes: Maximum of 3 open positions

$ V Retracement$V is Targeting the confirmations levels and the 1.618. $V has ER next Thursday 1/22 and the stock is currently beat down. This seems to be a "B" Wave Retracement, which means a Misleading Retracement like a fake out so to speak so the Run up move that I'm actually looking for is actually a fake run up just to go down further.
I'm entering down here in Hell on the chart lol but the RR is so beautiful that it entices me lol.
NYSE:MA has the same chart. I posted early this morning. With CPI this week you just never know.
Anyway
Happy Trading, Alerts Set!

VISA? 2c POVHi,
www.tradingview.com
This policy I agree wt Mr T.
Abuse of interest. Squeezing of citizens.
This will also squeeze on profits of V.
All the best
Not a guru
Nb/ need to print lower prices for this idea.

Visa Is Ready To Move to All Time Highs Visa Is Ready To Move to All Time Highs 🚀
Right now, NYSE:V is putting on a masterclass in technical structure. If you’re a fan of high-probability setups, you’ll want to lean in for this one.
We aren't just looking at candles, we’re looking at a story of supply, demand, and a massive psychological barrier.
The Ascending Channel
For over a year, Visa has been climbing a beautiful an ascending parallel channel. This tells us one thing, the bulls are firmly in control of the long-term narrative.
The Doubble Top Barrier
Take a look at that yellow line on the chart. We’ve seen Visa knock on the door of the $360 range before, only to be turned away. This created a Double Top , a classic sign that sellers were defending their territory.
However... something has changed.
The recent price action shows a series of higher lows pushing right back up against that ceiling.
In trading, we say: "The more a level is tested, the weaker it becomes."
The wall is thinning.
The buyers are no longer retreating, they are camping out at the gates waiting for the last push
The Execution Plan
Precision is Key.
A wise trader once said: "Don't trade what you think, trade what you see."
While the image suggests an 81% success rate , the magic isn't in the prediction, it's in the execution .
We are looking for a decisive move above the horizontal resistance (the yellow line). We want to see volume backing this move, that’s the fuel for the breakout. $360 is a reasonable price to place a buy order from my point of view.
Our eyes are set on the upper boundary of the ascending channel, near the $380 - $400 zone, but previous highs are a more easy to reach target.
Always use a Safety Net (Stop Loss): A break back inside the consolidation zone (below the recent higher low) tells us the story has changed, and it's time to exit.
💡 Why This Matters
Patience is our edge. We only execute once that resistance shatters, a discipline backed by the study of thousands of historical setups. If the story changes and the trade fails? No ego. We respect our tight SL, exit cleanly, and hunt for the next opportunity.
👇 WANT MORE?
🚀 Hit the rocket, read my profile and follow so we can find each other again :)

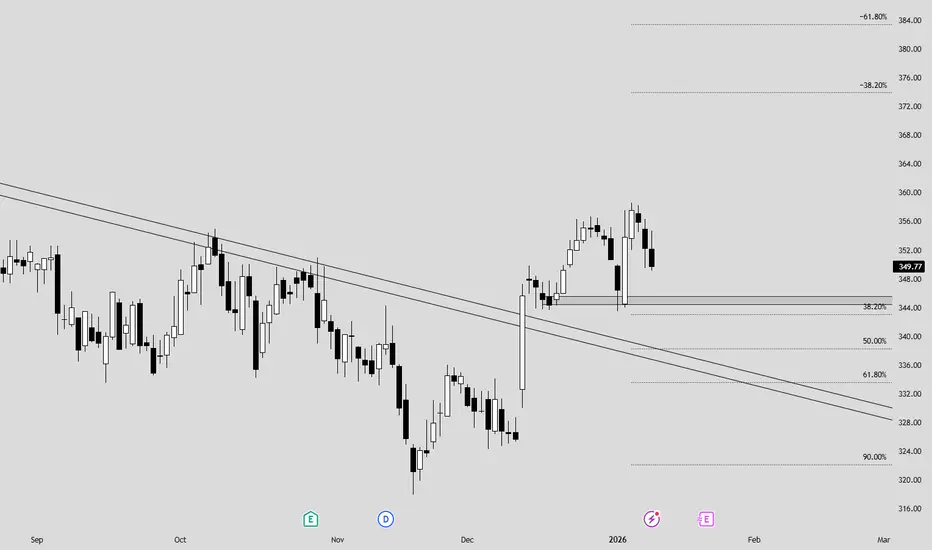
V- Visa, Inc. broke the downtrend and ready for a retest
- Support is aligned with Fibonacci level
- I'm looking at $373 to $384 price soon
Visa (V) Reasserts Bullish Momentum on Strong VolumeVisa closed on 5 January 2026 with strong bullish momentum, supported by above-average trading volume of 7.6 million shares versus a 6.1 million daily average. The move was aided by positive sentiment across the payments space. Price action showed clear buying interest around the $244 level, confirming this zone as an area of demand.
Technically, Visa remains in a well-defined uptrend, characterized by higher highs and higher lows, with price holding above key moving averages. The latest candle structure reinforces a bullish setup, suggesting a favorable risk-reward profile for potential entries on continuation or shallow pullbacks.
Fundamentally, Visa is a wide economic moat business with consistent double-digit growth in both revenue and EPS. Profitability metrics remain exceptional, with ROE consistently above 50%, ROIC around 33%, and net margins exceeding 47% over the same period. The balance sheet is equally strong, supported by solid liquidity (current ratio ~1.0x) and moderate leverage (debt-to-equity ~0.7x), reinforcing Visa’s ability to compound value through cycles.

Visa (V): Emerging Uptrend Backed by Exceptional FundamentalsVisa is showing renewed technical strength, marked by the formation of higher highs and higher lows, with price action firmly holding above both the 20- and 50-day EMAs. This move follows a decisive breakout from a prolonged downtrend, signaling a shift in market structure toward a bullish trend. In the near term, price may retrace toward the $341–$344 demand zone, where it is also likely to find dynamic support around the 50-day EMA—potentially offering a favorable risk-reward entry.
From a fundamental standpoint, Visa remains a wide economic moat company, operating as part of a global payments duopoly. The company has delivered consistent double-digit revenue growth over the past five quarters, alongside strong annual EPS growth during the same period. Profitability remains exceptional, with ROE around 50%, ROIC exceeding 30%, and net margins above 40% across the past five quarters. Balance sheet strength is solid, supported by adequate liquidity with a current ratio of approximately 1.0x and a conservative debt-to-equity ratio of 0.69x. NYSE:V

Short sell Visa!!!
If the price rises as expected, then short it. Why do I have this expectation? The principle stems from the order imbalance reaching its limit.I'm from China, but there are too few traders in the Chinese community, and I'm not very good at English. I try my best to explain my ideas using translation software and chart arrows.

Is Visa Ready for a Deeper Drop? Key Daily Levels in Focus👋 Hello & Respect to All Traders
Hello and respect to all traders and dedicated TradingView followers 🙌
Wishing you disciplined trades, solid risk management, and consistent execution 📊🧠
💳 Visa Inc. – Company Overview
Visa Inc. (V) is one of the world’s largest electronic payment networks, providing the core infrastructure for global financial transactions.
As a major FinTech leader, Visa benefits from the long-term growth of digital payments, e-commerce, and the global shift toward a cashless economy 🌍💰
That said, even fundamentally strong companies can experience medium-term corrections or distribution phases in the market.
📊 Technical Analysis – Visa (V)
🔴 Primary Scenario: Bearish Bias
Based on current price action, the bearish scenario carries more weight at this stage ⚠️
Key technical reasons:
Price is moving below a descending trendline ↘️
Market structure shows Lower Highs and Lower Lows
Weak reactions at key static resistance levels
Lack of strong daily closes above major resistance zones
📉 If current supports fail, price may:
Continue declining toward the Daily Support Zone
Extend the move to lower demand areas
🔻 This scenario aligns better with the overall structure and momentum.
🟢 Alternative Scenario: Bullish (Conditional)
The bullish scenario is secondary and conditional, but not completely invalid.
Bullish confirmation requires:
A clear breakout above the descending trendline
Strong daily candle close above static resistance
Acceptance above key levels
📈 If confirmed, price could:
Retest the broken resistance as support
Move toward the Daily Resistance zone
⚠️ Until these confirmations appear, this scenario remains speculative.
🧠 Summary
Current structure: Bearish
Dominant scenario: Continuation to the downside
Bullish case: Valid only after confirmation
Best approach: React to price, don’t predict
⚠️ Disclaimer
This analysis is for educational purposes only and does not constitute financial advice.
Always apply proper risk management and follow your own trading plan 💼📉
📣 Poll Question
❓ What’s your view on Visa (V) from here?
🔘 Further downside and deeper correction
🔘 Bullish breakout after resistance break
Share your opinion in the comments 👇👇
🏷️ Tags (TradingView)
#Visa #V #Stocks
#TechnicalAnalysis #PriceAction
#SupportResistance #BearishBias
#NYSE #USStocks
#TradingView #SmartMoney
#MarketStructure #RiskManagement 📊

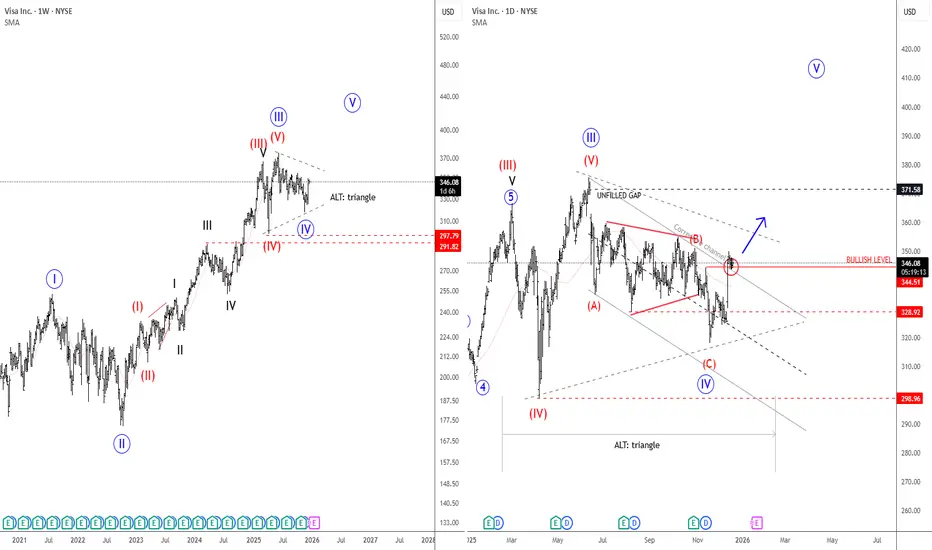
Visa: Completing Correction, Upside Potential AheadVisa Inc. is a global payments technology company that operates one of the world’s largest electronic payment networks. It enables secure electronic transactions between consumers, merchants, and banks in over 200 countries, focusing on fast, reliable, and cashless payments.
Visa has pulled back roughly 15% from its highs and appears to be completing a clear A-B-C corrective decline. Moves out of triangle formations are often final legs within corrective structures, suggesting a new bullish push could be approaching. This outlook is reinforced by the unfilled gap near 371, which historically tends to act as a price magnet over time. As a result, a reversal to the upside over the coming weeks or months would not be surprising. A breakout above the corrective channel would serve as a key confirmation for trend resumption.
Highlights:
Visa appears to be completing an A-B-C decline
Channel break signals potential upside continuation
Unfilled gap at 371 remains a key upside target for 2026
Bullish confirmation above 344.50
Support levels at 311 and 298 on deeper pullbacks
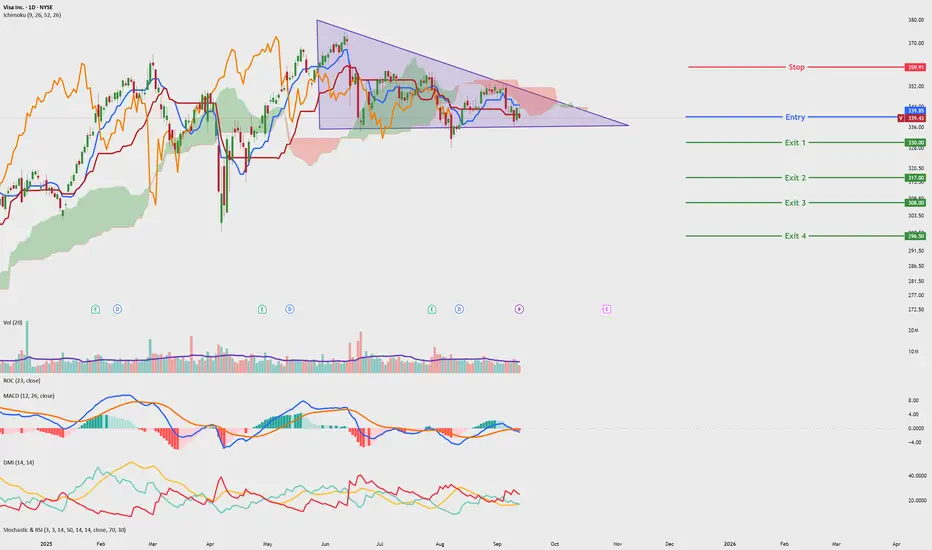
Visa - Potential drop from descending triangleV - Potential Bear Swing
Timeframe - 1 weeks to 3 months
Volume
- Maintained volume
Price Action + Trend
- bullish trend broken
- Price broken out of downtrend line
Ichimoku
- Lagging, base and conversion line below kumo
- Kumo cloud thinning and red cloud forming
Patterns
- Descending triangle
Oscillators
- MACD - Turning into bearish MMT
- DMI - Bearish mmt picking up, DM + DM - showing divergence, DX turning up towards 20
Conclusion
- Low to mid risk
- high return
V - Can we see a new ATH?=======
Volume
=======
-Neutral
==========
Price Action
==========
- Price broke out of falling wedge
- Rounded bottom observed
- Triple bottom observed
=========
Oscillators
=========
- Ichimoku, price above cloud, green kumo expanding, base + conv + lagging piercing clouds upwards
- MACD bullish
- DMI slightly bullish
- StochRSI, slightly bullish
=========
Conclusion
=========
- short to long term swing, price may reverse at current level, to enter spot or wait for pullback.

Visa (V) breaks out from a year-long symmetricalV has spent almost a year consolidating inside a symmetrical triangle. Today’s candle shows a breakout above the downtrend line.

Visa: More Upside PotentialVisa’s blue wave (x) still has significant upside potential before reaching its peak. With price still trading below our resistance level at $375.51, we expect the subsequent wave (y) to take over and guide the stock into our green Long Target Zone between $292.19 and $266.47. Within this range, we anticipate the completion of the larger turquoise wave 4 before any sustainable gains can take hold. Alternatively, it’s possible that the turquoise wave alt.4 has already concluded. In this scenario, the stock would move directly toward the $375.51 resistance—and potentially break through both this level and the $394.49 mark (probability: 33%).

Visa great macro buyVisa presents an opportunity while the world is focused on mag 7 and big tech. I have been slowly diversifying my portfolio away from this by adding stocks like BN and V. I believe visa will perform well in a market downturn and or during re inflation or recession fears. The 21 week ema is a great buy zone during regular market trends, the 55 is a sweet spot during black swans as well. I have started a 100 share position pre market, this is a long term portfolio anchor.


Visa and Aquanow Partnership Accelerates Stablecoin PaymentsVisa continues advancing its blockchain strategy with a new partnership with Aquanow to speed up stablecoin settlements across global markets. The collaboration aims to enhance cross-border speed, lower transaction costs, and increase transparency across Central and Eastern Europe, the Middle East, and Africa. This marks another major step in Visa’s broader push to modernize digital payments using blockchain rails.
Through this agreement, Visa integrates Aquanow’s digital asset infrastructure—technology capable of handling continuous, high-volume crypto transactions—directly into its global payment network. As a result, financial institutions in the CEMEA region can now settle transactions using approved stablecoins like USDC. The move strengthens Visa’s long-term plan to build faster, more resilient settlement systems for regions heavily affected by delays and banking inefficiencies.
Visa is also focused on reducing intermediaries in the settlement chain, improving real-time transparency, and providing institutions with 24/7/365 settlement access. With Aquanow’s support, issuers and acquirers can clear obligations using stablecoins rather than relying solely on traditional clearing processes. This development aligns with Visa’s strategy to scale digital money movement, especially in emerging markets where currency volatility and slow clearing systems remain major obstacles.
Aquanow, founded in 2018, brings strong liquidity technology and deep expertise in digital asset rails. Its infrastructure processes billions in crypto brokerage and settlement flows monthly. This strengthens Visa’s stablecoin pilot programs, which already surpass a $2.5 billion annualized volume. Visa’s CEMEA division continues upgrading its backend systems to support real-time blockchain settlements.
Technical Outlook
Visa’s stock maintains a bullish structure, respecting an ascending trendline around $320, which was retested last week. Immediate resistance rests at $375, the previous major high. A breakout above this zone could extend momentum. Key supports sit at $320 and $305 if price retraces.
