Another leg up for VRSN? Will VRSN hold support around that $277 area? I think we can see a retest around there soon and then a new all time high shortly after and retest the top of the channel resistance.
VeriSign, Inc. Shs Cert Deposito Arg Repr 1/6 Sh
No trades
Trade ideas

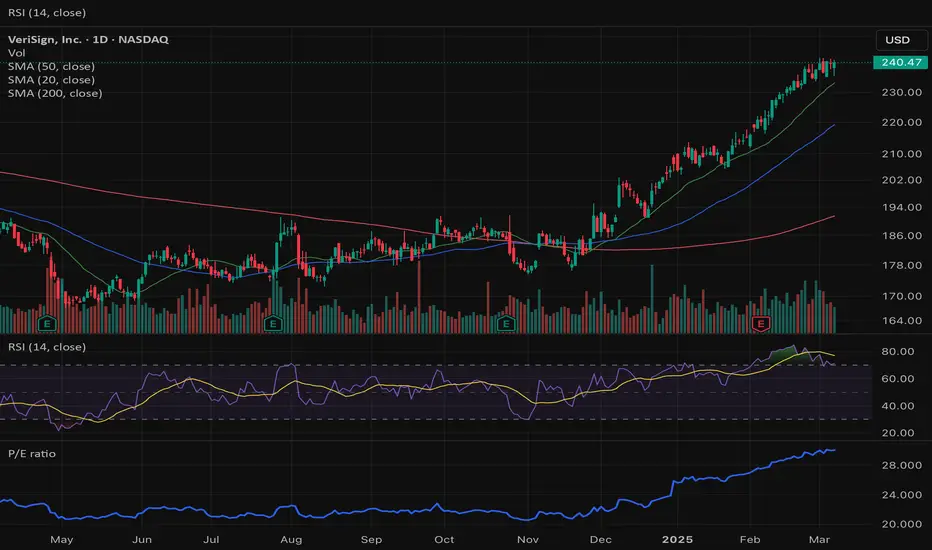
VeriSign (VRSN) | Breakout or Rejection at $290?Price is consolidating around $281–282 after bouncing strongly from the $272 support zone.The stock is close to testing the $286–290 resistance area, which has acted as a ceiling multiple times in recent months.
Key Support & Resistance
Immediate Support: $275 / $272 (major demand zone, buyers consistently defended).
Immediate Resistance: $286–290 (overhead supply).
Upside Targets:
$300.45 – first measured resistance.
$316.48 – prior swing high and breakout target.
Downside Risk: A breakdown below $272 could open room toward $260–250 zone.
Trend & Indicators
Moving Averages:
Price reclaimed short-term EMAs, showing momentum is shifting bullish.
Mid-term MAs are flattening, suggesting consolidation before a possible new trend leg.
RSI (54.41): Neutral, pointing upward → room for upside before overbought conditions.
PMO : Recently flipped bullish after an extended bearish cycle, confirming improving momentum.
Bullish Case
A sustained close above $290 confirms breakout strength.
Momentum above this zone could quickly push toward $300–316.
Buyers stepping in at higher lows strengthens the bullish structure.
Bearish Case
Rejection at $286–290 could lead to another retest of $275–272 support.
Breakdown below $272 would invalidate the bullish thesis and expose downside risk toward $260–250.
Conclusion
VRSN is at a critical inflection point. Holding above $275 keeps the bias bullish, with potential to reclaim $300+ if resistance breaks. However, failure at $290 keeps the range intact, and a loss of $272 would shift control back to the bears.

VRSN US ( VeriSign) LongVeriSign is a key player in the management of .com and .net domain names, processing over 132 billion DNS queries per day
VeriSign has a near-monopoly position in the management of .com and .net domains (146.4 million registered addresses)
Domain renewal rates have increased to 75.5%
EPS was $2.21 in the last quarter, compared to the forecast of $2.20
Revenue has been growing steadily: in the last quarter it reached $410 million, which is 5.9% higher compared to the same period last year
🐻The recent sale of 4.3 million shares of Berkshire Hathaway caused a short-term correction, but it was due more to regulatory reasons (share decline below 10%) than fundamental problems
The board of directors approved a significant share buyback program
The correction is over.
The stock has left the channel upwards.⚡️
We are waiting for a test of the open gap level from above🚀

Same price as dot com bubble $VRSNSame price as dot com bubble $VRSN. Cup and handle? TD9? Break out or break down?

Buffet loves it, but...Fundamentals do not justify current valuation. Short at 240 as a hedge to my GOOG and AMZN positions
VRSN - VeriSign has reached it's upper extremeThe white up-sloping Fork gives us the most probable path of price for VRSN.
As we see, that was a Hell of a run.
Price has reached the U-MLH, which is the natural Extreme by the law of physics.
What's the natural reaction?
A move back to the Mean.
What's the Mean?
The Center-Line.
This is a high probability trade I take blindly.
But I mange my risk with open Eyes, even when this trade has a win rate of over 80%.
Don't let greed your Brain!

Three Ws and great result 4th in the making.It Created 4 Ws on Daily Time frames.
Two with Double Top and Two with Thriple Top.
The Trend line of First W was not broken and the price went up
The Trend line of next two Ws with Thripple Top broken and the price Went down.
As per this trend the current W is with Double top we will wait for a daily close above its trend line A close above that Trendline means the price will go up.

VRSN - Short term trading opportunityMoving averages, trend lines, and oscillators indicate an upward movement in the short term.
Find the PRZ and TP levels on the graph.

4/25/24 - $vrsn - a better 10y that's it - vrockstar4/25/24 - vrockstar - idk get this - liked/ traded it sub $10 to the long side... but good gawd the rip from last Q made zero sense to me. look at 4q vs. 4q gross profit gen vs. opex spent. going the wrong way. net cash fine, "gen's cash" but it's a lot of non-cash stock comp (and my rule is i only pay for this as cash if the stock is sustainably going higher). don't dislike the brand/ leadership, but this is too expensive for funds to own into this type. hate shorting but this w/b something to unload ahead of results if you own it in the green, and/or if we actually get some sort of beat that's not big but there's some short covering that drives it 5-10% higher - get out. i'll be shorting this on the open if that happens. that's my play (unless it's a "beat" in which case i return to review into the following print). don't need to play them all.

crazy macro VRSN ideaCould this be a continuation / triangle pattern?
I drew this chart in regular view, as opposed to log, and I can see what might be a triangle pattern forming, based off of the "dot com" boom of the early two thousands, and where VRSN seems to be sitting at resistance.
Should price action keep testing that level around 218, I could see prices break out, retest at that level, then continue on its merry way.
Again, this is a crazy idea. Always do your own research.
-W00f
Humm, just before hitting submit, I could see this also play out as a bearish H&S shoulder pattern. We'll just have to wait and see what happens.

good type 1 supply, but it will be opposite to 15 min current ttgood type 1 supply, but it will be opposite to 15 min current ttrend, so dont short

$VRSN with a Bullish outlook following its earnings #Stocks The PEAD projected a Bullish outlook for $VRSN after a Negative over reaction following its earnings release placing the stock in drift C with an expected accuracy of 33.33%.

Crooked WTargets in orange with possible target 1 in larger type.
T2 if T1 is passed is in smaller type.
Valley 2 is lower than valley 1.
The final leg appears to have terminated at the .786.
Shaped like a crooked W
Bearish Cypher.
No recommendation

$VRSN with a Bearish outlook following its earnings #Stocks The PEAD projected a Bearish outlook for $VRSN after a Negative Under reaction following its earnings release placing the stock in drift D with an expected accuracy of 100%.

Bearish Shark/Rising WedgeAlso a rising wedge
Guess folks get too excited sometimes and run securities too far to the upside. I am beginning to wonder what type of market we are in /bull or bear/ but time will tell )o:
Thinking we need to chill for a while perhaps?
No recommendation..
2nd valley is lower than the first/just flip it the other way for Bull shark/I hate those Ws! LOL

VRSN: Breakout of the range up.The range resistance level was broken upwards with the minimum target level around 255.

CupI do not see a clear cut handle yet but I do see a nub of a handle. I look for a horizontal range or an area of support of at least 3 or 4 candles, which there is 3 candles but I prefer a longer area of consolidation for a true handle. You may see an area that I do not see. We all have an opinion, or 2 (o:
BEWARE. Price is outside the top bollinger band set on an 80 dma verses a 20. This is bullish but price likes being inside the bands as a rule. This demonstrates rather extreme buying pressure that is usually not sustainable for long periods of time. Same goes for price when it is beneath the bottom band, it demonstrates extreme selling pressure.
Volume has been high so it matches the run up, volume slacking off today
No recommendation. Negative volume is high. Just kinda looks like a bit of a deeper pull back is coming because price is still over the top band. Remains to be seen. Price hit 21.15 today but did not break the long term high which is long entry level. Hovering at overbought levels with RSI set on 80 verses 70. Does not look as if it actually broke the 80 mark though.

Double BottomThis one has been bobbling around in nowhere land for quite a while..Tried to break up from a V Bottom, but was captured by a bearish rising wedge/fell out or broke bottom trendline at the top...and has been falling ever since.
Perhaps recovered now and it is hard to be bullish, especially after a day like today..time will tell..
There is an adam and adam, and eve and adam, adam and eve, and an eve and eve ..Eve is more rounded than adam. Adam bottoms tend to be more slender and a bit more of a straight down appearance. An Adama and Adam can be just 2 candle tails similar to a tweezer bottom.
This one is more than that but neither is truly well rounded of long in duration..you decide (If you care) (o;
DBs within a third of the yearly low, perform the best as a rule. Wait for confirmation as there is always the chance this can continue down.
You can trade this like an ABC bullish pattern, where the first bottom is A, the second bottom is C and the top is B.
Possible stop under C..or second bottom..stash your stop somewhere safe..
This is not to long entry level yet and you need a confirmed uptrend to validate the move..
Not a recommendation/Just an observation
I am gonna press long, but hard to really know these days )o:


VRSN Strong Buy on Pending BreakoutEntered Long VRSN here.
Expecting a breakout in the coming days.
Target 250
Always have a stop.

Symmetrical TriangleVrsn has struggled for quite a hile. It seems to have broken up from the S triangle.
VRSN seemed to be cruising along but was in a bearish rising wedge/fell out and seems to have recovered.
Not a recommendation
A symmetrical triangle is a chart pattern characterized by two converging trend lines connecting a series of sequential peaks and troughs. These trend lines should be converging at a roughly equal slope. It is usually a continuation pattern but can break either way/up or down.
A rising narrowing wedge is usually a reversal pattern at the top. The lines both slope up and convers, narrowing at the apex.


V BottomI like this stock and have been eyeballing it for a while to add to my portfolio
Does not seem volatile and has no parabolic appearance
VRSN is residing in an ascending triangle at the present time.
Earnings are 7-23 AMC and they have missed on occasion
I am trying to put indicators in context, in the background, as they can make it almost impossible to see what is going on.
I am not recommending this stock (But i do own it)
Good luck!
