Verizon (VZ) — Bullish Reversal Setup! Smart Money Loading UpNYSE:VZ is showing early signs of a **trend reversal** after a long downtrend. The price is now testing the **upper boundary of its descending channel**, signaling potential breakout momentum.
Technicals suggest that **smart money might be accumulating** before a larger move toward the $45 range.
Key facts today
0.96 USD
15.55 B USD
119.72 B USD
About Verizon Communications Inc.
Sector
Industry
CEO
Daniel H. Schulman
Website
Headquarters
New York
Founded
1983
ISIN
ARDEUT112927
FIGI
BBG000F08TF4
Verizon Communications, Inc. is a holding company, which engages in the provision of communications, information, and entertainment products and services. It operates through the Consumer and Business segments. The Consumer segment provides consumer-focused wireless and wire line communications services and products. The Business segment offers wireless and wireline communications services and products, including FWA broadband, data, video and conferencing services, corporate networking solutions, security and managed network services, local and long-distance voice services, and network access to deliver various IoT services and products. The company was founded in 1983 and is headquartered in New York, NY.
Related stocks
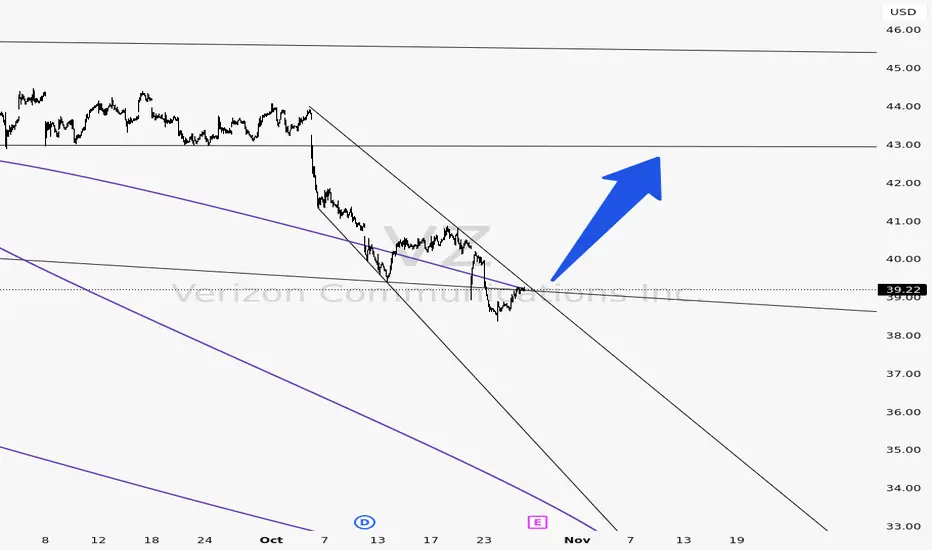
Verizon Wave Analysis – 23 October 2025
- Verizon falling inside sharp impulse wave 5
- Likely to reach support level 37.60
Verizon continues to fall inside the sharp downward impulse wave 5, which started earlier from the key resistance level 40.65 (former multi-month low from July) intersecting with the 38.2% Fibonacci correction of t

Starting To Buy Verizon VZ is at a support zone I bought 1/2 of a position with my lower timeframe showing up but the higher still down and overall sideways. If we push through I’ll add the other half at the $32 area. Currently in a nearly 3 decade consolidation the breakout could be massive. Let the dividends compound and

Mean Reversion Setup: VZ1. RSI in oversold region
2. Price likely to rebound back the the mean
Trade Rules:
Entry Trigger - RSI has cross below oversold region, enter limit buy at close price
Exit Trigger - Close at market when close price cross above exit trigger (Red Line)

VZ eyes on $41.xx: Major Support zone may hold the DUMP for buysVZ got dumped on the news of a CEO change.
Dropped into a Major Support zone $41.32-41.62
Old-school dividiend play at a good spot to add.

Verizon \$43.20 PUT – Weekly Short Play!
### 🚨💥 VZ \$43.20 PUT – Weekly Short Play! 💥🚨
**Strike:** \$43.20 🛑
**Expiry:** 2025-09-05 📅
**Direction:** PUT (SHORT) 🔻
**Entry Price:** \$0.25 💵
**Size:** 1 contract 📏
**Entry Timing:** Market Open ⏰
**Profit Target:** \$0.50 🎯 (+100%)
**Stop Loss:** \$0.12 🛑 (\~48%)
**Hold Horizon:** Exit by

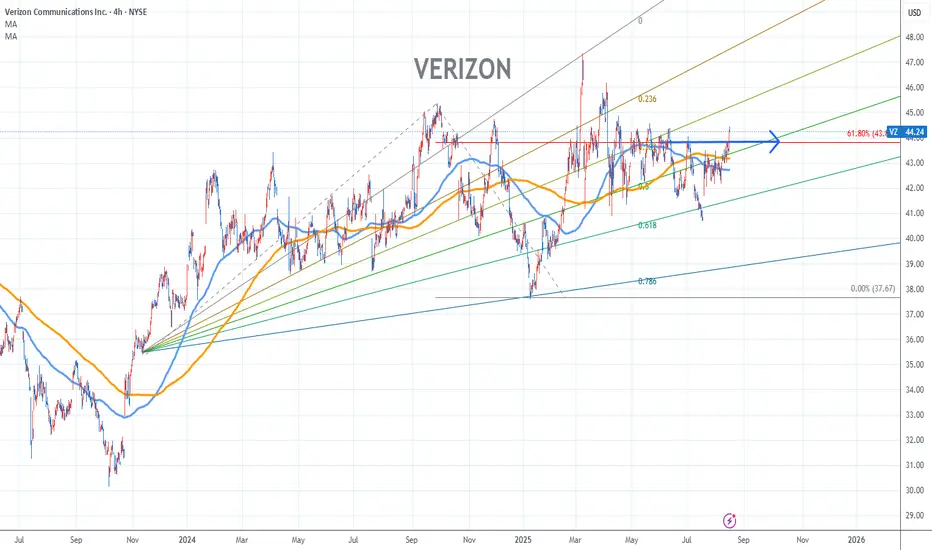
Verizon Stock Chart Fibonacci Analysis 081525Trading Idea
1) Find a FIBO slingshot
2) Check FIBO 61.80% level
3) Entry Point > 43/61.80%
Chart time frame:B
A) 15 min(1W-3M)
B) 1 hr(3M-6M)
C) 4 hr(6M-1year)
D) 1 day(1-3years)
Stock progress:A
A) Keep rising over 61.80% resistance
B) 61.80% resistance
C) 61.80% support
D) Hit the bottom
E)
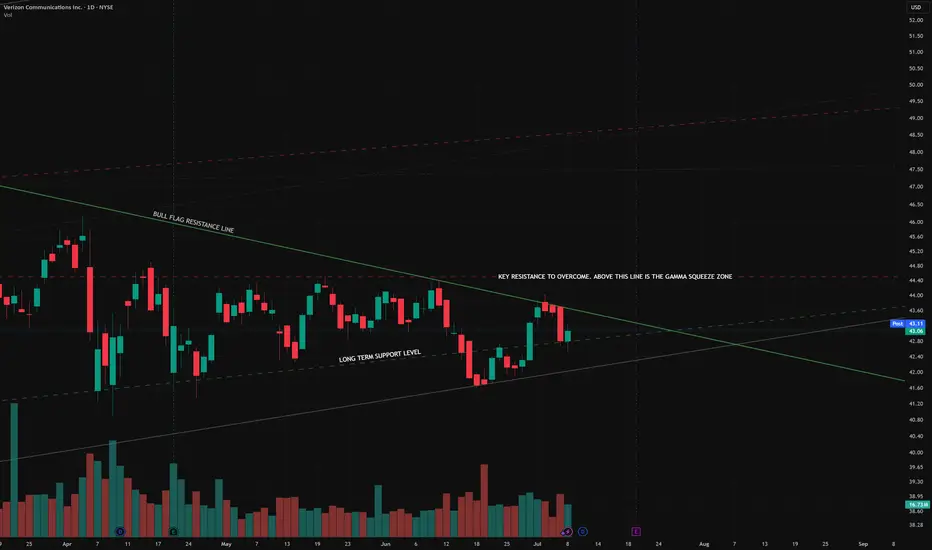
Verizon Communications Inc.(NYSE)- A Box Breakout⚠️ Disclaimer: This chart is for educational purposes only.
VZ- Price formed a multi-week horizontal consolidation (boxed range) and has just broken above the buy point (~$44.30). That breakout resolves the short-term range to the upside — a constructive sign.
The breakout candle printed on modest

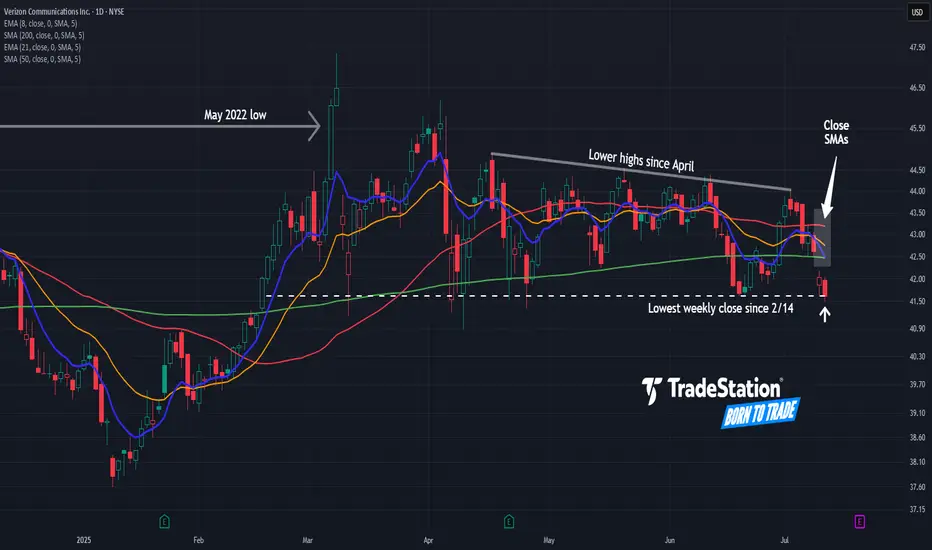
Verizon May Be Rolling OverVerizon Communications has been rangebound for more than a year, and now some traders could think it’s rolling over.
The first pattern on today’s chart is the May 2022 low of $45.55. VZ fell below that level in late 2022 and rebounded to it by mid-2024. The stock has been stuck below the same level
Where is Verizon headed next?Some quick points about the slight dip Verizon experienced over the past 5 trading days. Did bears step in and reject higher prices for VZ? Is the potential for a rally over?
In my opinion. No. But why you ask?
This stock trades relatively inverse to 10 year treasury yields. The 4 down days recen
See all ideas
Summarizing what the indicators are suggesting.
Oscillators
Neutral
SellBuy
Strong sellStrong buy
Strong sellSellNeutralBuyStrong buy
Oscillators
Neutral
SellBuy
Strong sellStrong buy
Strong sellSellNeutralBuyStrong buy
Summary
Neutral
SellBuy
Strong sellStrong buy
Strong sellSellNeutralBuyStrong buy
Summary
Neutral
SellBuy
Strong sellStrong buy
Strong sellSellNeutralBuyStrong buy
Summary
Neutral
SellBuy
Strong sellStrong buy
Strong sellSellNeutralBuyStrong buy
Moving Averages
Neutral
SellBuy
Strong sellStrong buy
Strong sellSellNeutralBuyStrong buy
Moving Averages
Neutral
SellBuy
Strong sellStrong buy
Strong sellSellNeutralBuyStrong buy
Displays a symbol's price movements over previous years to identify recurring trends.
C
VZ.HQ
Chesapeake & Potomac Telephone Co. of West Virginia 8.4% 15-OCT-2029Yield to maturity
7.81%
Maturity date
Oct 15, 2029
VZ5680218
Verizon Communications Inc. 6.4% 15-NOV-2053Yield to maturity
6.45%
Maturity date
Nov 15, 2053
AU3CB026816
Verizon Communications Inc. 3.5% 04-NOV-2039Yield to maturity
6.43%
Maturity date
Nov 4, 2039
VZ5700832
Verizon Communications Inc. 6.1% 15-NOV-2053Yield to maturity
6.28%
Maturity date
Nov 15, 2053
VZ5652669
Verizon Communications Inc. 5.8% 15-SEP-2053Yield to maturity
6.20%
Maturity date
Sep 15, 2053
VZ4567039
Verizon Communications Inc. 4.65% 15-NOV-2047Yield to maturity
6.19%
Maturity date
Nov 15, 2047
VZ5705330
Verizon Communications Inc. 6.05% 15-NOV-2053Yield to maturity
6.12%
Maturity date
Nov 15, 2053
VZ5414108
Verizon Communications Inc. 4.8% 15-MAY-2052Yield to maturity
6.04%
Maturity date
May 15, 2052
VZ4774265
Verizon Communications Inc. 5.0% 15-DEC-2048Yield to maturity
6.04%
Maturity date
Dec 15, 2048
See all VZC bonds
00963
CTBC Global High Dividend ETF Securities Investment Trust FundWeight
1.46%
Market value
483.60 K
USD
Explore more ETFs


