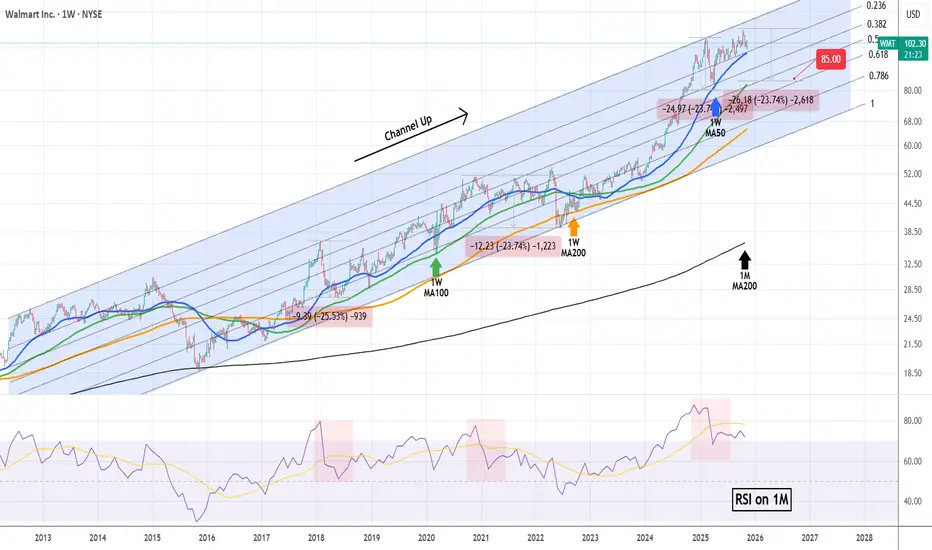
WALMART can correct to $85.00 if this level breaks.Exactly 5 months ago (June 12, see chart below), we gave a strong buy signal on Walmart (WMT) right at the bottom of its trend, which eventually hit our $110 Target and then got rejected:
This time we move to the larger 1W time-frame as our former Target was eventually a new All Time High (ATH) almost at the top of the 13-year Channel Up. The price is hanging tightly now on the 1W MA50 (blue trend-line), which is where the previous correction (Feb-March 2025) found Support and rebounded.
With the 1M RSI printing a formation that previous delivered two technical pull-backs of -23.74%, we expect the stock to start correcting again if it closes below the 1W MA50. All previous breaks below it, eventually led to a 1W MA100 (green trend-line) test.
If that takes place, we expect Walmart to hit at least $85.00 inside 2026.
---
** Please LIKE 👍, FOLLOW ✅, SHARE 🙌 and COMMENT ✍ if you enjoy this idea! Also share your ideas and charts in the comments section below! This is best way to keep it relevant, support us, keep the content here free and allow the idea to reach as many people as possible. **
---
💸💸💸💸💸💸
👇 👇 👇 👇 👇 👇
Trade ideas
WMT - Wallmart Earnings Setup for This WeekHello Everyone , Followers,
Wallmart will release its financial reports on Thursday Before market open. I would like to share my view and follow up level depends on good and bad reports
Bullish Scenario
If earnings beat + guidance strong → next target: 110 - 111
Bearish Scenario
Weak numbers → potential drop to between 95 - 96
🔹 Key Support Zones
First support: 99.50 - 100
Deeper support: 95.50 - 95.80
🔹 Resistance Levels
Main resistance: 104.80 - 105.00
Breakout target: 111.50 - 112.00
🔹 Outlook
As long as It stays above 99.50 , momentum remains bullish.
A breakdown below that level could open the door for a deeper pullback. This is depends on Results of financial reports.
🔹 My Plan
I will wait for the financial report before i buy it . With a bearish scenario my buy level is 105 (It needs to close above this level)
If it can achive to stay above 99.50 and if you like to take a risk then you can buy it above this level before results are published .
If you enjoy and like clean, simple analysis — follow me for more.
Have a lovelly and Sunny Weekend to all.

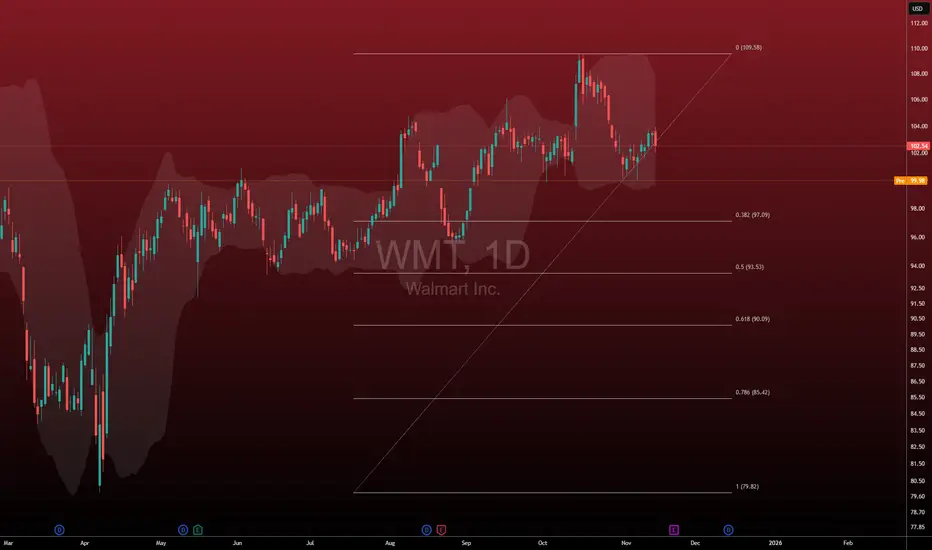
Walmart (NYSE: $WMT) Bulls Eye a Reversal Near Key SupportWalmart’s stock is showing early signs of a potential rebound after testing a crucial support zone near the $100 level. This area has acted as both resistance and support in the past, making it a critical price floor for buyers. The chart displays a well-defined ascending trendline that has held since early 2025, signaling a long-term bullish structure.
Currently trading around $102, Walmart appears to be forming a higher low, which could serve as the base for a new bullish leg. This new leg may lead to a breakout toward $109 and possibly higher if volume confirms renewed buying pressure.
Fundamentally, Walmart continues to benefit from its dominant retail position and strategic investments in e-commerce and automation. The company’s ability to manage supply chains efficiently and maintain stable margins during inflationary periods has strengthened investor confidence. Additionally, its focus on expanding grocery delivery and membership programs has kept revenue growth steady even amid consumer spending shifts.
If the $100–$101 region continues to hold, technical traders may anticipate a bounce back toward the $108–$110 resistance zone. A clean break above that level could open the door for a move to new highs around $114. Conversely, a close below $98 would invalidate the bullish thesis and suggest further downside toward $94.
With strong fundamentals, consistent dividend growth, and a chart structure hinting at a technical reversal, Walmart’s setup appears attractive for medium- to long-term investors watching for confirmation of momentum.

WMT Bulish breakout just a brief idea looking at Wmt prime entry point is 100 dollars due to its strong support looking at trend lines it’s bound to break out overall when snap resolves it will likely head up so load up on long calls

WMT - Weekly - OvervaluedBased on the analysis, the company demonstrates consistent financial health since 2022, suggesting stability despite a volatile market, and has shown year-over-year growth in both revenue and net income since 2020. However, there are technical concerns, including price manipulation detected since February 10, 2025, and the stock has been trading in a state of low volatility since March 17, 2025. Furthermore, the stock is currently trading above its fair value channel, which is estimated to be in the $84 - $90 range. This overvaluation, combined with the fact that monthly candles since January 2024 have been closing as neutral (indicating market indecision), suggests a correction is likely pending.
Not financial advice, always do your due diligence
Leave a like👍 and/or comment💬.
We appreciate and value everyone's feedback!
- RoninAITrader

$WMTWalmart reports earnings this Thursday, and the weekly chart is telling a very clear story:
✅ 1. Price Has Defended the $100 Level All of 2025
Even with market volatility and uncertainty, NYSE:WMT has held above $100, showing strong long-term demand. That level has acted as:
• Major liquidity zone
• Investor confidence floor
• Consumer-strength indicator
🟡 2. Missing Economic Data = Unclear Consumer Picture
Because of the government shutdown, we’re still missing key reports that normally show:
• Retail spending
• Consumer sentiment
• Household demand
• Inflation pressure
This lack of data makes it harder for investors to judge how strong Walmart’s traffic and revenue trends really are.
🔺 3. Tariffs Have Added Uncertainty
Tariff debates earlier this year created hesitation for investors.
Why? Because tariffs affect:
• Walmart’s import costs
• Consumer prices
• Margins
• Inventory strategy
That uncertainty kept some buyers on the sidelines waiting for clarity.
🔻 4. Expected Move: A Small Pullback Above $100
Based on the chart and current market conditions, I expect:
• Some investors may take profits before earnings
• A controlled pullback towards the $100–$102 area
• Buyers stepping back in if consumers show strength
The stock still looks healthy as long as it stays above $100.
📊 5. What Will Move the Stock?
Key items in the report:
• Same-store sales
• Grocery traffic
• E-commerce growth
• Commentary on tariffs + consumer strength
• Guidance for Q1 2026
🔵 Final Take
Walmart is still one of the strongest defensive names in retail, but without the full economic picture, investors may temporarily lock in profits. A pullback above 100 is normal the real move comes after earnings confirm how the U.S. consumer is holding up.

WMT - Overvalued - CEO Retiring - What Next?Walmart demonstrates exceptional operational strength with impressive 25.3% net income growth and consistent earnings performance, supported by successful digital transformation and strong market positioning.
Here's a hard truth... these positive fundamentals are overshadowed by valuation concerns that appear unsustainable for a mature retail business.
The assessment of overvaluation centers on elevated multiples including a 40.6 P/E ratio and 62.3 P/FCF ratio, which significantly exceed historical norms for the retail sector. Discounted cash flow models consistently indicate substantial premiums to fair value estimates, ranging from 62% to 153% above intrinsic value calculations. This valuation disconnect suggests the market has priced in optimistic growth expectations that may be difficult to sustain . (Sound familiar? It should)
While Walmart maintains excellent defensive characteristics and operational momentum, current price levels present limited upside potential and meaningful downside risk . I'm going to have a "hold" recommendation reflecting my view that existing shareholders should maintain positions given the company's strong fundamentals, but new capital should await more attractive entry points .
I would be much more confident if we were closer to the 38.2% fibonacci pullback around $97 or what would be even better would be $90-$93 which is at the 61.8% and 50% pullback, respectively.
WALMART
WMT has been trade around 7-year CHANNEL UP PATTERN since the January 12 2015 High.
The price has finally reached the top (Higher Highs trend-line) of this decade-long bullish pattern and that is easily identifiable by the 1W RSI sequence.
The rally that started on the May 16 2022 bottom is very similar to the one that started on the October 26 2015 bottom.
bullish momentum is just around this 2-4 weeks impact from Trump presidency, but negative outlook from current geopolitical and economically approach, it gonna dip
AIMING it will dip deep and close the gapping again , to return to its baseline price.
thats all

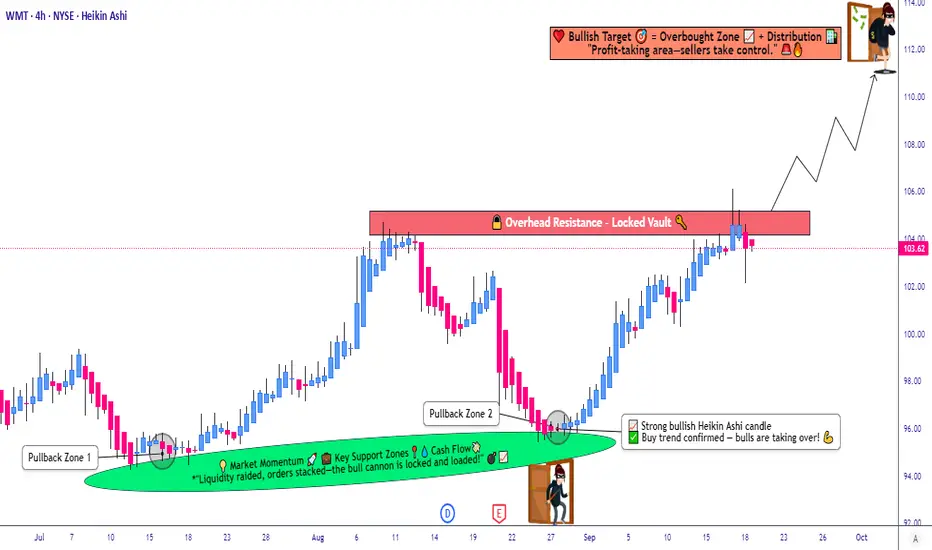
Is Walmart Setting Up for a Bullish Momentum Shift?🛒 WMT: Walmart’s Wealth Heist Strategy 🚀 (Swing/Day Trade)
Asset: Walmart, Inc. (WMT)
Market: US Equities (not Forex, as WMT is a stock, not a currency pair! 😉)
Vibe: Bullish Breakout with a Thief Strategy twist! 🕵️♂️
📈 The Plan: Steal the Breakout! 💥
WMT is gearing up for a bullish breakout at $105.00!
🎯 For confirmation, we need a 4-hour candle close above the resistance level at $105.00 to lock in that buy signal. No sneaky moves before confirmation, or you’re gambling with your loot! 😎
🕵️♂️ Thief Strategy: Layered Limit Orders
This is where the Thief Strategy shines! 🌟 Instead of jumping in with one big order, we’re setting multiple buy limit orders to stack the deck in our favor:
$102.00
$103.00
$104.00
$105.00
$106.00
Pro Tip: Feel free to add more layers based on your risk appetite, but only place these limit orders after the breakout is confirmed (4H candle close above $105.00).
Setting layers blindly is like robbing a bank without a getaway car—risky business! 🚨
🛑 Stop Loss: Protect Your Stash
Set your stop loss at $101.00.
Note: Dear Thief OGs (Ladies & Gentlemen of the charts), this is my suggested SL, but it’s your heist, your rules! Adjust based on your risk tolerance. 💸
🎯 Take Profit: Cash Out Like a Pro
Our target is $112.00, where we expect strong resistance and potential overbought conditions. Watch out for a possible trap at this level—grab your profits and escape before the market pulls a fast one!
😈Note: This is my recommended TP, but you’re the boss of your trades. Take profits at your own discretion and keep the cash flowin’! 💰
🔗 Related Pairs to Watch (Correlations & Key Points)
Since WMT is a retail giant, its price action often correlates with consumer discretionary and retail sector stocks. Keep an eye on these related assets (all priced in USD):
NYSE:TGT (Target Corporation): Another retail titan. If WMT breaks out, TGT often follows the consumer spending vibe. 📊
NASDAQ:COST (Costco Wholesale): Big-box retail cousin. Strong correlation with WMT due to similar market dynamics. 🏬
AMEX:XRT (SPDR S&P Retail ETF): Tracks the broader retail sector. A bullish WMT could signal strength in XRT. 📈
Key Correlation Insight: WMT’s performance is tied to consumer confidence and economic data (e.g., retail sales, consumer price index). If these indicators are strong, expect WMT and related stocks to rally. Conversely, weak data could stall the breakout. Always check the economic calendar! 🗓️
📝 Final Notes for the Heist
Confirmation is King: Don’t set your layered limit orders until the 4H candle confirms the breakout above $105.00. Patience pays! ⏳
Risk Management: The Thief Strategy is slick, but don’t get greedy. Stick to your risk-reward ratio and protect your capital. 💼
Market Context: Watch for broader market sentiment (S&P 500, consumer sentiment reports) to support WMT’s bullish move. 🌍
✨ “If you find value in my analysis, a 👍 and 🚀 boost is much appreciated — it helps me share more setups with the community!”
Disclaimer: This Thief Style trading strategy is just for fun! Trade at your own risk and always do your own research. 😜
#Hashtags: #WMT #StockMarket #SwingTrading #DayTrading #ThiefStrategy #BullishBreakout #TechnicalAnalysis #TradingIdeas
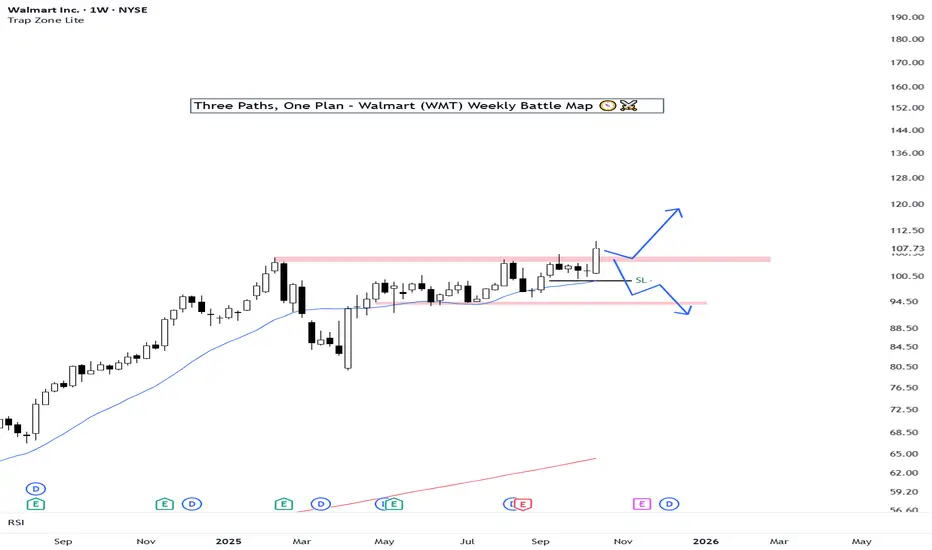
Three Paths, One Plan – Walmart (WMT) Weekly Battle MapWalmart just broke to new all-time highs after building a strong base since February. This is a major technical moment — a clean structure that gives us three possible scenarios for the upcoming weeks:
🟢 Scenario 1 – Strong Breakout
Price keeps pushing higher with wide candles, confirming strength.
Plan: Stay long. Add on a clean retest of the pink zone if a color change confirms continuation.
Stop-Loss: Below the green line (~$101).
Target: $120–$125.
🟡 Scenario 2 – False Breakout / Loss of Momentum
If the next few candles stay small and the breakout fades, momentum dries up.
Plan: Reduce exposure or sell into a rebound to manage damage.
Defense Zone: $104–$105.
🔴 Scenario 3 – Stop & Reversal
If next week’s candle completely erases the breakout bar with a violent move, that triggers a reversal short.
Condition: Full candle wipeout with a close below the breakout body.
Target: Lower base of the range around $93 ±.
🎯 Final Take
As long as price holds above the pink zone ($105–$107), bias remains bullish.
Only a strong rejection and weekly close below $101 would confirm a reversal toward $93.
ption Alert: $WMT NOV 07 2025 $110 Calls – 39% ROI Potential WitEnter: NYSE:WMT NOV 07 2025 $110 CALLS
Buy in Price: $2.29 - $2.46
Take Profit: $3.18
Stop Bleeding: $2.02
ROI Potential: 39%
Exit Within: 3 Weeks

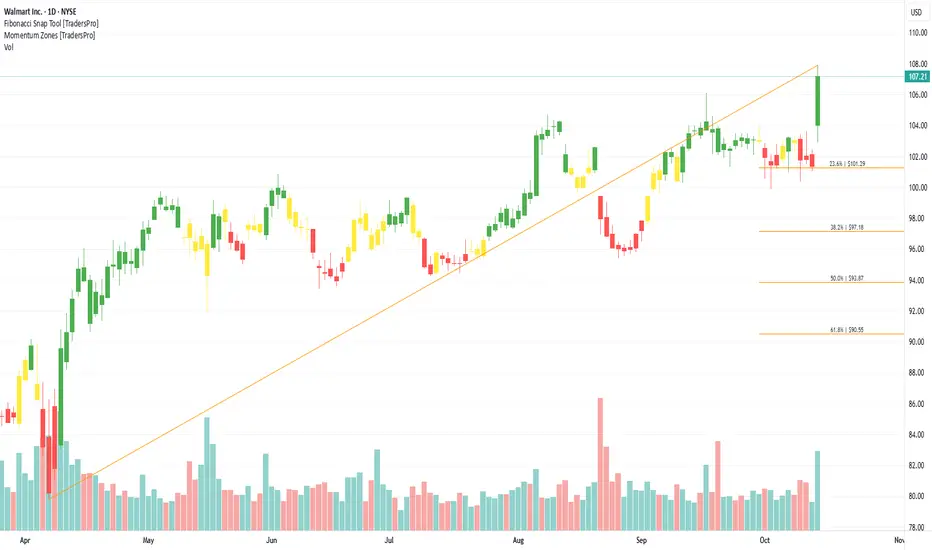
Walmart Inc. (WMT) Builds With AI and Data SolutionsWalmart Inc. (WMT) is the world’s largest retailer, operating thousands of stores and a rapidly growing e-commerce platform serving millions of customers globally. Known for its “Everyday Low Prices,” Walmart offers groceries, household goods, electronics, and apparel. The company’s growth is fueled by its expanding online presence, investments in automation and AI-driven logistics, and consistent focus on affordability that keeps shoppers loyal even in uncertain economies.
On the chart, a confirmation bar with rising volume highlights bullish momentum. The price has entered the momentum zone after moving above the .236 Fibonacci level. A trailing stop can be placed just below this Fibonacci line using the Fibonacci snap tool, helping traders secure profits while staying open to further upside potential.
Walmart (WMT) Stock Direction: Upward Surge on October 15, 2025Walmart (WMT) Stock Direction: Upward Surge on October 15, 2025
As of midday trading on October 15, 2025, Walmart Inc. (WMT) is experiencing a strong upward movement, with shares climbing to 107.31 USD, marking a gain of 5.08% from the previous close. This performance pushes the stock to a new all-time high, surpassing its prior peak of 106.11 USD set on September 17, 2025. The rally is driven primarily by the announcement of a strategic partnership with OpenAI, enabling seamless shopping through ChatGPT with instant checkout features, which positions Walmart at the forefront of AI-driven retail innovation.
Key Market Metrics
- **Price and Change**: Current price at 107.31 USD, up 5.19 USD (5.08%) intraday.
- **Volume**: 17.37 million shares traded, exceeding the average of 15.99 million, indicating heightened investor interest and potential institutional buying.
- **Market Cap**: Approximately 855.41 billion USD.
- **Valuation**: Trailing P/E ratio of 40.64, reflecting premium pricing amid growth expectations.
- **Broader Performance**: Year-to-date return of 19.64%, with a 34.93% gain over the past year, outperforming many retail peers.
Catalyst: OpenAI Partnership
The partnership integrates AI to enhance the shopping experience, allowing users to make purchases directly via ChatGPT. Analysts view this as a leap in "agentic commerce," accelerating Walmart's e-commerce edge and potentially expanding margins through reduced customer acquisition costs. Mizuho reiterated an Outperform rating with a 115 USD price target, highlighting the move as ahead of the curve in AI retail adoption. Overall analyst consensus remains "Strong Buy," with an average 12-month target of 112.95 USD, suggesting further upside potential.
Sentiment and Technical Outlook
Social media buzz on X reflects bullish enthusiasm, with users noting the breakout above key resistance levels like 104 USD and potential targets at 110-120 USD based on Fibonacci extensions and Elliott Wave patterns. Volume spikes and a bullish MACD crossover support sustained momentum, though some caution about profit-taking near upper channel extremes. Institutional flows appear supportive, with over 4,000 funds holding shares and positive reactions to the AI news.
Risks and Considerations
While today's direction is clearly upward, broader market factors like inflation and consumer spending could influence retail stocks. Upcoming earnings on November 20, 2025, will be key, with expectations for continued e-commerce growth. Support levels to watch include 103 USD and 101 USD for any pullback.
In summary, WMT's direction today is firmly upward, fueled by the OpenAI collaboration and robust trading activity, positioning it for potential continued gains in the near term.

Walmart Breaks Out of Double Bottom — Bullish MomentumWalmart Inc. (NYSE:WMT) has confirmed a bullish breakout from a well-defined double bottom pattern , signaling a potential trend reversal from recent consolidation.
📈 What’s Happening:
After forming two distinct troughs near the same support zone, Walmart has broken above the neckline resistance , confirming the double bottom formation.
Price action now suggests that bulls have regained control, setting the stage for further upside momentum.
🧩 Interpretation:
This technical structure typically marks the end of a downtrend and the beginning of a new bullish leg . Sustained price action above the neckline would strengthen the bullish bias and open room for continuation toward the projected target zone.
Reversal from 30D SMA:
price has taken reversal from 30D SMA recently indicating more upward momentum for the stock
🎯 Target: 103.82

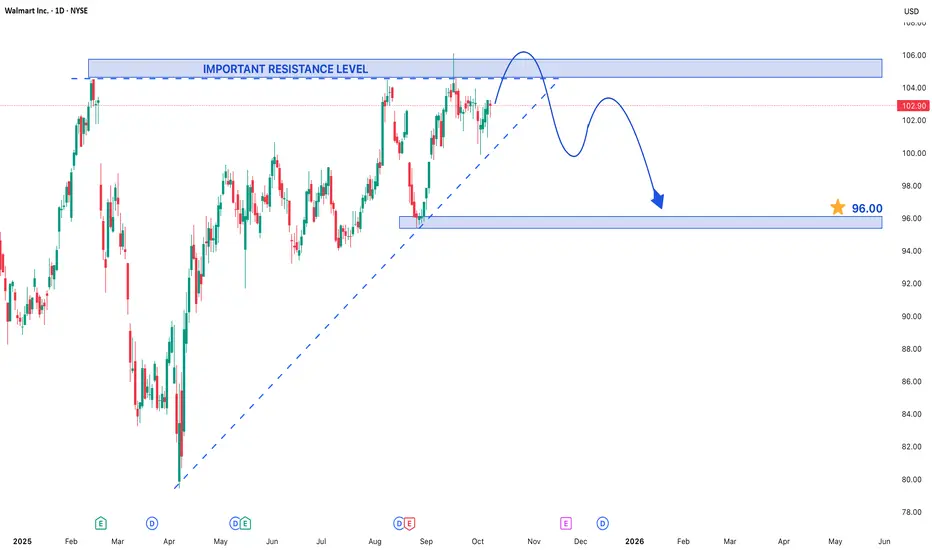
WALMART - KEY LEVELS TO WATCH IN DAILY CHARTThe market is exhibiting a classic ascending triangle pattern, a formation that often precedes a significant breakout. However, the current context adds layers of complexity and caution. Price action is consolidating near a critical resistance level, coinciding with the asset's lifetime high. This is a pivotal moment where the next directional move could be substantial.
A closer look at the recent momentum reveals a potential weakening among buyers. Despite the pattern's typically bullish connotations, the upward surges within the triangle appear to be losing strength, suggesting that buying pressure is faltering at these elevated prices. This divergence often signals that a correction is looming in the upcoming trading sessions. Market participants should therefore prepare for a potential pullback from this overextended zone.
Before any significant downward move occurs, the market may exhibit a final burst of energy to the upside. This is often identified as a liquidity spike, a move designed to trigger buy-stops placed above the lifetime high. A swift, false breakout above the key resistance could suck in late buyers before the trend reverses. On the higher side, the $106 price level is projected to act as a formidable resistance, potentially capping any such spike.
The anticipated correction has a initial target projected around the $96 level. Traders and investors are advised to keep a close watch on the market. Entering positions recklessly at the peak is risky; instead, one should wait for a confirmed breakout or breakdown from the triangle with corresponding volume. Prudence and patience are key to navigating this potentially volatile setup.
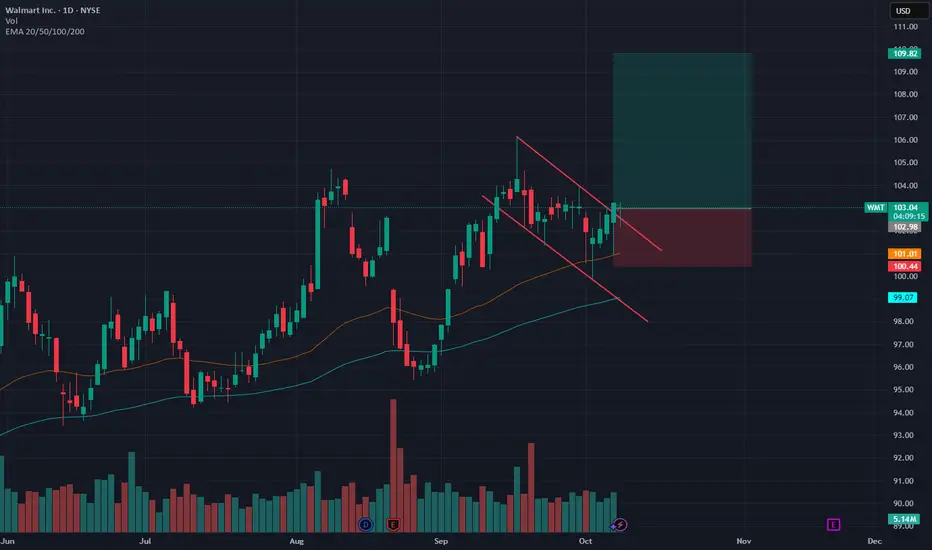
PERFECT WALMART LONGNYSE:WMT has shown strength recently, and is now showing signs of an imminent breakout from its consolidation. The previous HTF break of structure at 104.76 is telling of upside potential. Couple this with its bullish consolidation within a downward channel over the last 3-4 weeks, where price has recently strongly rejected a HTF 0.5fib retracement and the daily 50ema.
Above you can see the major Bollinger band constriction on the daily chart, indicating a very large move in price is getting ready to take place. With the confluence of all these technicals I am willing to say the move will be up. I am targeting a 1.618 fib extension which aligns exactly with a price of 110.
The 4hr timeframe above shows rejection of 50ema and an inside pin, all bullish.
Coupled with the 1hr timeframe below showing a break of structure to the upside with a clean rejection of both 50 and 100 ema. We can enter long on the LTF.
Walmart. Cup and Handle.If WMT breaks into new highs, then this Cup and Handle pattern can lead to strong ascent to 130.

The #1 Stock Buying Secret:Buying Undervalued Stocks A long time ago their was this
Young girl that I pursued.
She said no to my proposal.
She even told me,
"Lubosi I can't be your girlfriend,
My boyfriend works for the mines,
He won't be happy"
This happen during our date when I took her for ice cream.
I felt stupid and like an amateur.
When you enter the Ascending Triangle
+ The Long lower shadow candlestick patterns
You will find this stock.
What I love about this idea
Is the fact that it's following
The 3 month moving average + it's undervalued.
You can see the reversal by using
👉The Stochastic indicator.👈
It's in a oversold channel.
Buying undervalued stocks
Is the Hallmark of trading.
Remember don't use margin.
You want to taste your
Strategies for about 1 year
On a simulation trading account before you use real money.
Rocket Boost This Content To Learn More.
Disclaimer ⚠️ Trading is risky please learn about risk management and profit taking strategies. Also feel free to use a simulation trading account before you use real money.

Walmart PutsNYSE:WMT – Technical Breakdown
Downtrend started Sept 17 → confirmed w/ lower high Sept 30.
Retested trendline Oct 3 & rejected cleanly.
Key level: 101.31
Break + retest already happened — expecting continuation toward 99.81.
Bearish unless price reclaims 102.50+.
#StockMarket #WMT #TechnicalAnalysis

WMT 1H Short Conservative CounterTrend TradeConservative CounterTrend Trade
+ short balance
+ expanding CREEK
+ resistance level
+ biggest volume Ut
+ weak test
+ first bearish bar close entry
Calculated affordable virtual stop
through buying put
1 to 2 R/R take profit
1D CounterTrend
"- long impulse
+ resistance level
+ volumed 2Ut+
+ weak test"
1M CounterTrend
"- long impulse
+ volumed T1
+ resistance level"
1Y CounterTrend
"- long impulse
+ far beyond impulse potential"

Walmart Stock Trading in Bullish Trend - Upside Potential AheadWalmart Inc. (WMT) shares are currently exhibiting a bullish trend, maintaining upward momentum over recent trading sessions. While the stock has been consolidating in a range over the past few days, the broader outlook remains positive, suggesting potential for further gains in upcoming sessions.
Key Observations:
- Established Uptrend: Walmart's price action reflects sustained buying interest, keeping the stock in a bullish phase.
- Range-Bound Consolidation: Recent sideways movement indicates a temporary pause, often a precursor to the next directional move.
- Strong Support & Resistance Levels: The stock has formed clear reference points for traders to watch.
Price Projections:
- Upside Target at $105: A breakout above the current range could propel WMT toward the $105 resistance level, representing a significant upside opportunity.
- Key Support at $90: On the downside, the $90 level has emerged as a strong support zone. Any pullback is likely to find buying interest near this area.
Market Implications:
1. Bullish Continuation Likely: The consolidation within an uptrend typically resolves in the direction of the prevailing trend—in this case, upward.
2. Breakout Potential: A decisive move above the recent range high could accelerate buying momentum toward $105.
3. Risk Management Consideration: While the bias is bullish, a drop below $90 would signal weakening momentum and potentially invalidate the near-term upside scenario.
Trading Strategy:
- Entry: Consider long positions on a confirmed breakout above the range, or on dips near $90 support.
- Stop Loss: A close below $90 would suggest a trend reversal, warranting exit from bullish positions.
- Target: $105 serves as the primary upside objective, with interim resistance levels to monitor along the way.
Final Thoughts:
Walmart’s stock appears poised for further gains, with $105 as the next key target. Traders should watch for a breakout from the current range while keeping an eye on the $90 support level for risk management. As always, confirmation through price action and volume will be crucial for validating the bullish thesis.

WMT deciding the next moveWhen I look at this NYSE:WMT chart, the first thing that jumps out is that big, flat white line at the top.
That’s resistance.
It’s been respected several times.
Each time the price gets up there, sellers step in and push it back down.
Right now, as someone interested in shorting , this resistance zone is the battlefield. If the price fails again here, that’s my chance. I’d be looking to short inside the red sell zone, aiming for a clean retracement of around 4–5%. With a tight stop just above the resistance, I can keep my risk very small while leaving plenty of room for reward. That’s a sweet 3-to-1 risk/reward ratio , which is exactly the kind of setup that makes shorting worthwhile.
It’s not about being right every time; it’s about making sure the wins are bigger than the losses.
But, and this is crucial in trading, I have to respect the other side of the coin.
If that white line breaks with conviction, shorts are in serious danger.
Why?
Because a breakout here wouldn’t just be another move higher, it would be a statement. Buyers would be in control, shorts would get squeezed, and momentum could carry the stock another 10% up before it even thinks about slowing down .
That’s why I never marry one bias. If the resistance breaks, I flip my mindset. I stop thinking like a seller and start thinking like a buyer, looking for long entries in that green buy zone while closing my short.
This is what makes trading exciting to me, it’s not about predicting the future, it’s about reading whats happening and decide properly, like poker.
🟢 For more ideas, follow or subscribe to my newsletter.

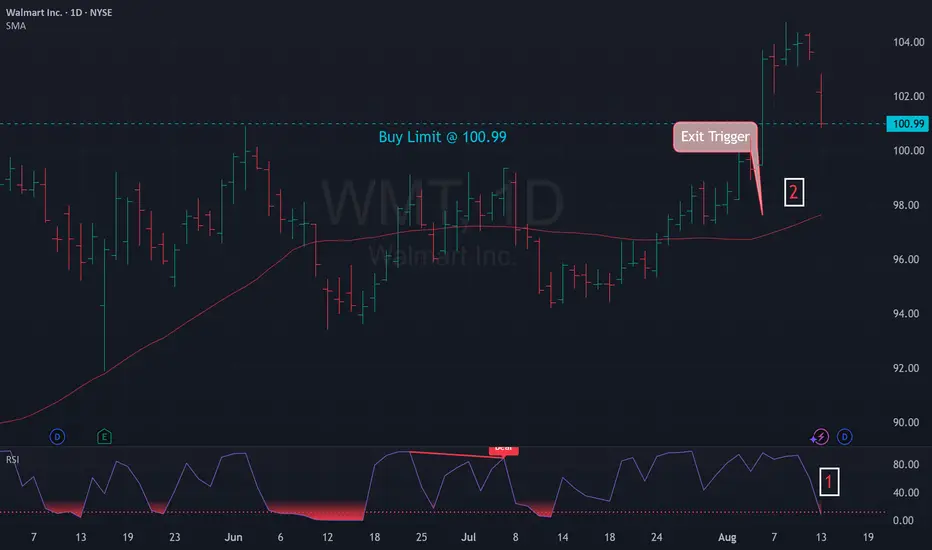
Mean Reversion Setup: WMT1. RSI in oversold region
2. Price likely to rebound back the the mean
Trade Rules:
Entry Trigger - RSI has cross below oversold region, enter limit buy at close price
Exit Trigger - Close at market when close price cross above exit trigger (Red Line)