Exxon Mobil - bearish viewIf a five wave move down will take place, it should target $25/ share
Current structure looks like an incomplete pattern, I assume a flat that is in its latest phase (needs to complete a wave C, that should be an impulse).
Exxon Mobil Corp Shs Cert Deposito Arg Repr 0.1 Shs
No trades
Trade ideas

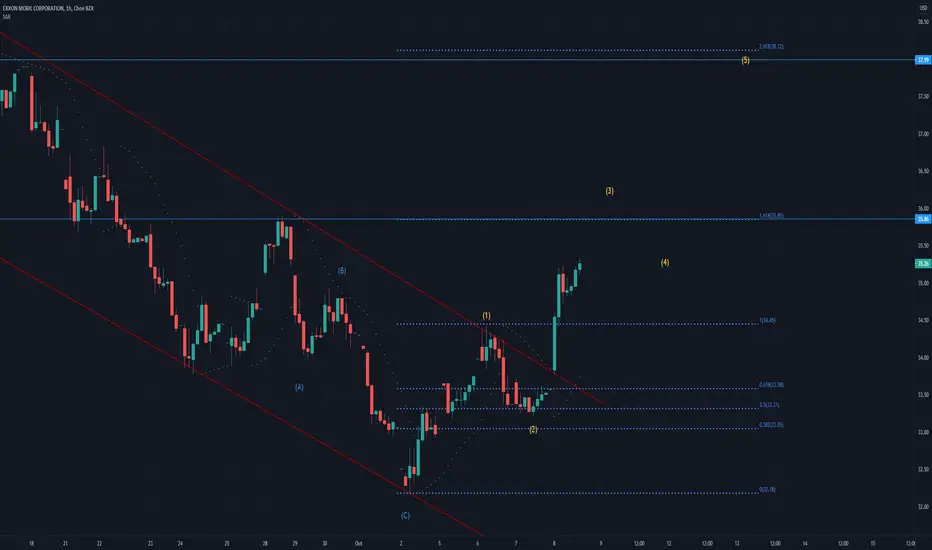
XOM APRIL CALL IS A BRAINDEAD BET 35$Here is my reasoning behind buying these calls.
Trump wins oil companies will boom.
Covid-19 daily new cases are on the last wave with the elliot count.
Daily horizontal support.
TD13 on the weekly.
A lot of volume and momentum setups on the table.
Risk reward ratio is juicy.
Lets rock this thing!


Exxon Mobil The Idea is to hold - wait the end of the bearish trend before going long.
The breakout of the Trendline gives a signal of strength, but it is still to early to go long.
Exxon Mobil (XOM) – Exxon lost 18 cents per share for the third quarter, smaller than the 25 cents a share loss that analysts were expecting. Revenue came in above analysts’ forecasts. Exxon is also planning smaller capital expenditures for 2021, to $16 billion to $19 billion, from $23 billion this year.

$XOM - Exxon Mobile Daily ViewExxon posts lighter than expected Q3 loss, slashes 2021 capex plan - seekingalpha.com
Was thinking this might drop below $30 on this ER but its been holding up. Looking for a swing back up near $34-$38 range.

Three macro levels to a speculative buyThree possible supports on Exxon at COVID-19 lows, wait price acceptance at each level.

XOM - Walk the plankThe american oil industry is on the verge of collapse, at least when we look at Exxon Mobil ... NYSE:XOM
I have great interest in the american oil industry companies such as Exxon Mobil or Chevron, both have made enormous losses since Covid-19 hit the world.
Both Stocks are extremely cheap right now and are possibly setting up for a +100% rallye , at least if we don't break the previous lows.
In the last days i spent several hours looking at the chart and price action of Exxon Mobil , i came to the conclusion that we have formed a very big 1-2 Setup.
Primary scenario: Likelyhood 55%
We are forming a solid 1-2 setup and are setting us up for a 30% rallye to the price target of green wave 1.
Alternative scenario: Likelyhood 45%
My alternative scenario will get triggered if we break the previous low @32.21$, Exxon Mobil will get slaughtered again.
A drop of 15%-20% is very likely and will crush many bullish expectations.
Beware that i don't have any open long positions, i will wait for a solid bullish impulse and then announce my entries!
===================================================================================================================
If you have questions related to a specific stock or the Elliot Wave theory, feel free to contact me.

LONG XOMExpecting bounce from extremely oversold weekly and daily levels. If stop breached, be prepared to catch new daily reversal on lower levels with a tight stop.

Exxon (XOM)XOM back to where it was in 1997. I always hear people say I own XOM because its a "good company" or because it pays a good "dividend". I'll pass, I'd rather put my money where it makes money.

Double BottomPossible stop below 32.15
Possible T2 64.2 to 73
Price is close to long entry level but there is not a confirmed uptrend/Both have to be in place for this pattern to be valid
Not a recommendation


XOM long1st time longing oil stocks, looks like a nice knife catching opportunity as I inticipated oil to bounce of critical support.
Working well so far, will hold most of position until TP2 as long as oil moves higher.


$XOM keeps falling but it can be long chance targeting 60 SL 30Oversold indicators - underperform broad market and almost near March lows . need to be watched carefully as it can be good long opportunity if entered near 30s with long term target at 60 or (100%) . if break down 30 then possible to visit 20 or even 15 so the main condition is to hold above 30 which will form huge double bottoms pattern for long term bullish view and on other side if break down 30 will have deep crap targeting 50% discount.. its quite interesting that big company with good earning is falling like XOM but soon will know the reason behind. good luck

Exxon double bottom reversaldouble bottoms look similar to a W shape, and this one does. the first time price has failed to break the support level at 30.00 which is the first circle. thus if the second price fails to break support again at 30.00 the second time. then the market will possibly shift to an uptrend.
Note: Price does not necessarily have to respect the support level at 30.00 to consider it as a double bottom it may go to 28 or so and still be a double bottom. make sure to analyse yourself, that's important.
does anyone agree with my outlook? feel free to share ideas.

XOM Long, at Demand Zone High quality Fresh Demand Zone ;
RSI Divergence
Entry 33
Stop 30
Target 41; reward:risk=2.5:1
Target 46; reward:risk=4:1
10/30/2020 Earning. Normally, one day before earning, IV will be higher.
I will try option strategy according to earning.
See detailed steps in Trade Active section.
I am not a PRO trader. I need few months to practice trading strategies.
If you like this idea, please use SIM/Demo account to try it, until my trading plans get high winning rate.

$XOM Strong buy at $30 With SPX 2850if the spx can hit 2850 which it can xom should be around 30/31 and a great buy - not advice


EXXON Mobil Corporation is bullish!!!I see some bullish signals on daily and 4h chart for EXXON Mobil Corporation.
Here is my trading plan for Exxon:
There is a gap around 35 so first of all, i expect this gap to be filled then i will aim 36.23 and 36.50.
Stop loss:33.70.
Have a nice day,
Berk.
