ZM long ideaAfter a long downward sloping consolidation we have a breakout which we should see hit the gap AT LEAST which is at $460, then would be the .618 of the overall structure and eventually a retest of the ATH. Along with this you have classic bullish div on the MacD indicating buying pressure. I, personally, would take the position after capturing the .236 as support and placing SL under the recent swing forming. Best of luck and let me know your thoughts on this trade below, thanks!
Zoom Communications, Inc. Shs A Cert Deposito Arg Repr 0.0212766 Sh A
No trades
Market insights

Wyckoff daily reaccumulation on $ZM PT: $1042.50Reaccumulation analysis and price target (using horizontal PNF chart count method).
Potential entry area indicated.

Could Get Some Regression in DOCU and ZM Soon (Charts)ZM is a short below 343 IMO
DOCU is a nice short at 245 or below.
(Opinion/journal only)


ZM broke out of falling wedge patternWatching for a continuation higher and will take a day trade/scalp over $339.79. Will consider swinging depending on price action.

$ZM Trade idea$ZM Trade Idea
Entry: 345
Strike: 6/11 350c
Targets: 351, 360, 365
Support: 335, 324, 313, 308
@TradingView
@KyleTrades86


ZM 6 tap breakoutZM has tested the 335 resistance level 6 times now, decreasing supply with each test, which increases the likelihood for a breakout. Looking for the to breakout to the 355 level where it will then reach another layer of resistance.


$ZM Broken ResistanceZoom shares have broken resistance and could be headed higher. The company still has room to grow and has plenty of potential upside. Like and follow for more ideas like this :) Good Luck!


$ZM with a Bearish outlook following its earnings #Stocks The PEAD projected a Bearish outlook for $ZM after a Positive over reaction following its earnings release placing the stock in drift B
If you would like to see the Drift for another stock please message us. Also click on the Like Button if this was useful and follow us or join us.


Hanging Man at Resistance before Earnings? Guidance Will Be KeyTough setup. Goodluck all. Be safe. (Opinion Only)

$ZM Zoom Video $337 Key Resistance
Hopefully you find the chart helpful in terms of Supports & Resistance etc.
we refrain from adding commentary on the chart as that is reserved for our members and we are very conscious of not giving financial or trading advice.
Thank you for taking time to consult our chart and we would really appreciate a like, follow or comment.

Are Zoom meetings over?In a post-pandemic world, it might be true that investors don't see a lot of room for the price to run higher after earnings.


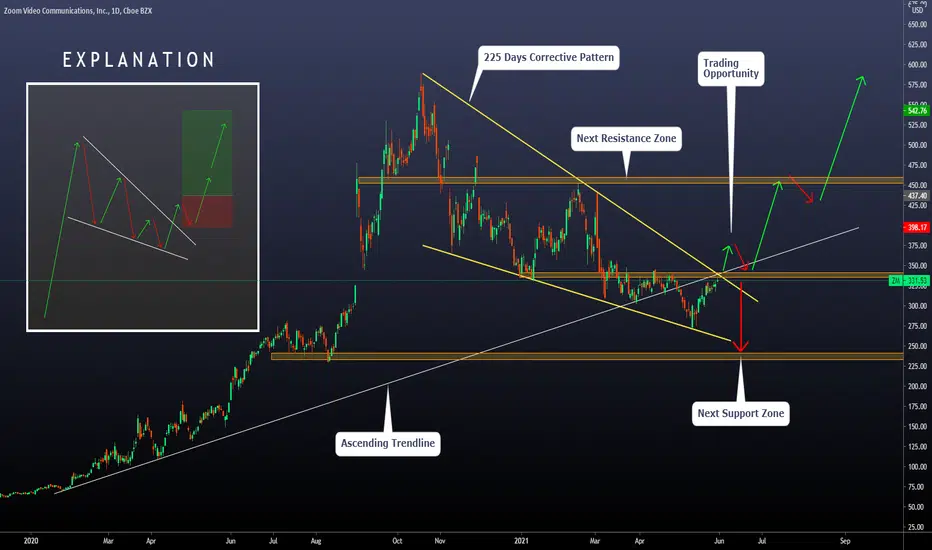
On Zoom, the Corrective Pattern is absolutely finished We have been watching closely zoom for the last weeks looking for the breakout of the massive corrective pattern we are observing right now. After 225 days, the price has tested both sides of the structure, mainly the lower zone. Based on that, we are getting ready for the breakout.
Generally speaking, it is not a good idea to trade a direct breakout of these massive structures. The main reason is that fake-outs are common, and if you are a breakout trader, one of your objectives is to avoid low-quality scenarios as much as you can. For that reason, we have defined a bullish scenario we will be waiting for.
Bullish Scenario: If we observe a breakout of the corrective pattern, we will be waiting for a retest of the broken structure or the resistance level. The formation we want to see must be formed at least for 5 daily candlesticks. Finally, we will trade, as you can see on the EXPLANATION chart. From there, we can aim at two targets, first the next resistance zone and second the previous ATH zone.
Expected Time: If everything goes as expected, we may see a 20 days movement towards the first resistance zone and 50 days towards the new ATH (take these two numbers as approximations)
Bearish Scenario: If the price cannot break the corrective pattern and the resistance zone, we may see a bearish movement towards the next support zone, around 250 - 240. We are not interested in developing any short setups here.
Thanks for reading; feel free to share your view or trading plan in the comments!