SOFI $25 CALLS — Lotto Gamma Play into Friday
# 🚀 SOFI Lotto Gamma Play (Sep 4, 2025) 🚀
💡 Strong call flow (C/P = 2.0) but weak volume + falling RSI → HIGH RISK lotto setup
📊 **Market Snapshot**
* 📉 **RSI:** Daily 56.6 / Weekly 79.3 → both falling (momentum fading)
* 📊 **Volume:** 0.6x prior week → low institutional support
* 🔥 **Options Flow:** Strong bullish (heavy calls)
* 🛡️ **VIX:** \~15.7 → low vol regime (favorable for speculation)
* ⚠️ **1 DTE Risk:** High gamma / theta → premium can go to zero fast
---
## ✅ Trade Idea (high-risk scalp)
* 🎯 **Instrument:** SOFI
* 🔀 **Direction:** CALL (long)
* 💵 **Strike:** 25.00
* 📅 **Expiry:** 2025-09-05 (1 DTE)
* 💰 **Entry Price:** 0.22 (ask at open)
* 🎯 **Profit Target:** 0.44 (+100%)
* 🛑 **Stop Loss:** 0.11 (-50%)
* 📏 **Size:** 1 contract only (tiny risk)
* ⏰ **Max Hold:** Exit by **Friday EOD**
⚡ Confidence: **60%** → Lotto play, not a trend trade
---
### 🔖 Hashtags
\#SOFI #OptionsTrading #DayTrading #0DTE #GammaSqueeze #CallOptions #StockMarket #ScalpTrade #TradingSetup #FlowTrade
6B0 trade ideas

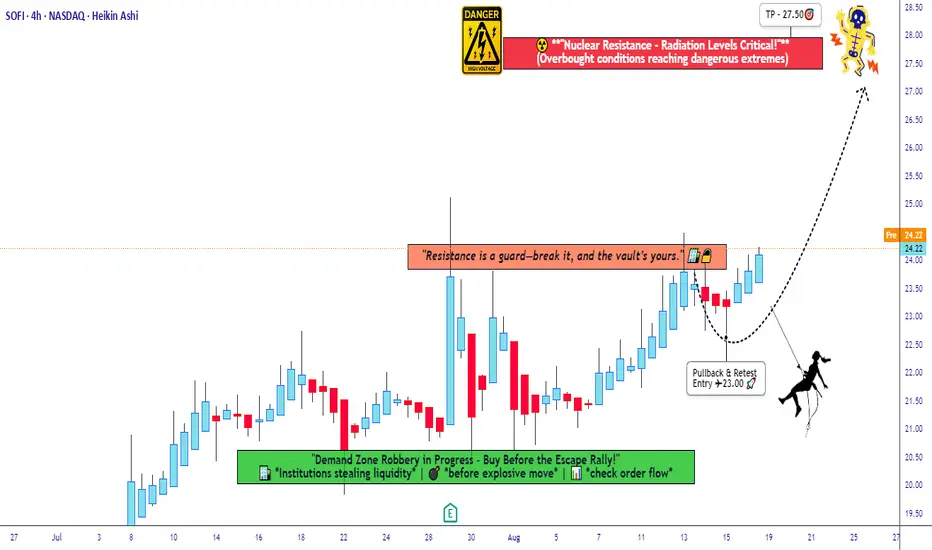
Breaking the Vault: SOFI Bullish Heist Plan Unlocked!🚨💼 SOFI Technologies Stock Heist Plan (Swing Trade) 💼🚨
Dear Robbers, Hustlers & Thief OG’s 🏴☠️💰
This time the target vault is none other than SoFi Technologies, Inc. (SOFI) 📈.
We’re planning a BULLISH STOCK HEIST with a layered entry strategy – the Thief’s signature move.
🕵️ Entry Plan
The heist doors open at ANY price level 🚪💥.
But remember… a real Thief never enters with one strike – we layer in with multiple limit orders (DCA style).
💎 Buy limit layers: 24.00 – 23.50 – 23.00 (you can increase your own layers if greedy 😈).
🛑 Thief Stop Loss (SL)
This is the escape hatch 🚨 – SL @ 22.00.
⚠️ Adjust your SL depending on your risk appetite, capital, and strategy.
(Every Thief OG has their own exit route 🏃💨).
🎯 Target – The Loot!
💥 Heavy resistance (electric fence ⚡) is spotted around 28.00.
So we aim to secure our stolen profits and escape clean at 27.50.
Don’t be greedy – once the vault is cracked, take the bag and RUN 🤑💼.
📢 Final Words from the Thief
Trading is a heist – not every move is safe, but every plan has an escape.
Stick to the layers, respect the SL, and collect the loot at target 🎯.
💖 Smash that BOOST if you’re part of the Thief gang 🔥💼
Let’s rob Wall Street together, one trade at a time 🚀🏴☠️
SOFI - 4hr TAThe "Front-Side" & "Back-Side" support levels reference FVG but labeled as such to simplify the candle being tested.
Backside candle in an accumulation range is the first candle in the range. When it is tested I expect a bigger bounce.
IF that EXPECTATION is not met THEN I expect price to target the Frontside candle or last candle in the range and hold through trend. (order block basically)
If at any point ( on lower timeframes) do distribution candles close under the swinglow of that frontside candle, Price is likely targeting the next range and I expect an influx of volume to confirm the moves direction.
likewise for the Inverse.
Backside candle in a Distribution range is the first candle.
Frontside candle is the last candle in the range.
(always from Left to Right.)

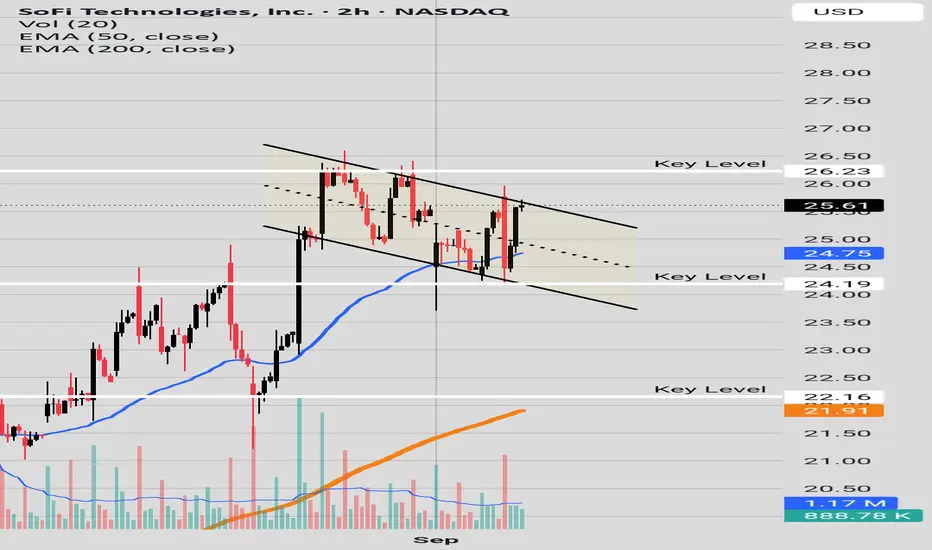
Nail BiterWe have a wedge shape consolidation.
The 200 EMA recently cross the 50 EMA, which at times is a bearish sign.
The wedge shape is facing resistance from the 200EMA and 50EMA.
The RSI is still under 50.
The Bulls and the Bears are going at it.
Watch out for direction of breakout.
Please see chart for key levels.

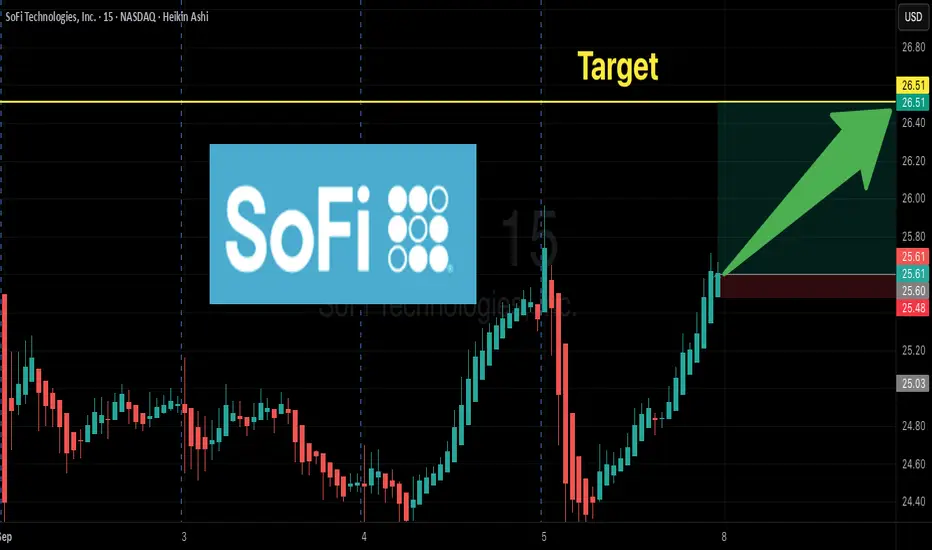
Another View Heiken AshiIt seems we may have a parallel channel and price is the near the resistance, Is SOFI going to pull back or roar higher? We need a break above 25.73 a good close above for the bulls. The bears would welcome a pull back to the 22.00 price area if price does pull back.

Scared? Become a BuyerHello I am the Cafe Trader.
With heightened interest in SOFI, I am seeing many worried posts, and skepticism. Before taking profits early, consider these levels fist.
Years Old Supply.
This Supply zone (marked in the red box) has been sitting here for years. It is no suprise that we get a dynamic reaction at this level.
Welcome to the Range
Now that you know there is a seller sitting there, If this doesn't jump back up and close above 24.71 by friday, expect to be sitting in a range for months.
Bulls are in Control
Even with that massive reacion, All previous bulls are still in tact and ready to accumulate more. Top of demand will fae the most pressure, but there are alot of buyers at that strong demand level. Be patient, and you can get great pricing.
Long Term
For those looking to get into SOFI, I have some prices that should line up with your personal sentiment.
FOMO Aggressive = $21.67 ( i dont recommend)
Aggressive = 20.40
Good price = 17.50 - 17.75
STEAL - 7.50-9.50
That's all for SOFI. Comment below if you want to see any other analysis!
Happy Trading
@thecafetrader

Can SOFI reach $30.00 ? SoFi Technologies has successfully broken out of a falling channel, reclaiming the $13.00 level — now acting as a strong support and technical base. This breakout follows a clear downtrend rejection structure (marked by multiple red arrows), and is now transitioning into a bullish reversal pattern.
📊 Technical Highlights
Breakout Point: $13.00 – now confirmed as strong support.
Structure: Bullish flag/channel breakdown followed by a clean breakout and retest setup.
Pattern Projection Target: $30.32 (based on flagpole extension), indicating a potential 137% upside.
Short-Term Resistance: $16.58 (local top), then $18.41.
Support Zone: $13.00 key level to hold for bullish continuation.
Volume: Elevated volume on breakout candles, confirming strong demand absorption at breakout.
🧠 Trade Expectation
Price may enter a short period of consolidation or shallow pullbacks above $13 before stair-stepping higher through $16.50 and $18.40. If momentum sustains, a measured move to the $30 zone is achievable.

$sofi is beyond short in any scenario SoFi (SOFI) presents a compelling short opportunity heading into the key economic data, as both likely macroeconomic outcomes create significant headwinds for its premium valuation. The core vulnerability is its ~60x forward P/E ratio, which prices in flawless execution and high growth. Any macroeconomic surprise threatens this narrative, making multiple contraction highly probable.
In a strong data scenario (economic resilience), the implications are unambiguously negative. This would push Federal Reserve rate cuts further into the future, causing Treasury yields to rise. For SoFi, this means the cost of funding its loans would remain elevated, squeezing its net interest margin. Crucially, higher-for-longer interest rates severely dampen consumer demand for its core products—personal loans, mortgages, and student loan refinancing—directly threatening its growth trajectory. The market would likely punish this growth scare with a severe derating of its high multiple.
A weak data scenario (economic softening) offers a mixed fundamental picture but will likely be interpreted bearishly by the market. While lower rates could stimulate some loan demand, the immediate focus will shift to credit risk. A slowing economy increases the probability of rising delinquencies and loan defaults within SoFi's consumer-focused portfolio. For a stock priced for perfection, this introduction of uncertainty and potential future credit costs is often a catalyst for selling. The market will likely focus on this risk rather than potential future volume growth.
The recent firing of a Federal Reserve official adds a layer of political uncertainty to monetary policy, which typically triggers a risk-off sentiment. High-growth, high-multiple stocks like SoFi are disproportionately sold in such environments. While company-specific news could theoretically offset these macro forces, the overwhelming pressure from the upcoming data release and the precarious technical setup suggest the path of least resistance is down. A break below key support levels could trigger a swift decline toward the $18 area.
Trading Implication: The confluence of macro sensitivity, rich valuation, and heightened uncertainty creates a high-probability short setup. Risk management, such as a stop-loss order to account for any unexpected positive news, remains essential.
Breaking: SOFI’s Momentum Points to Upside on Strong Earnings
Current Price: $25.02
Direction: LONG
Targets:
- T1 = $27.00
- T2 = $29.50
Stop Levels:
- S1 = $24.00
- S2 = $23.00
**Wisdom of Professional Traders:**
This analysis synthesizes insights from thousands of professional traders and market experts, leveraging collective intelligence to identify high-probability trade setups. According to trader sentiment, SOFI is positioned favorably due to strong fundamentals, earnings momentum, and improving market conditions. The aggregated wisdom highlights that institutions are recognizing SOFI’s ability to perform as a growth stock in the increasingly competitive fintech space.
**Key Insights:**
SOFI has carved out a unique position as a leader in online financial services, benefiting from an aggressive focus on innovative lending and banking solutions. Their recent expansion into personal loans and strong performance in new membership acquisition signal healthy growth and market penetration. The company has demonstrated robust revenue gains driven by cross-selling opportunities and diversified product offerings.
Technical analysis points to bullish momentum with a steady upward trajectory in SOFI’s price action over the past month. Volume has also supported the move higher, suggesting confidence from traders. Key resistance levels at $25 were recently breached, turning former resistance into new support, with upside potential driven by strong investor sentiment and stabilizing macroeconomic conditions.
**Recent Performance:**
SOFI’s price has seen a solid rally in the last quarter, gaining momentum after reporting better-than-expected earnings. The stock has exhibited resilience while broader markets have been volatile, showcasing relative strength. On a year-to-date basis, SOFI’s price performance has outpaced many of its peers in the fintech sector, signaling growing institutional interest.
**Expert Analysis:**
Analysts have highlighted SOFI's successful transition from niche fintech to a scalable platform with compelling growth prospects. The company continues to innovate, with management adopting aggressive strategies to capture market share in digital banking services. From a technical perspective, SOFI’s recent movement above its 200-day moving average indicates strong buyer confidence, while momentum indicators such as the RSI remain in bullish territory, signaling an extended rally.
Experts also underscore SOFI’s strong balance sheet, improving profitability metrics, and the recent expansion into new product categories as signals that the company could outperform in the coming quarters. Risk levels appear manageable, while the reward-to-risk ratio favors bullish positioning.
**News Impact:**
SOFI’s recent earnings report revealed significant revenue growth and membership increases, further reinforcing confidence in its ability to scale rapidly. Moreover, recent announcements regarding partnerships and acquisitions aimed at enhancing operational capabilities have positively impacted the stock. The strengthening labor market and increasing demand for consumer credit in post-pandemic recovery are also key tailwinds for SOFI's business model.
**Trading Recommendation:**
Based on SOFI’s strong fundamentals, bullish price action, recent performance, and favorable technical indicators, taking a LONG position appears prudent. Momentum suggests that targets of $27.00 and $29.50 are both achievable within short- to mid-term timeframes, while stop levels at $24.00 and $23.00 balance risk adequately. With improving financial results and increased institutional interest, SOFI has the potential to outperform as broader fintech adoption accelerates.
Do you want to save hours every week? Register for the free weekly update in your language!

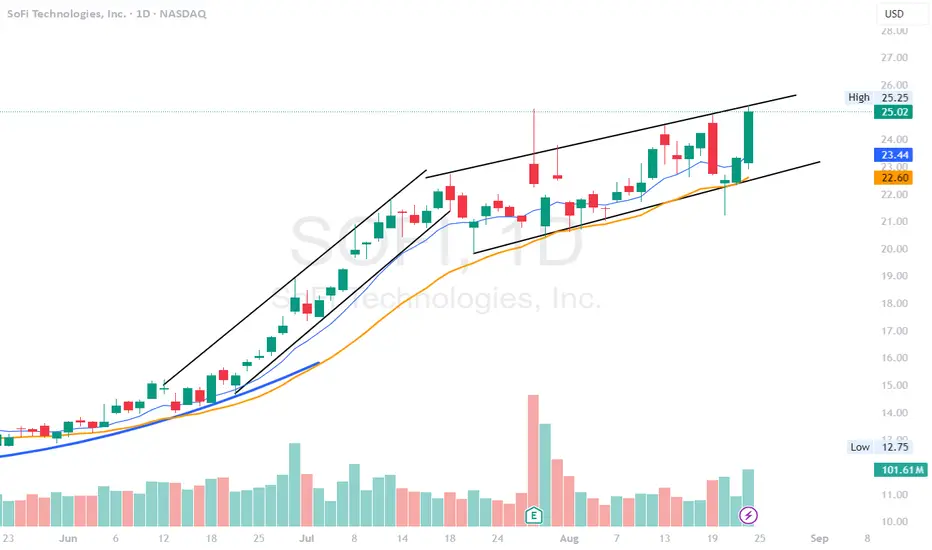
SOFI - channel breakout after hours.SOFI - Stock Held 21 EMA levels on the daily. stock in uptrend channel and broke above $25 resistance level after hours. Possible more upside as long as $25 holds . next resistance at $30
SOFI $26.50Call – 100% Profit Potential in 5 Days?
🚀 **SOFI Weekly Bullish Alert! \$26 Call Play 💎🔥**
📈 **Strong Call Flow + Rising RSI → Short-Term Bounce Potential!**
**Trade Snapshot:**
* **Instrument:** SOFI
* **Strategy:** Buy Call (single-leg, naked)
* **Strike:** \$26.50
* **Expiry:** 2025-09-12 (Weekly)
* **Entry Price:** \$0.65 (ask at open)
* **Profit Target:** \$1.30 (+100%)
* **Stop Loss:** \$0.33 (50%)
* **Size:** 1 contract
* **Confidence:** 75%
**Rationale:**
* 🔹 Daily & Weekly RSI bullish; strong momentum
* 🔹 Call/Put ratio = 1.80 → institutional bullish skew
* 🔹 Low VIX → cheap premium for a tactical short-term play
* 🔹 Weak weekly volume → risk-managed sizing & tight stop required
**Key Notes:**
* Exit by Thursday to avoid Friday gamma/time-decay
* Watch pre-market gap; stand aside if weak follow-through
* Partial profit-taking possible at +50% (\$0.98)
📊 **Summary:** Strong institutional bullish options flow + rising momentum make \$26 calls a high-probability short-term trade. Risk-managed, tactical entry, 100% profit target.
Break out neededSofi has bearish divergence on the weekly chart. But on the 2 hr chart we see a possible bullish flag forming, If price does not break out we may see a return to the 50 EMA in blue around 24.75. Please see chart for key levels.
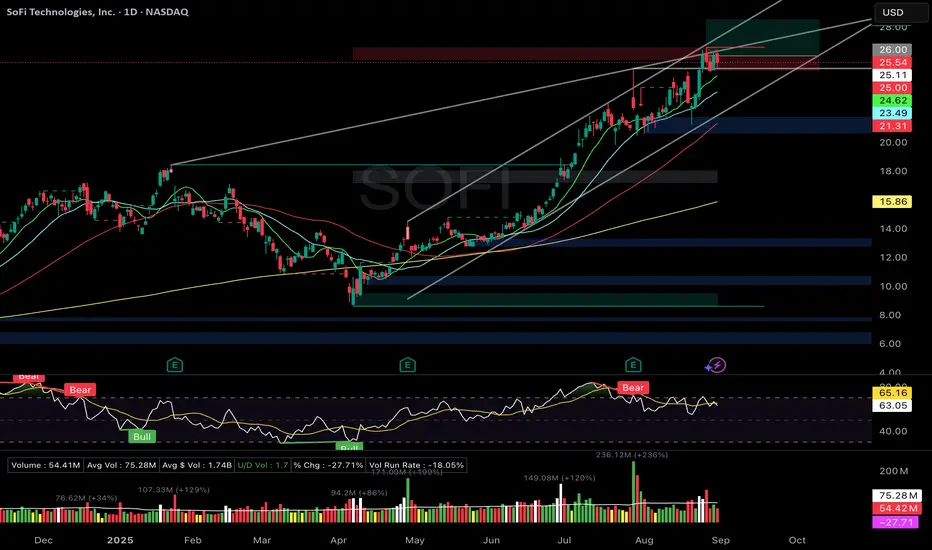
Bullish Formation Suggests Upside Potential Current Price: $25.54
Direction: LONG
Targets:
- T1 = $28.00
- T2 = $30.50
Stop Levels:
- S1 = $24.50
- S2 = $23.80
**Wisdom of Professional Traders:**
This analysis synthesizes insights from thousands of professional traders and market experts, leveraging collective intelligence to identify high-probability trade setups. The wisdom of crowds principle suggests that traders often note recurring signals in SoFi Technologies' technical charts and sectoral trends, contributing to a clearer outlook. The aggregated analysis highlights SoFi’s ability to outperform in the current fintech-driven landscape due to its robust customer-centric model and digital financial services.
**Key Insights:**
SoFi Technologies (NASDAQ: SOFI) has solid fundamentals and is well-positioned within an expanding market for fintech services. The company continues to benefit from macro trends, including the shift toward digital financial tools and banking consolidation driven by consumer needs for accessible solutions. Its recent membership growth trajectory is aligned with innovative offerings such as student loan refinancing, personal loans, and investment platforms, which attract young, affluent tech-savvy individuals.
Moreover, recent technical analysis points to strong support levels and gradual volume accumulation signaling bullish interest. A streamlined financial operations model paired with increasing market penetration lends weight to the upward trajectory forecasted. Analysts also note the resilience of SoFi to macroeconomic headwinds. Current price action appears primed for a breakout near its recent consolidation zone.
**Recent Performance:**
SoFi shares showed strong performance over the past months, recovering from 2023's broader market volatility. The stock has recently hovered between $23 and $26 levels, with a consistent trading volume suggesting active investor engagement. Additionally, it has outperformed peers in tech-heavy financial stocks, fueled by confidence in its growth strategy and ability to scale profitably.
**Expert Analysis:**
Industry experts agree that SoFi’s long-term prospects hinge on its innovative fintech offerings and increasing customer base. Its uniquely diversified revenue streams across lending, investing, and credit card services allow it to capture market share efficiently. Analysts also underscore recent earnings reports showcasing improved profitability metrics, which signal that the company is moving forward on a sustainable growth path. The Relative Strength Index (RSI) and Moving Average Convergence Divergence (MACD) indicate bullish momentum, with price action maintaining its position above key moving averages.
**News Impact:**
Recent favorable sentiment regarding student loan forgiveness policies and interest rate stabilization positively impacts SoFi’s outlook, as both factors are critical for its lending business model. Additionally, news of strategic acquisitions and partnerships strengthens SoFi’s market position within the fintech ecosystem, creating optimism around future growth trajectories.
**Trading Recommendation:**
Given the blend of strong fundamentals, positive technical signals, and favorable macro trends, traders may consider a bullish position on SOFI. The current price action near $25.54 provides a reasonable entry point with upside targets of $28.00 and $30.50 as the stock approaches its next breakout zone. Stop-loss levels are recommended at $23.80 and $24.50 to manage downside risk effectively. SoFi's long-term growth potential and bullish sentiment make this a compelling opportunity for traders focused on growth-oriented fintech investments.
Do you want to save hours every week? Register for the free weekly update in your language!
$SOFI flag setup in progress.NASDAQ:SOFI flag setup in progress.
– Strong Stage 2 trend above 21/50/200d
– Breakout on heavy volume, pullback on light volume
– RSI cooling near 63, earnings momentum strong
– Watching $27.50 for breakout confirmation
High-probability continuation if volume steps in.
#TechnicalAnalysis #SOFI #SwingTrading
SOFI LEAP Call Setup: Long-Term Fintech Moonshot?
# 🚀 SOFI LEAP Call Setup: Long-Term Fintech Moonshot? 💎📈 (2025-08-22)
📊 **Market Consensus Recap**
* 📈 Weekly RSI: 84.3 → strong bullish momentum
* 📉 Monthly RSI: 63.1 → fading momentum, overextended zone (99.1% of 52-week range)
* 💵 Institutional Flow: Neutral (Call/Put OI ratio = 1.00)
* 🌪 Volatility: Favorable (low VIX = good LEAP environment)
* ⚠️ Risk: Extreme valuation → caution on new entries
---
# 🎯 TRADE PLAN
* 🏦 Instrument: **\ NASDAQ:SOFI **
* 📈 Direction: **CALL (LONG)**
* 🎯 Strike: **27.00**
* 💵 Entry: **6.00**
* 🛑 Stop Loss: **4.20 (-30-40%)**
* 🎯 Profit Target: **11.40**
* 📅 Expiry: **2026-09-18**
* 📏 Size: **1 contract**
* 📈 Confidence: **75%**
* ⏰ Entry Timing: **Market Open**
---
⚠️ **Key Risks**
* 🚨 Overvalued at near 52-week high (99.1%)
* 📉 Potential correction to \$15–\$18 before next leg
* 📰 Macro/news shocks may hit fintech sentiment
---
# 📌 Hashtags
\#SOFI #OptionsTrading #LEAPs #StockMarket #LongTermInvesting #BullishSetup #Fintech #OptionsFlow #SmartMoney #TradingSignals #BreakoutTrading #SwingTrade

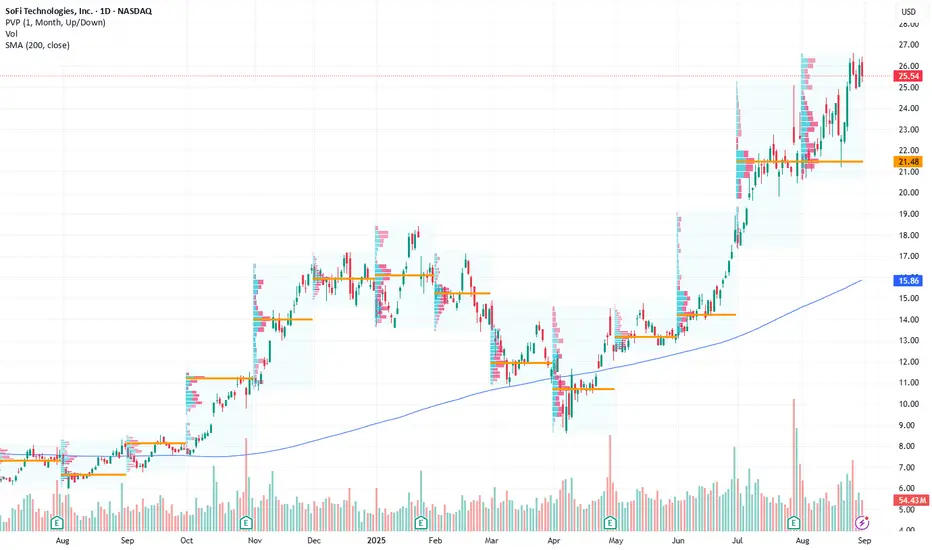
SoFI had a great run, but a healthy throwback is onSoFi is great stock. And it had a great run recently. Now it seems like the run has hit a HTF wall, and thus I expect either a horizontal distribution or immediate throwback before any continuation can occur.
I will refrain from any predictions otherwise, I'd rather wait for more PA to unfold. Anyway, if you are still in I would trim a lot here.

SOFI's Breakout Potential: Could $28 Be Just Around the Corner? Current Price: $23.77
Direction: LONG
Targets:
- T1 = $26.50
- T2 = $28.00
Stop Levels:
- S1 = $22.50
- S2 = $21.00
**Wisdom of Professional Traders:**
This analysis synthesizes insights from thousands of professional traders and financial experts, highlighting consensus opportunities in SOFI's growth trajectory. By aggregating views from forums, institutional investors, and expert transcripts, we highlight potential high-probability setups that align with technical strength and fundamental optimism. This collective intelligence approach reduces individual biases while providing clarity around potential upside in SOFI following its recent bullish movement.
**Key Insights:**
SOFI Technologies remains one of the most compelling growth stocks in the financial tech sector, capitalizing on its unique combination of banking services and technology-driven innovation. The recent rise in SOFI's market presence stems from its dominant position in high-margin businesses, such as student loans, personal lending, and its growing footprint in digital banking. Analysts point to SOFI's ability to increase customer acquisition at a rapid pace, particularly among Millennials and Gen Z, who favor its mobile-first banking solutions.
On the macroeconomic side, traders suggest SOFI’s resilience during periods of higher interest rates as a noteworthy characteristic. Higher rates generally pressure lending stocks, yet SOFI continues to expand its effective margins and streamline operational efficiencies. Additionally, technical charts show SOFI consolidating above critical support levels, indicating a potential for another bull run if the $24.50 resistance level is decisively broken.
**Recent Performance:**
SOFI has shown impressive resilience over recent weeks, gaining nearly 15% from lows around $20 per share. Price action last week revealed higher-than-average trading volumes, signaling increased interest from institutional buyers ahead of earnings. SOFI narrowly avoided key downside risk after beating analysts' revenue expectations, further boosting its appeal in long-term portfolios. The stock’s momentum has led it to flirt with the $24 level, indicating burgeoning optimism among market participants.
**Expert Analysis:**
Institutional analysts argue that SOFI could benefit immensely from its diversified business model as the trend toward financial decentralization grows stronger. A key feature driving growth has been SOFI's ability to cross-sell its products effectively. For example, users who originally join for loans quickly explore its checking and investing services, increasing revenue per customer. From a valuation standpoint, experts note SOFI still trades at a discount relative to sector peers, making it a rare mix of growth and value.
Technically, SOFI is forming a bullish "ascending triangle" pattern, suggesting a breakout could drive prices toward $28 in the medium term. Momentum indicators such as the MACD histogram are turning positive, confirming growing buying pressure. Traders also highlight that SOFI’s relative strength index (RSI) is hovering below overbought levels, indicating that the rally still has room to grow.
**News Impact:**
Recent news surrounding SOFI’s expansion into additional states for its chartered bank division is a promising development. By increasing its lending power, SOFI could magnify its competitive edge against traditional financial institutions. Furthermore, coverage of SOFI's growing partnerships in credit-building services has strengthened confidence in its ability to attract younger generations, which other banks struggle to convert. Items from last week's Federal Reserve commentary also remain mildly supportive of SOFI's business model, as potential caps on rate increases reduce future cost pressures.
**Trading Recommendation:**
Take a long position in SOFI as bullish technical patterns and strong fundamental catalysts align. With compelling expansion opportunities, robust recent performance, and improving sentiment from institutional traders, SOFI could easily test $26.50 in the short term and $28.00 thereafter as resistance levels are cleared. Setting stops at $22.50 and $21.00 provides risk protection should unexpected volatility arise. Consider accumulating as SOFI proves itself a leader in fintech innovation.
Do you want to save hours every week?

Watchlist Wednesday - $SPY, $MS, $SMH, $ASPI, $XLC, $XLK, $SOFIWatchlist Wednesday - AMEX:SPY , NYSE:MS , NASDAQ:SMH , NASDAQ:ASPI , AMEX:XLC , AMEX:XLK , NASDAQ:SOFI

Getting ready for another Sofi longSofi as expected had tremendously good earnings. The CEO is executing and I believe this will continue. At the current moment most of my Sofi trades have been LEAPs. I am planning on entering again with ultra safe in the money options. Stochastic is resetting, volatility was heating up and needs to cool off. Their stock offering right as the stock pumped was a good idea to quell the pump imo, and to get a good deal on offered shares (20.85$ share price). The fact that the stock has maintained the 5 EMA on the weekly for so long is astounding to me.
My plan:
If Sofi moves into the buy zone I will buy Jan 2027 15/17$ spread calls for exposure in my long account. I may or may not keep these to exercise, but I want exposure again. The last time I did this I rode them up 400-650%.
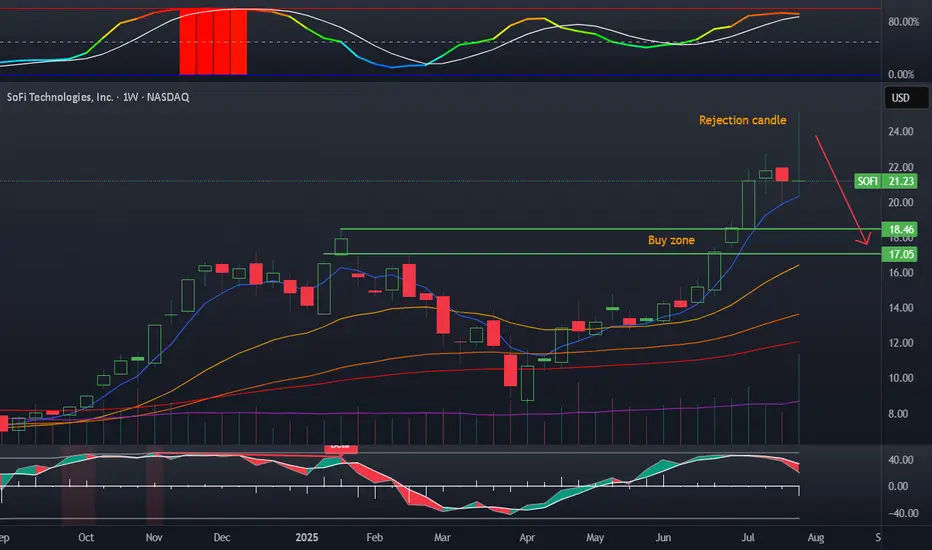
Sofi update dailyDespite my bearish post and a potential rejection candle. Sofi has chosen to keep chugging along. I will remain out of this trade, but am eyeing this heavily. I am seeing hidden bearish divergence, and a reset of volatility, which is needed.
I will sit on my hands here and wait for Sofi to do what Sofi does, it loves to give these back. A healthy 20% correction would be good for long-term price action as well. I will be loading up on LEAP spreads if we get there.

SOFI Bullish Momentum Offers Upside Opportunity for TradersCurrent Price: $22.10
Direction: LONG
Targets:
- T1 = $23.10
- T2 = $24.00
Stop Levels:
- S1 = $21.58
- S2 = $20.94
**Wisdom of Professional Traders:**
This analysis synthesizes insights from thousands of professional traders and market experts, leveraging collective intelligence to identify high-probability trade setups. The wisdom of crowds principle suggests that aggregated market perspectives from experienced professionals often outperform individual forecasts, reducing cognitive biases and highlighting consensus opportunities in SOFI.
**Key Insights:**
SOFI is currently displaying strong bullish momentum with its price holding firmly above all significant moving averages. Market sentiment analysis reveals a substantial 27.5-point increase, showcasing heightened optimism around the stock. This bullish inclination is further supported by the stock's stability above critical support levels, suggesting potential continued upward price movement.
Institutional interest is likely contributing to these indicators. Long-term investors could view these patterns as an entry point for portfolio additions, while short-term market participants may capitalize by targeting the outlined price objectives to optimize returns. Overall, technical signals reinforce the strength of the current uptrend.
**Recent Performance:**
SOFI has demonstrated robust performance recently, with its trading activity surpassing both last week's closing price and its prior day's close. In addition, the stock has remained above all major moving averages (9-day, 20-day, 50-day, 100-day, and 200-day), affirming its ongoing momentum and reinforcing the bullish outlook.
**Expert Analysis:**
Technical analysts point to SOFI’s sustained positive performance as an indicator of broad investor confidence in the stock. The bullish price action highlights an accumulation phase, potentially driven by institutional buyers. With no immediate negative catalysts, SOFI's chart pattern suggests an upward trajectory. Traders should remain cautious, however, and employ strategically set stop losses to safeguard against unexpected volatility.
**News Impact:**
No substantial company-specific developments or events have been reported recently regarding SOFI, suggesting that the current price action is being driven primarily by technical factors and market sentiment. However, traders should remain attentive to macroeconomic news or updates related to the FinTech sector that could impact SOFI's valuation dynamics.
**Trading Recommendation:**
Based on technical and sentiment-driven analysis, a LONG position in SOFI aligns with its strong momentum and bullish signals. The targets of $23.10 and $24.00 represent key price levels with potential for near-term gains, while stop-loss levels at $21.58 and $20.94 offer prudent risk management. This setup provides a high-probability opportunity for disciplined traders, but as always, maintaining vigilance on external news factors is crucial for strategy adjustments.

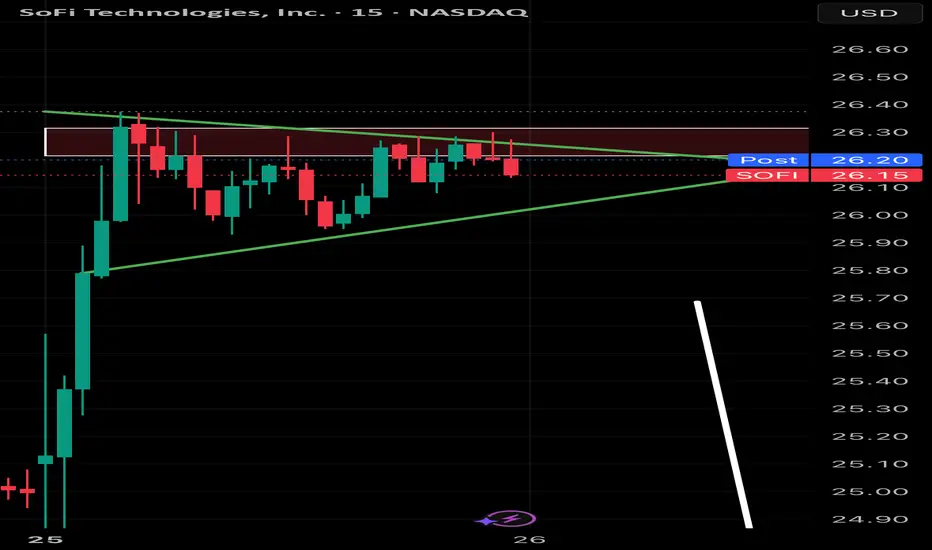
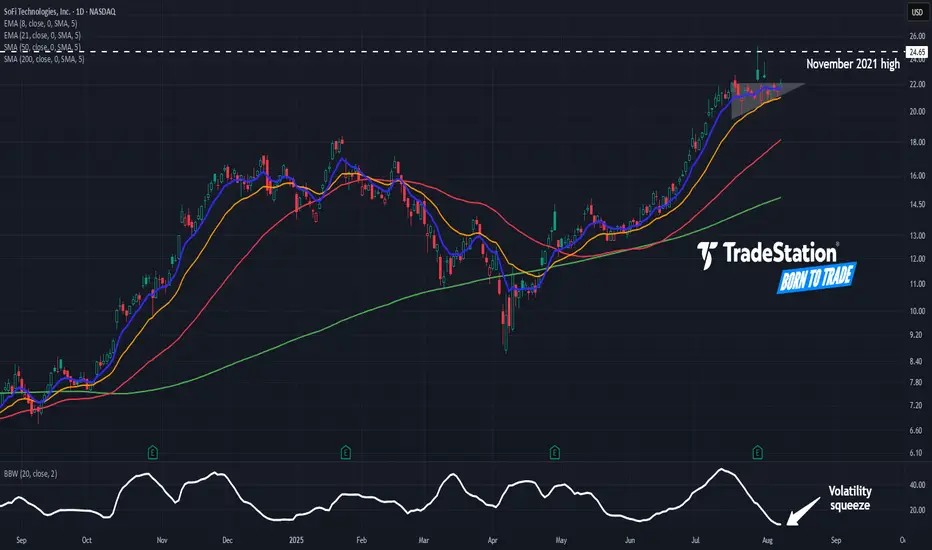
SoFi: Ascending TriangleSoFi Technologies rallied sharply in June and early July. Now, after a pause, some traders may see further upside.
The first item on today’s chart is the July 17 close of $22.09. The financial stock has remained mostly trapped below that level while making higher lows. The resulting ascending triangle is a potentially bullish continuation pattern.
Second, Bollinger Band Width has narrowed to its lowest reading since June 2024. Such tight consolidation may reflect a lack of selling pressure.
Third, the 8-day exponential moving average (EMA) has remained above the 21-day EMA. That may reflect bullishness in the short term.
Next, prices are consolidating below previous record highs from 2021. (The peaks then ranged from $24.65 to $28.26.) Could the stock challenge its old highs?
Finally, SOFI is an active underlier in the options market. Its average volume of 411,000 contracts would rank 11th in the S&P 500 (if it were a member), according to TradeStation data. That could help traders take positions with calls and puts.
TradeStation has, for decades, advanced the trading industry, providing access to stocks, options and futures. If you're born to trade, we could be for you. See our Overview for more.
Past performance, whether actual or indicated by historical tests of strategies, is no guarantee of future performance or success. There is a possibility that you may sustain a loss equal to or greater than your entire investment regardless of which asset class you trade (equities, options or futures); therefore, you should not invest or risk money that you cannot afford to lose. Online trading is not suitable for all investors. View the document titled Characteristics and Risks of Standardized Options at www.TradeStation.com . Before trading any asset class, customers must read the relevant risk disclosure statements on www.TradeStation.com . System access and trade placement and execution may be delayed or fail due to market volatility and volume, quote delays, system and software errors, Internet traffic, outages and other factors.
Securities and futures trading is offered to self-directed customers by TradeStation Securities, Inc., a broker-dealer registered with the Securities and Exchange Commission and a futures commission merchant licensed with the Commodity Futures Trading Commission). TradeStation Securities is a member of the Financial Industry Regulatory Authority, the National Futures Association, and a number of exchanges.
Options trading is not suitable for all investors. Your TradeStation Securities’ account application to trade options will be considered and approved or disapproved based on all relevant factors, including your trading experience. See www.TradeStation.com . Visit www.TradeStation.com for full details on the costs and fees associated with options.
Margin trading involves risks, and it is important that you fully understand those risks before trading on margin. The Margin Disclosure Statement outlines many of those risks, including that you can lose more funds than you deposit in your margin account; your brokerage firm can force the sale of securities in your account; your brokerage firm can sell your securities without contacting you; and you are not entitled to an extension of time on a margin call. Review the Margin Disclosure Statement at www.TradeStation.com .
TradeStation Securities, Inc. and TradeStation Technologies, Inc. are each wholly owned subsidiaries of TradeStation Group, Inc., both operating, and providing products and services, under the TradeStation brand and trademark. When applying for, or purchasing, accounts, subscriptions, products and services, it is important that you know which company you will be dealing with. Visit www.TradeStation.com for further important information explaining what this means.
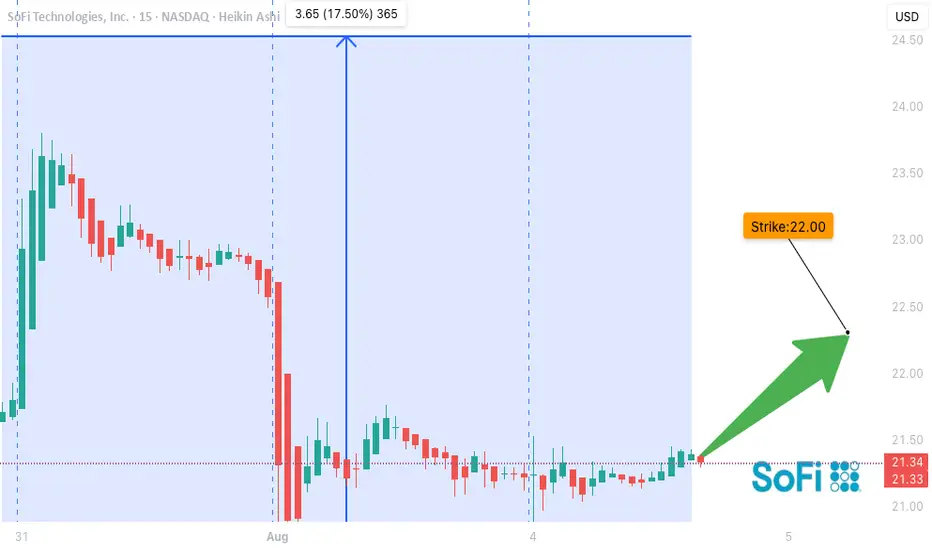
SOFI Setup Before Gamma Squeeze?
## 🐂 **SOFI WEEKLY OPTIONS BREAKOUT SETUP (Aug 4–8)**
**🔥 Bullish Momentum + Institutional Volume Surge = \$22 CALL in Play**
---
### 📌 Summary:
* **Weekly RSI** rising 📈
* **Volume** 2.5x average – strong institutional presence 🏦
* **Options Flow** favors calls: aggressive accumulation
* **Gamma Risk** into Friday + VIX stable ✅
* **Daily RSI** soft = potential dip before rip
---
### 🛠️ Trade Setup:
| Type | Direction | Strike | Expiry | Entry | Stop | Target | Confidence |
| ------ | --------- | ------- | ------ | ------ | ------ | ------ | ---------- |
| Option | CALL | \$22.00 | Aug 8 | \$0.34 | \$0.17 | \$0.68 | 70% ✅ |
💡 **Watch for breakout over \$21.50** — potential gamma squeeze to \$23+
📉 Manage risk below \$21.00 / VIX spike
⚠️ Earnings & macro could add volatility
---
### 🧠 Model Consensus:
* **Grok/xAI**: Strongly bullish, confirms flow & breakout potential
* **Claude & Meta**: Volume confirms upside, but caution on RSI
* **Gemini**: Neutral on daily, bullish long-term
* **DeepSeek**: Momentum trend intact, supports call strategy
---
### 📊 Tag Zone:
`#SOFI #Options #TradingView #Bullish #GammaSqueeze #CallOption #VolumeBreakout #WeeklySetup #MomentumTrading #SmartMoney`