HUNER (1D) — Seller Bias After OB Cluster; Descending BA SlopesHUNER (1D) — Seller Bias After OB Cluster; Descending BA Slopes, 4.00 Support Under Test
Executive read (VPA, 55-bar window)
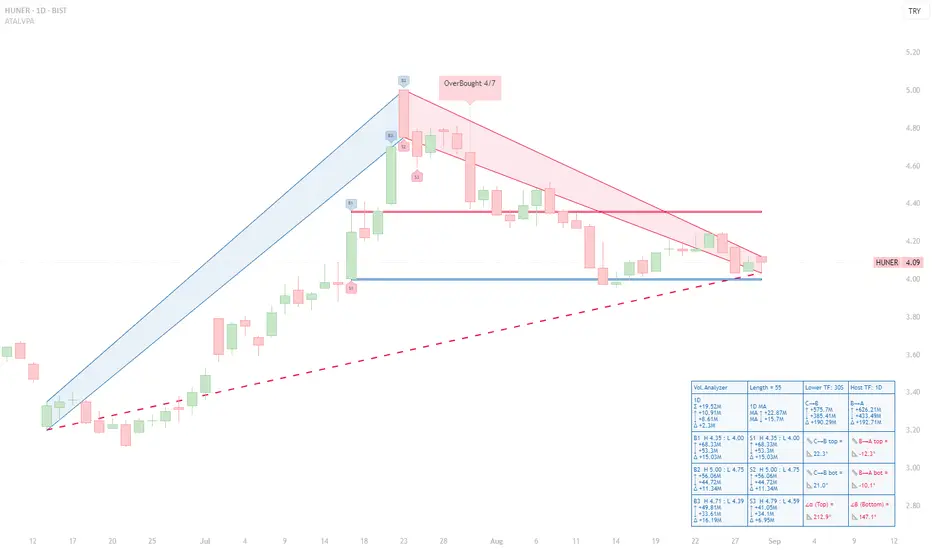
◉ OB/OS: An OverBought 4/7 tag printed at the apex; no confirmed OS on the right edge. That OB cluster preceded the entire red B→A leg and frames the current risk.
◉ Ranked volume peaks (Top-3):
- B1 (H 4.35/L 4.00) ↑ 68.33M, ↓ 53.3M, Δ +15.03M.
- B2 (H 5.00/L 4.75) ↑ 56.06M, ↓ 44.72M, Δ +11.34M.
- B3 (H 4.71/L 4.39) ↑ 49.81M, ↓ 33.61M, Δ +16.19M.
- S3 (H 4.79/L 4.59) ↑ 41.05M, ↓ 34.1M, Δ +6.95M.
Takeaway: Buying peaks were heavy, but subsequent price action failed to sustain higher highs; sellers have since controlled the B→A leg.
◉ Segment diagnostics:
- C→B advance: top/bottom slopes +22.3° / +21.0° → mature but constructive.
- B→A decline: top/bottom slopes –12.3° / –10.1° → persistent downside pressure.
- Orientation at B: α 212.9° (red) / β 147.1° (red) confirm the bearish state of the current swing geometry.
◉ Levels & structure:
- Support: the S1 low ≈ 4.00 is the active horizontal shelf repeatedly defended.
- Resistance: 4.35 (B1/S1 pivot), 4.71–4.79 (B3/S3 band), then 5.00 (B2). The descending B→A trendline caps bounces before these levels.
Actionable interpretation (educational):
Bias stays bearish-to-neutral while price trades beneath the B→A upper line and below 4.35. A credible shift would require (i) a fresh B-ranked bar with positive Δ near the right edge, and (ii) a close back above the B→A top. Failure to reclaim 4.35 after bounces leaves 4.00 vulnerable; a daily close below 4.00 would validate extension into the S-zones. Conversely, an OS print near 4.00 coupled with flattening BA slopes would set up a tactical mean-reversion toward 4.35 → 4.71/4.79.