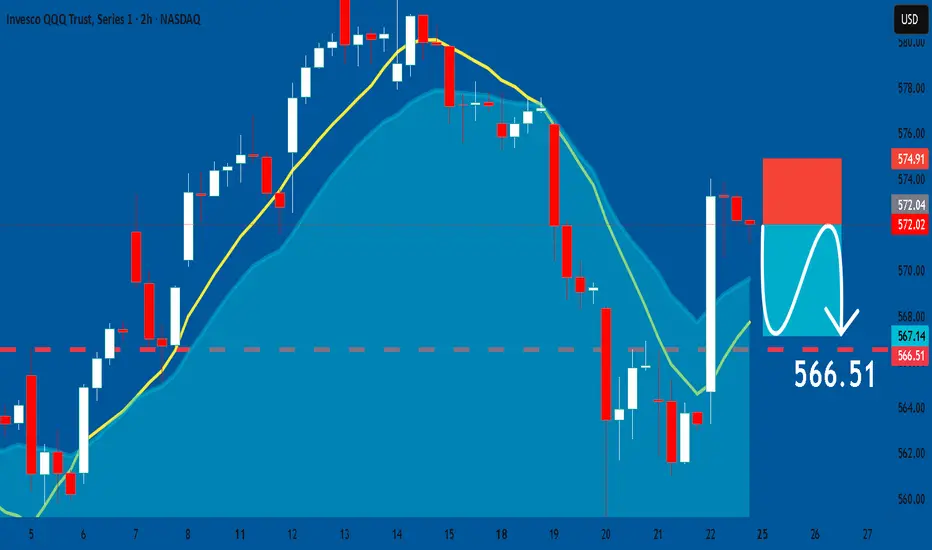
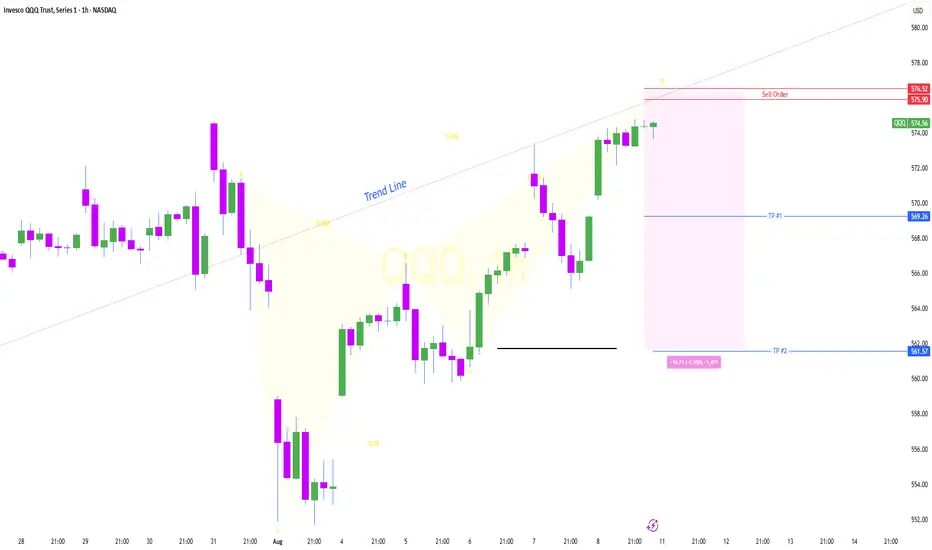
QQQ: Bearish Continuation & Short Signal
QQQ
- Classic bearish setup
- Our team expects bearish continuation
SUGGESTED TRADE:
Swing Trade
Short QQQ
Entry Point - 572.02
Stop Loss - 574.91
Take Profit - 566.51
Our Risk - 1%
Start protection of your profits from lower levels
Disclosure: I am part of Trade Nation's Influencer program and receive a monthly fee for using their TradingView charts in my analysis.
❤️ Please, support our work with like & comment! ❤️
QQQ trade ideas
Is Fridays Bounce a Bull Trap?CME_MINI:NQ1! CME_MINI:ES1! stock market Forecast
Nvidia Stock NASDAQ:NVDA Forecast
Apple Stock NASDAQ:AAPL Forecast
Microsoft Stock MSFT Forecast
Google Stock GOOGL Forecast
Amazon Stock AMZN Forecast
Meta Forecast Technical Analysis
Tesla Stock TSLA Forecast
Magnificent 7 stocks forecast

QQQ The Target Is DOWN! SELL!
My dear subscribers,
My technical analysis for QQQ is below:
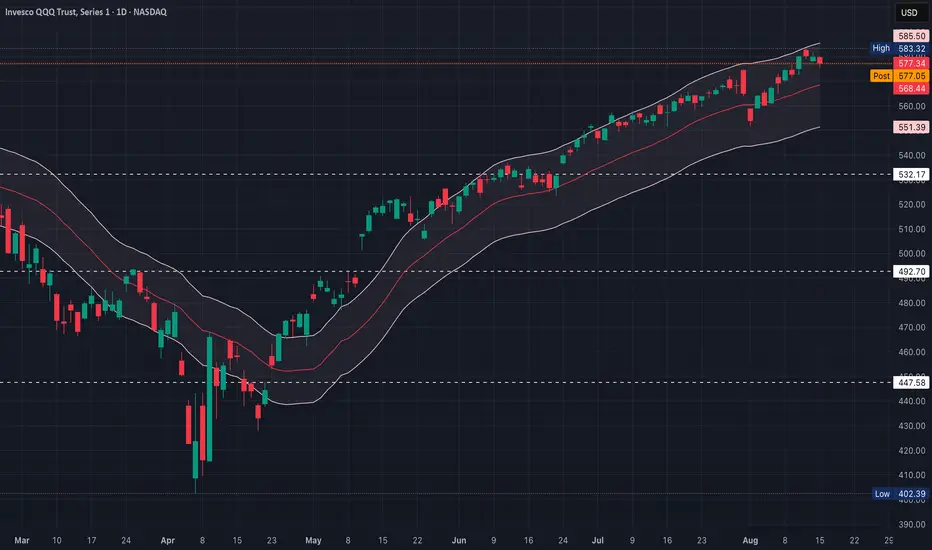
The price is coiling around a solid key level - 572.02
Bias - Bearish
Technical Indicators: Pivot Points Low anticipates a potential price reversal.
Super trend shows a clear sell, giving a perfect indicators' convergence.
Goal - 567.03
My Stop Loss - 574.78
About Used Indicators:
By the very nature of the supertrend indicator, it offers firm support and resistance levels for traders to enter and exit trades. Additionally, it also provides signals for setting stop losses
Disclosure: I am part of Trade Nation's Influencer program and receive a monthly fee for using their TradingView charts in my analysis.
———————————
WISH YOU ALL LUCK
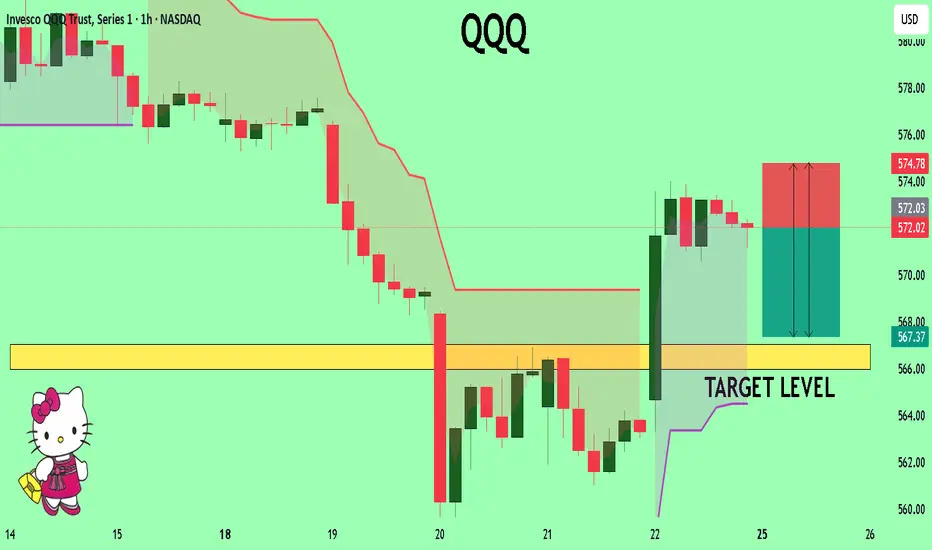
QQQ (22 August)Monday is binary
If momentum pushes through $575 early, calls can run toward $580–$583 quickly
$575 is a decision point - break & run to $583, or fade back to $568
Powell hint already absorbed so the next big movers include economic data mid-week (jobs, inflation reads) & tech leadership (NVDA moves will matter)
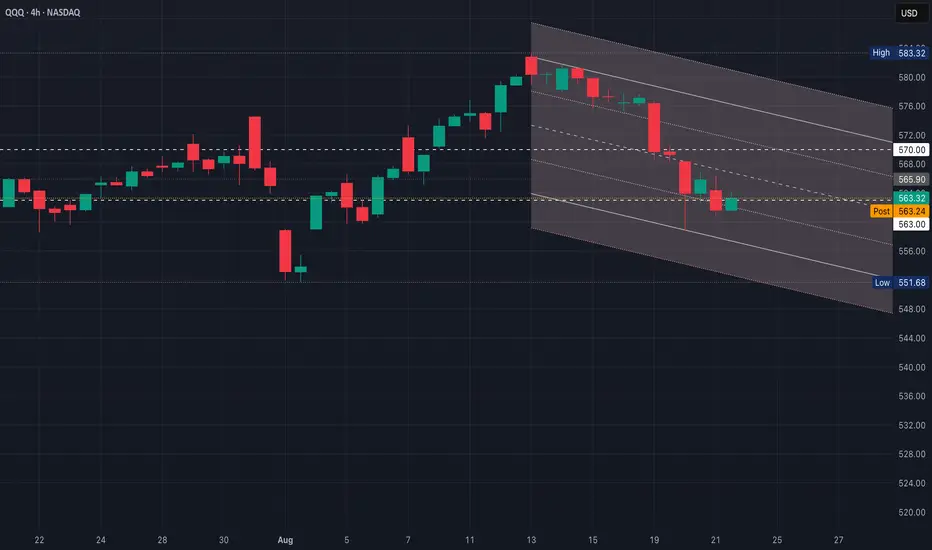
QQQ Post Powell Move w/ Range ExpansionQQQ closing right in the middle of the down channel at ~$563, which is a key battleground ahead of Powell
What’s “developing” is either a base at $563 (could support a bounce) or a bear flag (if bounce fails)
1. Dovish Tilt (hinting at cuts/easing)
Dollar & yields drop, then QQQ rallies
Break above $566, tests $570 quickly
If $570 breaks, upside gap-fill to $575–$577 possible
2. Neutral (balanced/data-dependent)
Market chops inside $561–$570 range
Expect whipsaws; QQQ likely oscillates around $563 pivot line until close
3. Hawkish (higher-for-longer/inflation worry)
Dollar & yields rip higher
QQQ loses $561, then flush toward ~$558
If momentum builds, $553–$555 opens fast
Qqq... Done or one more ?So in my previous post I mentioned
Qqq tagged its 16 year trendline resistance
Zoomed in and circled last 3 touches
From 583 to 559 in one week.
Now Zoomed to see the last 2month price action and you'll see we hammered off our summer channel support
So with Powell speaking tomorrow i think we will be at a cross roads where either we will make 1 more high before sept or the move is done already.
Let me explain
In my last post (See link)
I explained the tech Sectors and that they where signaling a top and here we are a week later.
The 2 biggest tech Sectors
NASDAQ:SMH (Chips)
AMEX:XLK ( aapl , msft)
Are both Showing a topping pattern called Wyckoff distribution..
This pattern is pretty much a conformation that Sept will be UGLY and Qqq will close gap at 530 minimum
But I've said all this before in my last post..
This post is about the possibility of a bounce to 589-600 in the last week of August.
It all comes down to Powell tomorrow.. if Qqq closes back over 571 or 20sma tomorrow then I would be leaning towards one more of 589-600..
589 would be a tag of that yellow trendline which is that 16yr resistance.
600 would be extreme fawkery and a push back up to the top of the summer channel.
Qqq has faked out twice before over that monthly trendline . I circled the last 2 fakeouts here
So if Qqq and tech Sectors push back over their 20sma and close the week above it then I'd flip long for the last week of August then come back after labor day weekend with puts in mind.
If Powell causes a sell and we close below 563 then disregard this post..
The next best short entry is below 557.00
Core pce and NVDA earnings are catalyst next week.
Risky longs below 20sma..
Either wait for a break above 570.00
Or long 563-564..
If you long 563 then be willing to add to your position up into 559.00
Stop loss below 558.00
If you long above 570 them be willing to add to your position up into 567
Stop loss below 566
Over 570 and 576.50 comes
Over 581 and we will head to a new high
Trade idea
If this goes up then I like NASDAQ:GOOGL calls with a target of 210.00 for the last leg up. See my link
Entry above 197.50 (20sma)
Stop loss below 195.00
1st Target 202.50
2nd target 210.00

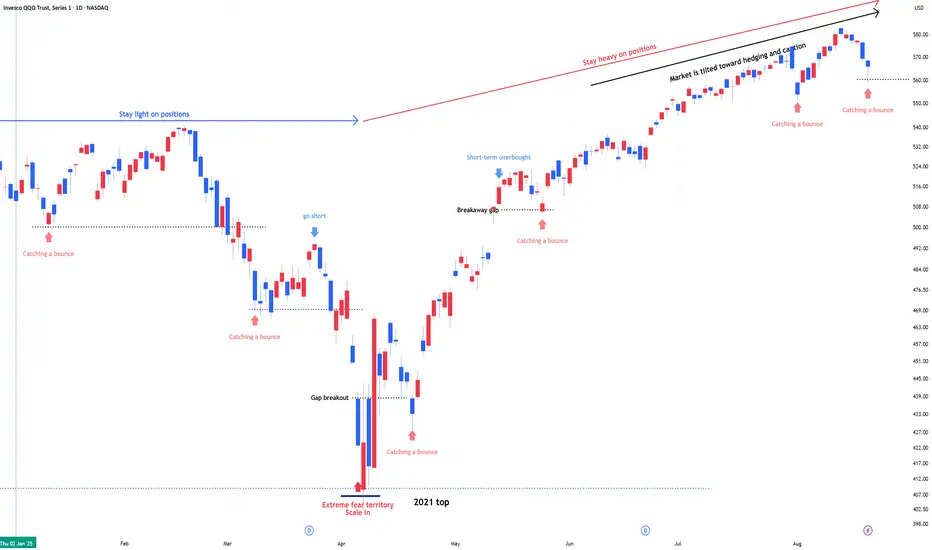
QQQ , Stay heavy on positions. QLD or TQQQ , Stay heavy on positions.
Same view as before. No change.
A signal for catching a bounce has emerged.
The bounce signal reflects a swing-to-intraday view and is not tied to the broader trend.
In stay light on positions zones, I hold QQQ and reduce exposure.
In stay heavy on positions zones, I increase allocation using a mix of QLD and TQQQ.
** This analysis is based solely on the quantification of crowd psychology.
It does not incorporate price action, trading volume, or macroeconomic indicators.
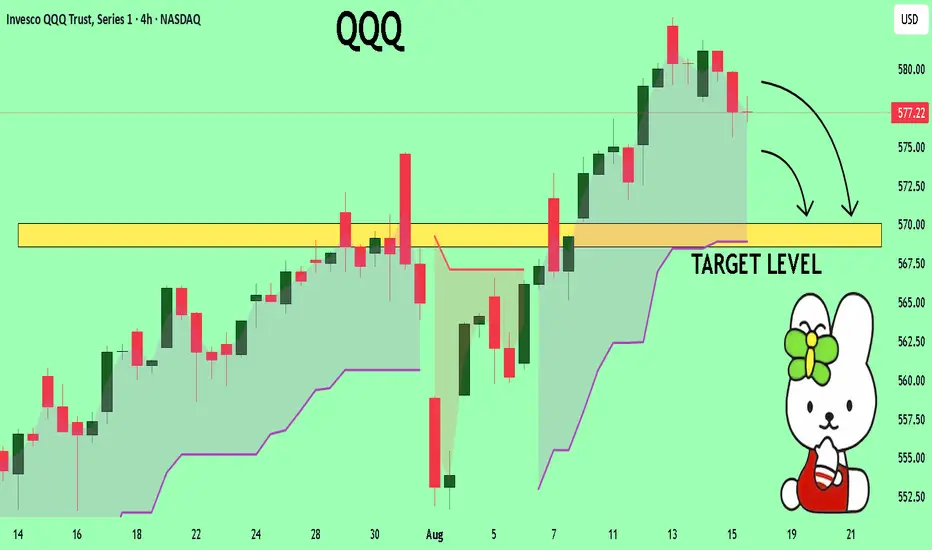
QQQ Bearish ContinuationFade into resistance at $567–$569, cover into $559–$555 & flip bullish only if $570+ is reclaimed
If QQQ rejects $568–$569 & rolls, target $562, then $559–$558 (channel bottom)
Breakdown below $558 opens $555–$553 extension
If QQQ can reclaim and close above $570, it breaks the channel mid-line and attacks $575–$577 (upper channel)
Only above $577+ do bulls get control back

QQQ ShortThe QQQ is likely to decline from the 576 level, influenced by the Butterfly Pattern, and may move toward its anticipated target.
NQ – Nasdaq follows the witch’s SPY prophecyNot only is the S&P 500 following the oracle in the SPY, but the Nasdaq has also given us a short signal. So, the scenario is the same as with SPY: short down to the Centerline.
For the indicator traders, I’ve also added the EMA(10) and EMA(20). Look at how well they’ve provided support so far. If the EMA(20) cracks, things will get hot. And if the CIB line (Change In Behavior) also breaks, then all hell breaks loose!
As already mentioned in the SPY post, it wouldn’t be a shame to take at least 50% of the profits you’ve accumulated so far. Because if it goes further up, e.g. above the U-MLH, you still have 50% left to benefit. If it goes down, we’ve already bagged 50%.
BTW: At the 1/4 line, we can usually expect support.
Exciting times, when maybe it’s better to sit still and keep your hands to yourself.
I’ll create the YT video with details tomorrow.
Happy profits to you all!

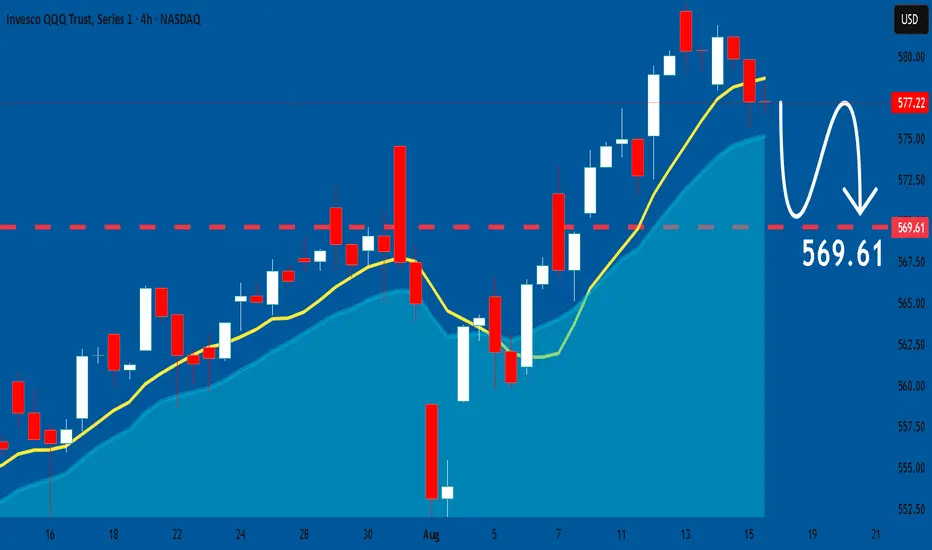
QQQ Bounce or Bleed?!The key question now is whether QQQ bases at $569 and bounces, or whether this was just the first flush before continuation
Above $572 (long bounce)
Below $569 (short bleed)
Between $569–$571 (chop zone, wait for break)
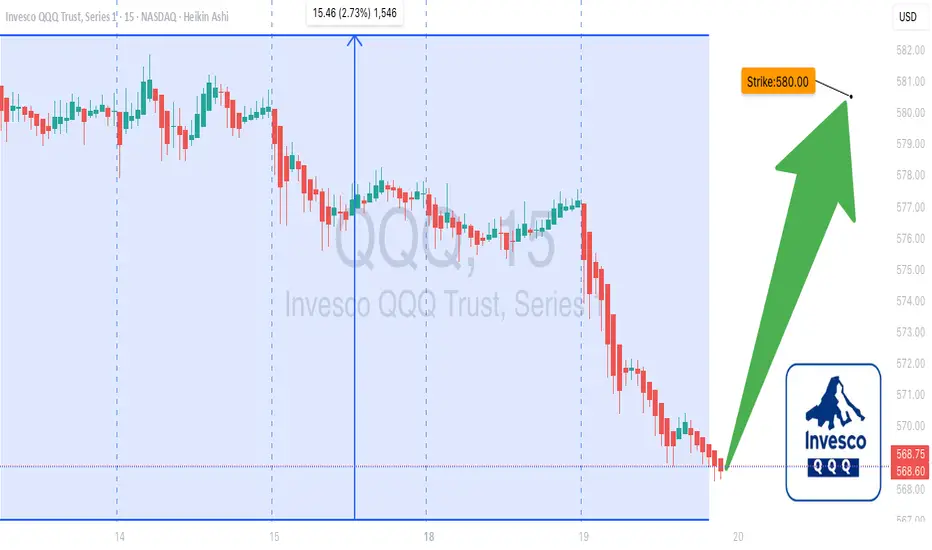
QQQ $580 Call Alert: Moderate Bullish Setup – Trade Smart!
# 🚀 QQQ Weekly Options Alert – \$580 Call (Aug 19, 2025) 💎🔥
### **Market Snapshot**
📊 **Daily RSI:** 63.8 ⬇️ (cooling momentum)
📈 **Weekly RSI:** 71.0 ⬆️ (bullish trend)
📉 **Volume:** Weak (0.8–1.1x prior week) 🚨
⚖️ **Options Flow:** Neutral (1.00 C/P ratio)
✅ **Volatility:** Favorable (VIX 15.8)
💡 **Overall Bias:** Moderate Bullish, but cautious due to weak volume & mixed momentum
---
### **Model Highlights**
* **Agreement:**
* Weekly RSI trending bullish 📈
* Weak volume signals institutional caution 🚨
* Low VIX supports directional plays 💎
* **Disagreement:**
* Grok, DeepSeek, Claude: moderate bullish entry possible 💡
* Gemini, Llama: advise avoiding trades due to unclear signals ❌
---
### **💥 Trade Recommendation**
🎯 **Strategy:** Cautious Call
* 🏦 **Instrument:** QQQ
* 💵 **Strike:** \$580
* 🗓️ **Expiry:** Aug 19, 2025
* 💰 **Entry Price:** \$1.30
* 🎯 **Profit Target:** \$1.40
* 🛑 **Stop Loss:** \$0.75
* ⏰ **Entry Timing:** Market Open
* 📈 **Confidence:** 65%
⚠️ **Key Risks:**
* Weak institutional support 📉
* Potential consolidation ⚖️
* Market volatility ⛈️
---
### **Trade JSON**
```json
{
"instrument": "QQQ",
"direction": "call",
"strike": 580.0,
"expiry": "2025-08-19",
"confidence": 0.65,
"profit_target": 1.40,
"stop_loss": 0.75,
"size": 1,
"entry_price": 1.30,
"entry_timing": "open",
"signal_publish_time": "2025-08-19 15:01:00 UTC-04:00"
}
```
📊 **Quick Trade Recap:**
🎯 CALL \$580 | 💵 \$1.30 → 🎯 \$1.40 | 🛑 \$0.75 | 📅 Aug 19 | 📈 65% Confidence
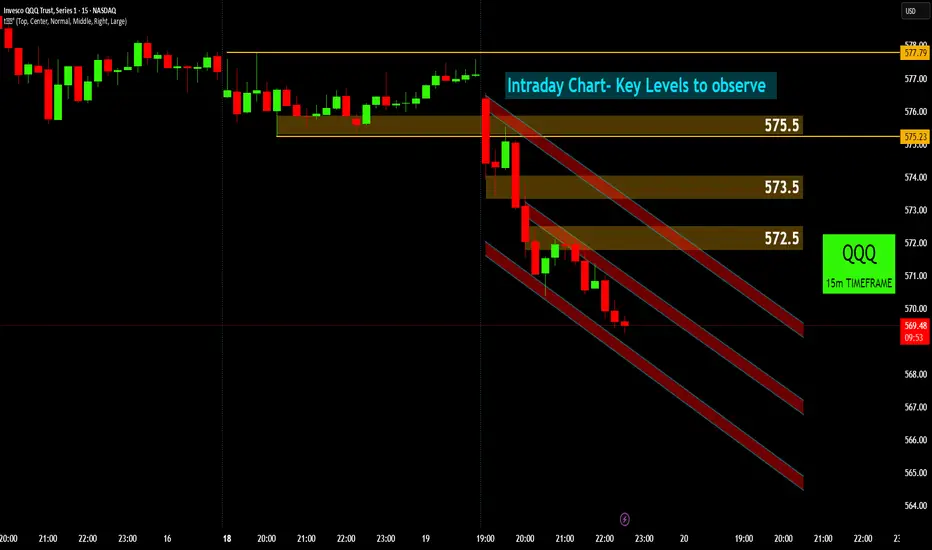
QQQ: Navigating the Intraday Downtrend🔭 QQQ's Current View: Bearish Channel in Focus! ⬇️
QQQ's intraday chart shows a recent breakdown, with price now navigating a clear bearish channel.
Initial Breakdown: QQQ experienced a sharp drop below 575.5 💥, turning previous support into immediate resistance. This marked the start of the current bearish leg.
Bearish Channel Formation: Price is now moving within a well-defined descending channel 🔽🔽🔽. This indicates short-term bearish control, with sellers dominant.
Overhead Resistance Zones: Key resistance levels to watch are 572.5 🧱 and 573.5 🧱. These levels, along with the channel's upper boundary, represent potential areas where sellers might step in if price attempts to rally.
Intraday Outlook: Traders should monitor how QQQ reacts within this channel. A move above the channel and 573.5 would signal a shift, while continued weakness points to further downside potential within the channel. Stay vigilant on these key levels for any intraday reversal or continuation signals.
Disclaimer
The information provided in this chart is for educational and informational purposes only and should not be considered as investment advice. Trading and investing involve substantial risk and are not suitable for every investor. You should carefully consider your financial situation and consult with a financial advisor before making any investment decisions. The creator of this chart does not guarantee any specific outcome or profit and is not responsible for any losses incurred as a result of using this information. Past performance is not indicative of future results. Use this information at your own risk. This chart has been created for my own improvement in Trading and Investment Analysis. Please do your own analysis before any investments.
QQQ Gap PlayRight now, QQQ is resting right at wedge support + pivot, which is often where the next directional move starts
Price is pressing on the lower wedge line but not breaking with conviction
Volume (white line) is tapering, which means the “breakdown” pressure hasn’t been confirmed
Wedges love fake breakdowns - only act when price + volume confirm together
Gap up reclaims $578 at open with volume; ideally, a green candle with little/no lower wick (shows buyers controlled the whole session)
$582 to ~$586 AVWAP ($580C/$582C scalp, $585C swing)
Invalid back under ~$577
Gap down or fail $577 at open; ideally, opens & trades below $576 (prevents fake breakdowns) with volume expansion on the red candle (confirms sellers are pressing) - bonus if price retests $577 & fails (strong confirmation of breakdown)
$572, then ~$569 to ~$568 ($577P scalp, $575P main, $570P runner)
Invalid if price reclaims & holds above 579

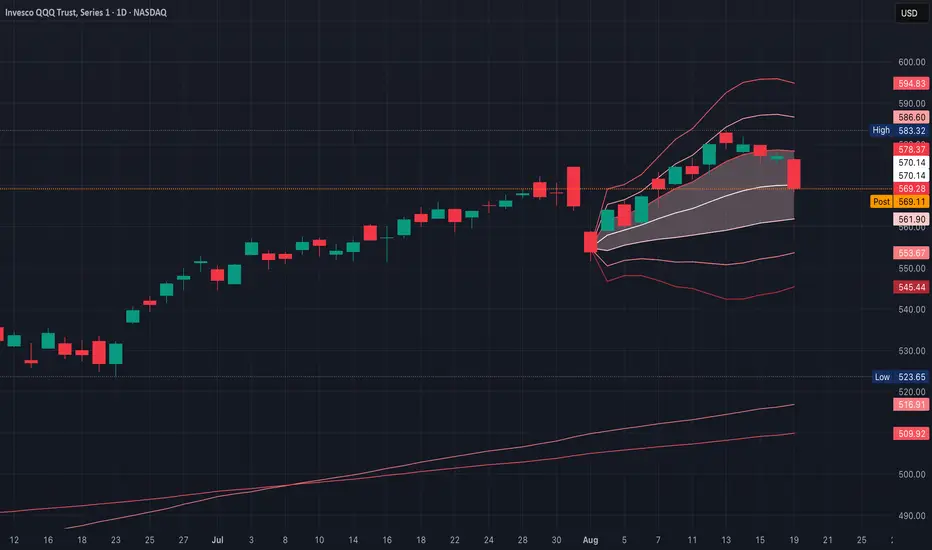
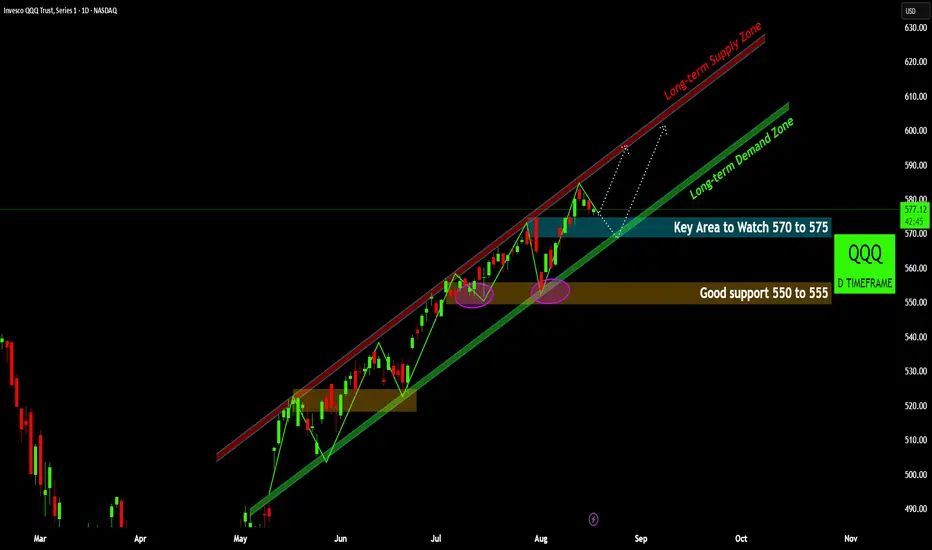
QQQ: Riding the Growth Wave – Key Demand Zones!QQQ: Riding the Growth Wave – Key Demand Zones! 🌊
QQQ continues its impressive ascent, firmly entrenched within a well-defined long-term bullish channel. The daily timeframe reveals critical demand zones currently in play, shaping the index's immediate future.
Persistent Bullish Channel: QQQ has maintained a robust uptrend within a clear long-term demand zone (green trendline) and is approaching the long-term supply zone (red trendline) 📊. This structure signifies consistent buyer interest and upward momentum.
Immediate Support in Focus: The 570-575 area 💙 represents a crucial immediate support zone. This level aligns directly with the lower boundary of the long-term demand channel, making it a pivotal area for buyers to defend and sustain the current uptrend.
Stronger Foundational Support: Should the immediate support yield, a more significant "good support" lies within the 550-555 range 🟠. This zone has historically proven resilient, acting as a strong floor for previous pullbacks and providing a robust buying opportunity.
Path to Supply Zone: A successful rebound from the current demand zone, particularly if the
570-575 level holds strong, would likely propel QQQ back towards its long-term supply zone 🔴. This upper channel boundary would represent the next major resistance target.
Outlook: The overall bullish trend remains intact as long as QQQ respects its long-term demand channel. Vigilance at the 570-575 level is key. A decisive break below this, however, could see the index testing the stronger 550-555 support ⚠️.
Disclaimer:
The information provided in this chart is for educational and informational purposes only and should not be considered as investment advice. Trading and investing involve substantial risk and are not suitable for every investor. You should carefully consider your financial situation and consult with a financial advisor before making any investment decisions. The creator of this chart does not guarantee any specific outcome or profit and is not responsible for any losses incurred as a result of using this information. Past performance is not indicative of future results. Use this information at your own risk. This chart has been created for my own improvement in Trading and Investment Analysis. Please do your own analysis before any investments.
QQQ Holding StrongQQQ is holding strong this week above key moving averages, supported by ST bullish setups that look appealing, but it's important to watch for overbought signals & broader macro triggers for confirmation or caution
If QQQ pushes above $580 with conviction, the path toward $586–$589 looks paved; especially, if heavyweights like NVDA, AAPL, or MSFT continue to lead
With the strong trends, using short-dated call setups (within 1–2 weeks) could capitalize on momentum, but keep risk due to time decay in mind
A dip to the 50d MA (~$554) could offer a higher-probability entry zone; especially, if broader market sentiment remains constructive
A breach below $540 & a move toward the 200d MA (~$515) would likely signal a deeper correction or trend shift
RSI nearing overbought levels means gains could slow or reverse without fresh catalysts & with Fed sentiment in focus (Powell's Jackson Hole speech), a dovish or hawkish tone could significantly sway prices (markets could swing down if investor expectations aren’t met)

QQQ vs IWM – Big Tech Leaves Small Caps BehindQQQ +31% YTD - AI boom, cloud demand, mega-cap strength.
IWM +12% YTD - Higher costs, weak margins, slower growth.
The gap is widening.
Breakouts in QQQ = more upside potential.
IWM struggling near resistance, small caps lagging.
Watch if rate cuts spark a small-cap catch-up, or if Big Tech continues to lead into 2026.

QQQ: Bears Will Push Lower
Remember that we can not, and should not impose our will on the market but rather listen to its whims and make profit by following it. And thus shall be done today on the QQQ pair which is likely to be pushed down by the bears so we will sell!
Disclosure: I am part of Trade Nation's Influencer program and receive a monthly fee for using their TradingView charts in my analysis.
❤️ Please, support our work with like & comment! ❤️
QQQ A Fall Expected! SELL!
My dear friends,
Please, find my technical outlook for QQQ below:
The instrument tests an important psychological level 577.22
Bias - Bearish
Technical Indicators: Supper Trend gives a precise Bearish signal, while Pivot Point HL predicts price changes and potential reversals in the market.
Target - 570.06
About Used Indicators:
Super-trend indicator is more useful in trending markets where there are clear uptrends and downtrends in price.
Disclosure: I am part of Trade Nation's Influencer program and receive a monthly fee for using their TradingView charts in my analysis.
———————————
WISH YOU ALL LUCK
QQQ (15 August)Approximately 56.4% of the QQQ stocks are trading above their 50d MA & about 66.3% are trading above their 200d MA
These levels indicate a moderately positive near-term trend with just over half of the constituents are in ST uptrends, suggesting reasonable participation, though it's not a runaway bullish signal
A strong LT trend presence with two-thirds of stocks are in LT uptrends, supporting constructive structural strength beneath QQQ
These numbers suggest that while participation is positive, it's not extreme
If QQQ continues higher, it’s worth watching whether the 50d breadth climbs further (strengthening the breakout thesis)
If QQQ rallies, but fewer constituents join (50d breadth stalls or reverses), that could be a red flag for sustainability
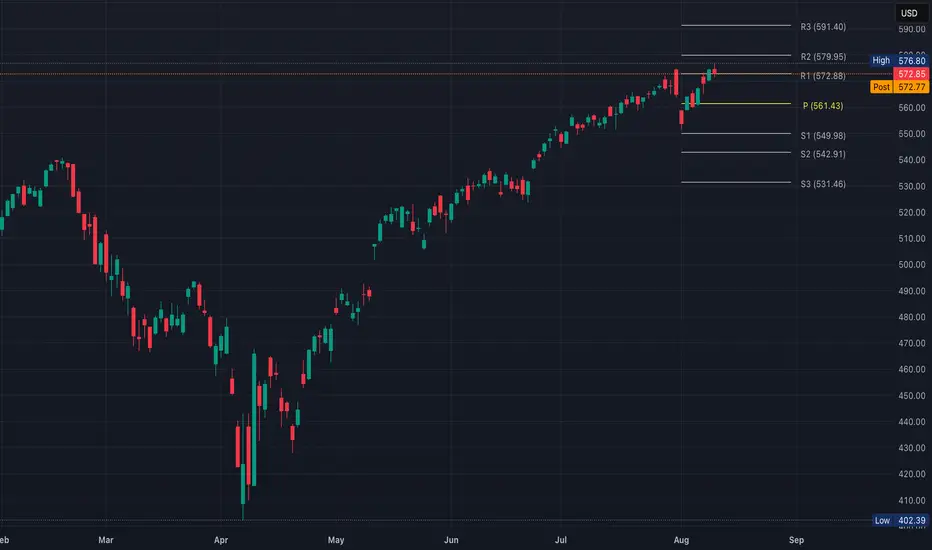
QQQ Closes @ R1QQQ closed right at the first level of resistance after August's disappointing NFP
A move up to $574 tomorrow that holds greatly weakens the bear thesis
QQQ Hesitation @ $580Given the tight range, expect either a fast breakout or quick rejection tomorrow (watch first 15 min volume — if it’s weak, false moves are more likely)
Bullish:
Short scalp: $582C or $585C (same week expiry)
Swing: $587C or $590C (1–2 wks out)
Stop-loss under $580 after breakout attempt
Bearish:
Scalp: $578P or $575P
Swing: $570P for main target, $565P if looking for deeper flush
Stop-loss above $580 after breakdown attempt

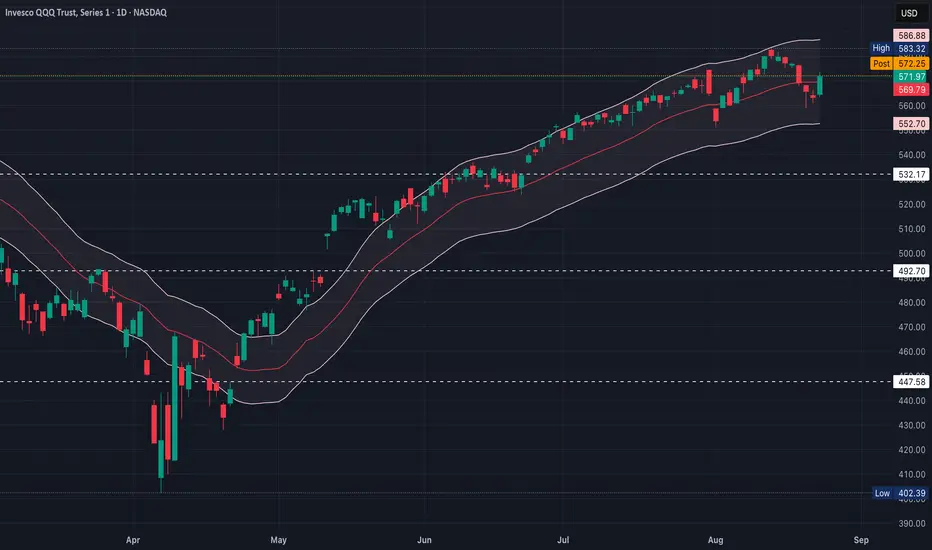
QQQ 3-Year Correction Overdue Since 2015 the Nasdaq Index has undergone approximately 25% corrections from all-time-highs every 3 years. Over this time period, the price has more or less respected the trend lines shown above. But perhaps a force more powerful than the trendline is the timeline.
The pattern repeats at roughly 39-month intervals from top to top:
May '12 - July '15 (1175 days)
pivot from 5/1/12 ATH, 12%* correction over 35 days
July '15 - October '18 (1170 days)
pivot from 7/20/15 ATH, 26% correction over 34 days
October '18 - November '21 (1148 days)
pivot from 10/1/18 ATH, 24% correction over 84 days
November '21 - February '25 (1176 days)
pivot from 11/22/21 ATH, 38%** correction over 324 days
February '25 - May '28
pivot from 2/18/25 ATH, ??% correction
If the pattern holds true, we were due a correction last week. My guess is we'll double-top December's ATH and then start the correction. How deep for how long is anyone's guess. Feels more like '21 insanity than '15 or '18 to me.
Notes:
*2012 (I believe) not yet representative of participation in the trendline pattern (still recovering from Great Recession)
**This particular correction was covid-anomolous (we were 24% above the channel already when we pivoted). This particular -38%, 324-day correction was more like 3-in-1: -22% in 97 days, -27% in 80 days, -24% in 59 days. You may get a better pattern predictor if you average the 3 moves, so -24% over 77 days. Alternatively, you can see it as two moves: an intial -22% move to bring it back within the channel, followed by a second -24% move to bring it to the bottom of the channel.
