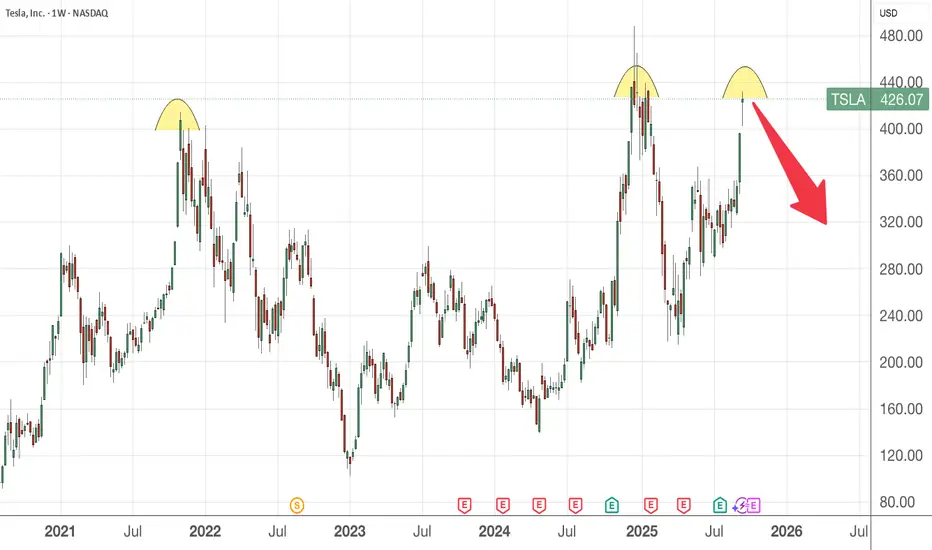
TESLA: Short Trading Opportunity
TESLA
- Classic bearish formation
- Our team expects pullback
SUGGESTED TRADE:
Swing Trade
Short TESLA
Entry - 440.32
Sl - 443.84
Tp - 432.53
Our Risk - 1%
Start protection of your profits from lower levels
Disclosure: I am part of Trade Nation's Influencer program and receive a monthly fee for using their TradingView charts in my analysis.
❤️ Please, support our work with like & comment! ❤️
TSLA trade ideas

Is it time for TSLA to come down?First thing first, I do not own nor trade this stock. So do take it with a pinch of salt.
From the weekly chart, it seems to display a triple top formation which is bearish in nature. However, market is irrational and though it is highly overvalued, it could still continue to rally if the demand from buyers is there.
SL above 480 and aim for profit target at 299
$TSLA: Breakout Wave Dimensions🏛️ Research Notes
Apart from known compression patterns for Tesla, there is another squeeze happening on smaller scale:
That area will be processed to derive the chart-based levels and see how market reacts to them.
Triangle
Breakout Expansion

Tesla - SHOW ME THE CHART AND I WILL TELL YOU THE NEWS!Back in June and July, Elon and Tesla were STILL getting a lot of bad press (Elon fighting with President Trump, people burning Tesla cars etc). Those that follow me may recall on July 29th I wrote the following:
"Tesla just needs a narrative shift (ie -new invention etc), & price action changes in a heart beat.
Yet, price action really has less to do with the news making Elon a hero, then a villain and then back and forth...but moreso to do with price action patterns that just keep repeating".
And you'll note that my July chart suggested that the huge pump to $400+ would begin around Sept 1st (Huge green arrow after the retest). What a coincidence that 2 weeks later Elon announces a $1Billion dollar Tesla stock buy (the new anticipated "narrative"). My huge green arrow was there many weeks before this "news". How could I have known?
SHOW ME THE CHART AND I WILL TELL YOU THE NEWS.
On July 29th Tesla was $321 and I suggested that Tesla was about to have a major breakout to at least $400 "with no major retraces". That target has now been hit. Is it because of the news or is it the patterns that just keep repeating?
My T1 targets are probable targets, so I anticipate them almost always getting hit. My ideal buy and sell targets are T2. Tesla now appears to be headed into my T2 target, so it's time to start monitoring price action closely.

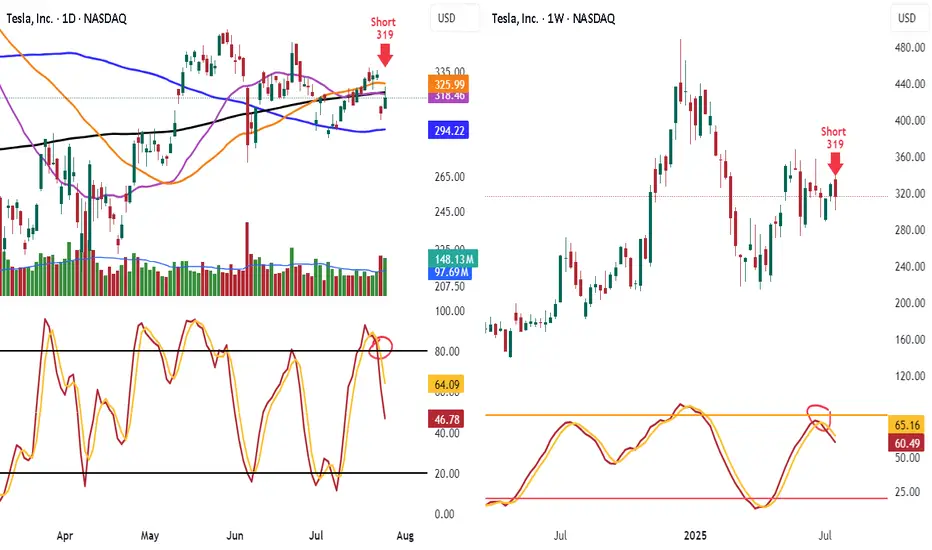
Shorted TSLA 319 Look at TSLA hit 50 day and 200 day MA and failed and know under them
Look at the lower highs and see the stoch heading down
Know lets look weekly stoch heading down and lower highs
Target is 100 day ma 294.22 take some off. When it breaks will add back on
Have trailing stop in place
$TSLA ATH BREAK SOONTons of NASDAQ:TSLA otm puts were sold at the open today.
$5.6 million 370p 10/31
$6.1 million 430p 10/3
$5 million 370p 11/21
$5.2 million 370p 11/21
Also otm calls were bought
$8.5 million 550c 11/21
$3.3 million 500c 11/21

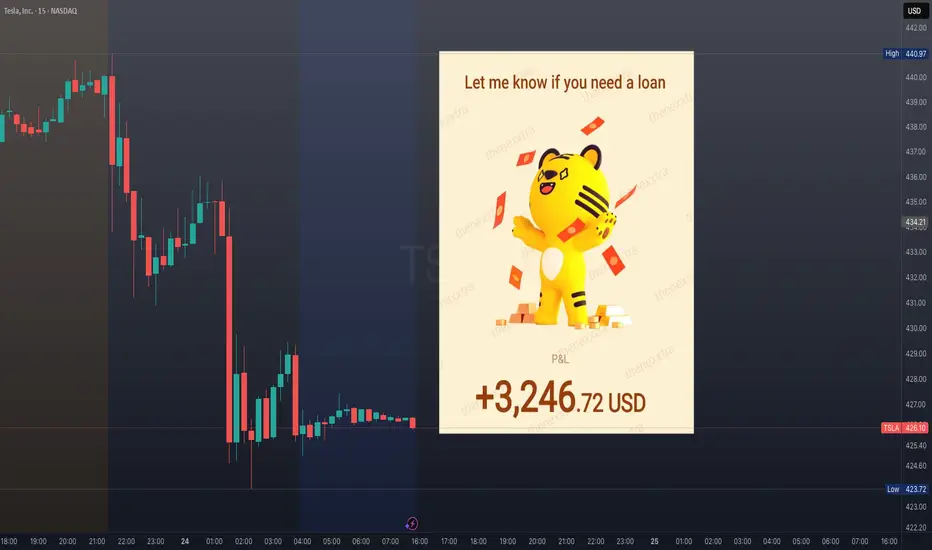
$TSLA broke down today on the 15-minute chart.NASDAQ:TSLA broke down today on the 15-minute chart.
Not with fireworks, but with precision — the type of move that punishes late longs and rewards those who prepared.
The truth? It’s never about guessing the direction.
It’s about setting the framework before the bell: pre-market levels mapped, risk defined, noise filtered.
When the signal confirms, you don’t hesitate. You execute.
Most of the time, the market whispers.
Sometimes, it shouts.
Your edge is built in the quiet hours, so when the move comes, you’re already positioned.
Cut losers fast.
Let winners breathe.
Keep showing up until probability pays you.
Tesla: Bullish Momentum Points to $500 Breakout Current Price: $426.07
Direction: LONG
Targets:
- T1 = $450.00
- T2 = $500.00
Stop Levels:
- S1 = $410.00
- S2 = $395.00
**Wisdom of Professional Traders:**
This analysis synthesizes insights from thousands of professional traders and market experts, leveraging collective intelligence to identify Tesla's high-probability trade setups. The wisdom of crowds principle suggests that the aggregated views from professional traders often produce high-quality forecasts. Tesla’s position as one of the most active and closely monitored equities by institutional investors amplifies the importance of consensus-driven strategies in this stock.
**Key Insights:**
Tesla has benefited from its strong electric vehicle (EV) market leadership, underpinning its growth trajectory as the EV industry expands globally. Traders highlight Tesla's ability to maintain robust operational margins despite headwinds such as rising commodity and transportation costs. Tesla’s ambitious Full Self-Driving (FSD) vision and upcoming AI developments have sparked significant enthusiasm among tech-focused investors, bolstering its long-term growth outlook.
From a technical perspective, Tesla is trading above its 50-day and 200-day moving averages, signaling upward strength. Recent trading volumes show consistent institutional accumulation, and the Relative Strength Index (RSI) remains below overbought levels, confirming room for continued upside. Professional traders expect Tesla to test the $450 level in the coming sessions, with the $500 mark identified as the next major extension point.
**Recent Performance:**
Tesla has demonstrated impressive resilience in 2025, rallying over 30% year-to-date while outperforming many of its peers in both the automotive and technology sectors. This upward momentum has been fueled by strong quarterly revenue growth and better-than-expected production numbers, despite macroeconomic concerns like inflationary pressures and volatile supply chains. Tesla’s recent price movement shows a robust support zone around $400, with increasing buying pressure pushing the price toward new highs.
**Expert Analysis:**
Market experts are largely optimistic about Tesla's future prospects, emphasizing the rapidly unfolding EV growth story and Tesla’s early entry advantages. As governments worldwide implement tighter emissions regulations and incentivize clean-energy adoption, Tesla stands out with its scalable production capacity and differentiated market position. Analysts also highlight catalysts such as the Cybertruck launch scheduled for late 2025 and margin expansion driven by cost-saving measures at key Gigafactories.
Technically, experts highlight Tesla’s bullish setup, formed by a series of higher lows and higher highs. Fibonacci retracement analysis places the next major resistance at $450, with $500 highlighted as the psychological and technical breakout point for long-term investors. Tesla’s MACD indicator remains strong, supporting an extended bullish trend.
**News Impact:**
Recent news regarding Tesla's continued success in expanding its market share in Europe and Asia has positively influenced sentiment. Additionally, CEO Elon Musk's statement outlining new advancements in robotics and AI platforms has sparked excitement about non-automotive revenue streams. Tesla's upcoming Investor Day, scheduled for Q4 2025, is likely to introduce updates on strategic innovations, driving higher investor confidence.
**Trading Recommendation:**
Based on Tesla’s technical setup, strong fundamentals, and favorable news flow, a long position is recommended. Traders should consider targeting the $450 level as the first resistance, while $500 serves as the medium-term price objective. Stops should be placed at $410 and $395, reflecting prudent risk management. Tesla’s continued momentum in 2025 makes this trade a compelling opportunity for growth-focused investors.
Do you want to save hours every week? Register for the free weekly update in your language!

Tesla (TSLA) Share Price Rises Ahead of Earnings ReportTesla (TSLA) Share Price Rises Ahead of Earnings Report
On 16 September, we noted signs of a strong market for Tesla (TSLA) shares, including:
→ The price remaining above the psychological level of $400;
→ Reaching the highest levels since late January.
We also identified an ascending channel and suggested that the long-term outlook remained optimistic, although a correction could not be ruled out.
Since then, TSLA shares have stabilised near the upper boundary of the channel, holding above the $400 level. On Friday, they were among the market leaders, rising by more than 4%. This brings the gain since the start of September to around +30%.
Why Are TSLA Shares Rising?
Key factors supporting a bullish outlook include:
→ Sentiment ahead of the quarterly Production and Deliveries report, expected this week. According to recent forecasts, actual figures could exceed expectations (although still showing a decline compared to the previous year).
→ Target price upgrades. Dan Ives of Wedbush, one of Tesla’s most prominent bulls, last week raised his target price to $600 — the highest on Wall Street — citing substantial potential in AI and robotaxi development.
→ The “Musk factor”: Discussions around Elon Musk stepping away from politics are seen as a long-term positive driver.
Technical Analysis of TSLA Shares
The ascending channel remains intact. However, the chart suggests that the upper boundary now acts as resistance — unsurprising given the exceptional gains in September (noting that TSLA’s price has doubled since its yearly low). A slowdown in momentum is signalled by a bearish divergence on the RSI indicator.
Resistance at the upper boundary is further reinforced by a strong bearish reversal from late 2024. A similar pattern was recently observed when the price struggled to break above the bearish reversal zone at $345–355, resulting in an extended sideways movement in August and early September.
By analogy, the $445–465 zone may also act as resistance — meaning a correction remains a plausible scenario. For example, TSLA stock price could pull back to test the psychological $400 level, which is supported by the median of the current channel.
This article represents the opinion of the Companies operating under the FXOpen brand only. It is not to be construed as an offer, solicitation, or recommendation with respect to products and services provided by the Companies operating under the FXOpen brand, nor is it to be considered financial advice.

I know you dont like me but..but... the whole universe is a huge fractal. Repetition inside a repetition repeated over time. Trading and investing is not far away from philosophy.
Look ar my BTC fractal prediction. its simple on point week by week.
Not an investment advice. Go to meditate.
Elon rules.

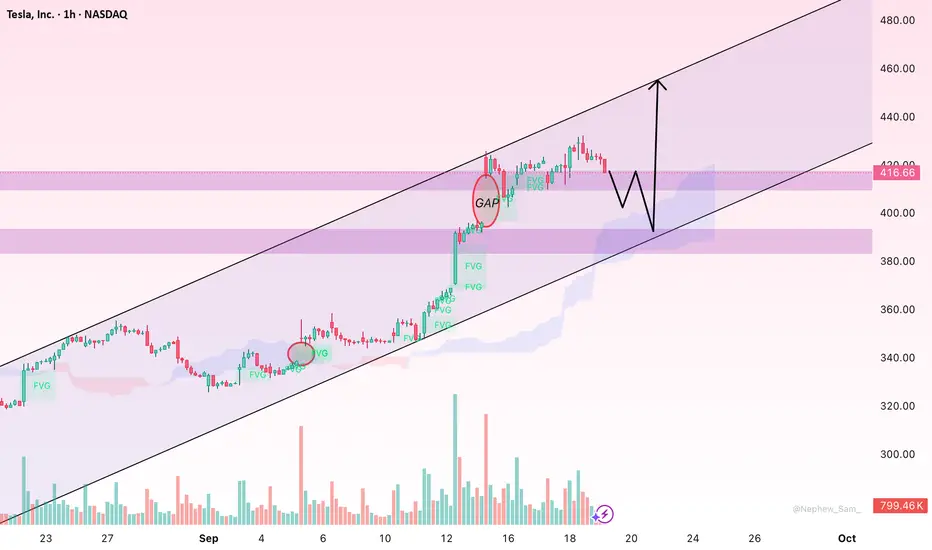
TSLA: Mild Pullback but Uptrend Remains IntactHello everyone,
Tesla’s share price (TSLA) slipped slightly today, closing at 416.66 USD, down 5.78 USD or 1.37% compared to the previous session’s high. After a strong rally earlier, the market is now watching closely to see whether Tesla can sustain its upward momentum or enter a deeper correction.
The main driver of this dip has been profit-taking after the stock approached the 430 USD level, creating selling pressure. Alongside this, Tesla’s prior upward moves have left several Fair Value Gaps (FVGs), which may serve as support zones if price revisits them, helping traders identify potential entry levels. In addition, trading volume has picked up significantly in recent sessions, showing strong inflows and active participation from major investors.
Looking ahead, despite the current mild pullback, Tesla shares are expected to extend their uptrend if they can hold above the 416 USD support. This is a crucial threshold—if it holds, price could revisit 430 USD and potentially move toward 440 USD in upcoming sessions.
The reasoning lies in the sustained capital inflows, the supportive role of FVG zones, and the Ichimoku cloud structure, which continues to back the bullish trend as long as price stays above it.
So, what’s your view? Will Tesla keep pushing higher toward 430–440 USD, or is a deeper retracement likely?
TSLA path to 550/650 USD Breakout Still Pending🔥 What specifically drives TSLA into 550–650
📦 Deliveries + mix surprise
If unit volumes beat whisper numbers and mix favors higher-trim/FSD attach, you get more gross profit per vehicle without needing price hikes. Watch the cadence of regional incentives and shipping vectors; strong NA/EU mix plus improving China utilization is the sweet spot.
🛠️ Margin stabilization → operating leverage
Gross margin base effect + opex discipline = powerful flow-through. Even a 100–150 bps lift in auto GM, coupled with energy GM expanding as Megapack scales, can push operating margin into low-mid teens. That alone recodes the multiple market is willing to pay.
🔋 Energy storage stepping out of auto’s shadow
Megapack/Powerwall growth with multi-GW backlogs turns “side business” into a credible second engine. As deployments and ASP/contract mix normalize, investors begin modeling $10–$15B annualized energy revenue with attractive GM — this is multiple-expanding because it looks more like infrastructure/software-tinted industrials than cyclical autos.
🤖 Autonomy & software monetization bridges
Two things move the needle fast: (1) clear progress toward supervised autonomy at scale (drives FSD attach + ARPU), and (2) licensing (FSD stack, charging/NACS, drive units). Even modestly credible paid-miles/seat-based models (think $50–$150/month vehicles on fleet) transform valuation frameworks.
🦾 Optimus/robotics as a real option, not sci-fi
The market doesn’t need commercial ubiquity — it needs line-of-sight to pilot deployments and unit economics where labor-substitute ROI < 3 years. A few high-credibility pilots (warehousing, simple assembly, logistics cells) can tack on optionality premium that pushes the multiple toward the top of the range.
💹 Options-market reflexivity
Flows matter. Elevated call demand near ATH turns dealers short gamma, forcing delta hedging that lifts spot, which triggers more call buying → a familiar feedback loop. On breakouts, watch open interest skew to short-dated OTM calls, and put-call ratios compressing; these magnify upside in a tight float day.
🌍 Macro & liquidity
If indices hold highs and the rate path doesn’t tighten financial conditions, growth duration gets rewarded. TSLA’s beta + story premium thrives in that regime.
________________________________________
🧠 Outside-the-box accelerants
🛰️ “Software day” packaging
A coordinated showcase that bundles FSD progress, energy software (fleet, VPP), service/insurance data, and Optimus pilots into a single capital-markets narrative could reframe TSLA as a platform. The Street responds to packaging; it compresses time-to-belief.
🤝 Third-party FSD/charging licensing headlines
A single blue-chip OEM announcing software licensing + NACS deep integration reframes the competitive landscape. The equity market pays a software multiple for recurring seats.
🏗️ Capex signaling for next-gen platform without GM hit
Announcing a modular, high-throughput manufacturing scheme (cell to structure, gigacasting tweaks, logistics compression) with proof that unit economics are accretive from ramp can flip skeptics who anchor to past ramp pain.
⚡ Grid-scale contracts + financing innovation
If Tesla pairs utility-scale storage with project-level financing (think repeatable ABS-like channels for Megapack), you de-risk cash conversion cycles and unlock a new investor constituency (infrastructure/green income). That tightens the multiple.
________________________________________
🏎️ Comparative playbook: RACE (Ferrari) & NVDA (NVIDIA)
👑 RACE — the scarcity & brand ROIC lens
Ferrari’s premium multiple rests on scarcity, orderbook visibility, and brand pricing power. TSLA doesn’t have scarcity, but it can borrow the RACE lens via (a) limited-run, ultra-high-margin trims that anchor halo pricing, (b) waitlist-like energy backlogs that create visibility, and (c) bespoke software packages that mimic “personalization” margin. In bull phases, RACE trades as a luxury compounder rather than an automaker; TSLA can earn a slice of that premium when the energy + software story dominates.
🧮 NVDA — the flywheel & supply-constrained S-curve
NVIDIA’s explosive run blended (1) clear demand > supply, (2) pricing power, (3) ecosystem lock-in. TSLA’s battery and compute stacks can echo that dynamic: limited 4680/cell supply + Megapack queues + proprietary autonomy data moat. The moment the market believes TSLA is supply-gated (not demand-gated) in energy/AI, it will award NVDA-like scarcity premia. Add toolchain stickiness (training data, fleet miles, Dojo/AI infra), and you get ecosystem multiples rather than auto multiples.
📊 What the comps teach for TSLA’s 550–650 zone
• RACE lesson: visibility + pricing power boost the quality of earnings → higher P/E durability.
• NVDA lesson: credible scarcity + platform control turbocharge EV/Sales and compress the market’s time-to-future state.
• Translation for TSLA: blend of luxury-like quality (energy contracts + premium trims) and platform scarcity (cells/AI stack) → multiple rerate into our target band.
________________________________________
🧾 Valuation outlook
🧮 Earnings path
• Units up mid-teens % Y/Y; ASP stable to slightly higher on mix; energy + software up strongly.
• Auto GM +100–150 bps; Energy GM expands on scale; opex +SMC disciplined → op margin 12–15%.
• Share count glide modest. Forward EPS ≈ $9–$11.
• Multiple: 50× (conservative growth premium) → $450–$550; 60× (software/autonomy visibility) → $540–$660.
• Why the market pays up: visible recurring high-margin lines (FSD, energy software, services) + AI/robotics optionality.
📈 EV/Sales path
• Forward revenue $130–$150B (auto + energy + software/services).
• Assign blended EV/Sales 6.5–7.5× when energy/software dominate the debate.
• Less net cash → equity value per share in $550–$650.
• Check: At 7× on $140B = $980B EV; equity ≈ $1.0–$1.1T with cash, divided by diluted shares → mid-$500s to $600s. Momentum premium and flow can extend to upper bound.
________________________________________
🧭 Technical roadmap & market-microstructure
🧱 Breakout mechanics
A decisive weekly close above prior ATH with rising volume and a low-volume retest that holds converts resistance to a springboard. Expect a “open-drive → pause → trend” sequence: day 1 impulse, 2–5 sessions of rangebuilding, then trend resumption.
🧲 Volume shelves & AWVAPs
Anchored VWAPs from the last major swing high and the post-washout low often act like magnets. Post-break, the ATH AVWAP becomes first support, then the $500 handle functions as the psychological pivot. Above there, $550/$590/$630 are classical measured-move/Fib projection waypoints; pullbacks should hold prior shelf highs.
🌀 Options & dealer positioning
On a break, short-dated OTM calls populate 1–2% ladders; dealers short gamma chase price up via delta hedging. Expect intraday ramps near strikes (pin-and-pop behavior) and Friday accelerants if sentiment is euphoric. A steepening skew with heavy call open interest is your tell that supply is thin.
________________________________________
🧨 Risks & invalidation
🚫 Failed retest below the breakout shelf (think: a fast round-trip under the $4-handle) downgrades the setup from “trend” to “blow-off.”
🧯 Margin or delivery disappointments (e.g., price-war resumption, regional softness) break the EPS/EV-Sales bridges.
🌪️ Macro shock (rates spike, liquidity drains) compresses long-duration multiples first; TSLA is high beta.
🔁 Flow reversal — if call-heavy positioning unwinds, gamma flips to a headwind and accelerates downside.
________________________________________
💼 Trading & portfolio expressions for HNWI
🎯 Core + satellite
Hold a core equity position to capture trend, add a satellite of calls for convexity. If chasing, consider call spreads (e.g., 1–3 month $500/$600 or $520/$650) to tame IV.
🛡️ Risk-managed parity
Pair equity with a protective put slightly OTM or finance it with a put spread. Alternatively, collars (write covered calls above $650 to fund downside puts) if you’re guarding a large legacy stake.
⚙️ Momentum follow-through
Use stop-ins above key levels for systematic adds, and stop-outs below retest lows to avoid round-trips. Size reduces into $590–$630 where target confluence lives; recycle risk into pullbacks.
💵 Liquidity & slippage
Scale entries around liquid times (open/closing auctions). For size, work algos to avoid prints into obvious strikes where dealers can lean.
________________________________________
🧾 Monitoring checklist
🔭 Delivery run-rate signals (regional registration proxies, shipping cadence).
🏭 Margin tells (bill of materials trends, promotions cadence, energy deployment updates).
🧠 Autonomy milestones (software releases, safety metrics, attach/ARPU hints).
🔌 Licensing/partnership beats (NACS depth, FSD/AI stack interest).
📊 Options dashboard (short-dated call OI ladders; put-call ratio shifts; gamma positioning).
🌡️ Macro regime (rates, liquidity, risk appetite).
________________________________________
✅ Bottom line
🏁 The 550–650 tape is not a fairy tale — it’s a stacked-catalyst + rerate setup where energy/software/autonomy rise in the narrative mix, margins stabilize, and options-market reflexivity does the rest. Execute the breakout playbook, respect invalidation lines, and use convex expressions to lean into upside while protecting capital.
esla (TSLA) — Breakout Playbook
🎯 Core Thesis
• Insider conviction: Musk’s ~$1B buy.
• Risk-on macro: equities at highs, liquidity supportive.
• Options reflexivity: call-heavy flows can fuel upside.
• ATH breakout (~$480–$490) = gateway to price discovery.
________________________________________
🚀 Upside Drivers to $550–$650
• Deliveries & Mix: Surprise beat + higher trim/FSD attach.
• Margins: GM stabilization + energy scaling → op margin 12–15%.
• Energy: $10–15B rev potential with infra-like multiples.
• Autonomy/Software: FSD attach, ARPU, licensing.
• Optimus/Robotics: Pilot deployments → ROI < 3 yrs adds optionality.
• Licensing Headlines: OEMs adopting NACS/FSD stack.
• Capital Markets Narrative: Packaged “software + energy + robotics” story reframes Tesla as a platform.
________________________________________
🏎️ Comparative Bull Run Lens
• Ferrari (RACE): Scarcity, orderbook, luxury multiples.
• NVIDIA (NVDA): Scarcity + ecosystem flywheel → EV/Sales premium.
• Tesla Parallel: Blend of luxury quality (energy backlogs, halo trims) + AI scarcity (cells, fleet data, Dojo).
________________________________________
📊 Valuation Bridges
• EPS Path: $9–$11 EPS × 50–60× = $450–$660.
• EV/Sales Path: $130–150B revenue × 6.5–7.5× = $550–$650.
________________________________________
📈 Technical Roadmap
• Breakout > $490 → retest holds → next legs:
o $550 / $590 / $630 / stretch $650–$690.
• Watch anchored VWAPs; ATH shelf flips to support.
• Options chase accelerates above round strikes.

Long trade Trade Journal Entry
Pair/Asset: TSLA (Tesla Inc.)
Trade Type: Buyside trade
Date: Friday, 26th Sept 2025
Session: London to New York Session AM (11:00 AM)
Trade Details
Entry: 427.51
Profit Level (TP): 465.20 (+8.82%)
Stop Level (SL): 425.82 (-0.40%)
Risk–Reward (RR): 22.3
Technical Narrative
Pre-Trade Context:
The price consolidated above a demand zone at 423–427, which coincided with the origin of a prior order block. Inducement & BOS (Break of Structure) confirmed bullish intent.
Several fair value gaps (FVGs) were present on the climb, supporting bullish continuation.
Entry Justification:
*Entry at 427.51 aligns with the mitigation of the demand zone and FVG fill.
*The structure flipped bullish after the sweep of local lows, setting the stage for an upside liquidity grab.
Target Rationale:
*TP aimed at 465.20, aligning with the previous swing high and liquidity above.
*Clean imbalances left on the rally offer magnets for price.
Risk Management:
Tight SL at 425.82, just below the demand origin to invalidate trade if broken.
Observations & Notes
The accumulation structure within demand was well-formed before the breakout.
Entry captured an early move with FVG alignment + inducement sweep.
Monitor for potential rejection near 448.96 (intermediate resistance) before TP.

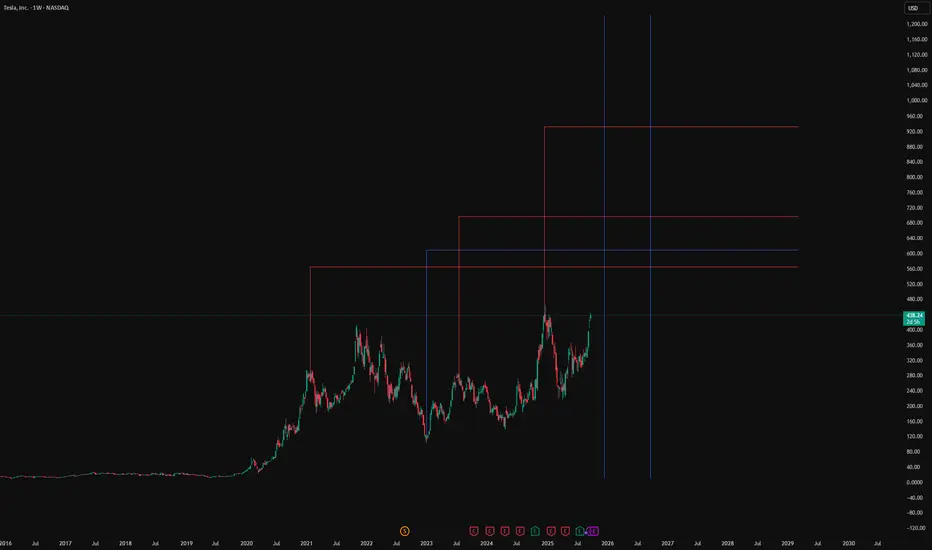
LevelsHere are some future levels of significance for Tesla in its uptrend - there should be significant reactions at these levels.
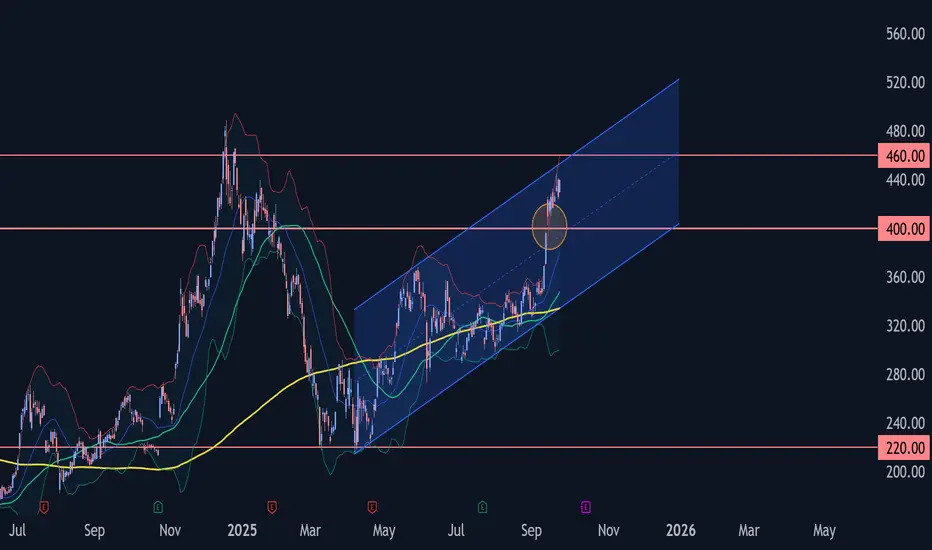
TESLA Wave Analysis – 24 September 2025
- TESLA rising inside impulse wave iii
- Likely to reach resistance level 460.00
TESLA has been rising in the last few trading sessions inside the sharp upward impulse wave iii – which belongs to the intermediate impulse wave C from June.
The price earlier broke above the round resistance level 400.00 - which strengthened the bullish pressure on TESLA.
Given the clear daily uptrend, TESLA can be expected to rise further in the active impulse wave iii toward the next resistance level 460.00 (target price for the completion of the active impulse wave iii).
TSLA Sep 23 – Bulls Testing 440, Gamma Fuel Could Stretch This MPrice Action & Setup (1-Hour Chart)
TSLA pushed from the mid-420s and tagged 440 intraday before easing into a tight sideways drift around 436. Price is riding the lower rail of an ascending channel that started last week. Key intraday support is stacked near 433 and 426; a deeper flush could revisit 417.5. Holding above 433 keeps the short-term trend intact and gives bulls a clean springboard for the next leg.
Momentum Read
MACD on the 1-hour is still positive though histogram bars are tapering—classic sign of a healthy pause rather than a breakdown. Stoch RSI hovers near 80, so a quick reset or sideways chop would help build energy for another push.
GEX (Options Flow) Confluence
Options positioning leans bullish and matches the chart:
* Highest positive GEX / Call resistance: ~436
* 2nd Call Wall: ~450 (near 70% call concentration)
* 3rd Call Wall: ~457.5–460
* Main Put Defenses: 417.5, 410, 405 and a big floor at 400
If TSLA can stay north of 436, market makers may keep hedging upward, creating a gamma squeeze potential into 450 and beyond. A clean break below 433 would start unwinding that gamma and bring 417.5 into play.
Trading Plan
* Upside scalp: Buy strength on a 440 break with a first target at 450 and a trailing stop under 433.
* Retest entry: If we dip to 433–426 and bounce with volume, that’s a low-risk reload spot aiming again for 440+.
* Bear hedge: Below 426 with heavy sell volume, short toward 417.5 makes sense.
Option Angle
For bullish plays, short-dated calls around the 440–450 strikes look attractive if 436 holds and IV stays reasonable. For hedging or quick shorts, puts near 417.5 or 410 work if a breakdown confirms.
Bottom Line
Trend bias stays up as long as TSLA holds 433–426. A strong hourly close over 440 could pull in more gamma fuel toward 450–457. Fail that zone and expect a deeper check toward 417.
Disclaimer: This is for educational discussion only and not financial advice. Always do your own research and manage risk.

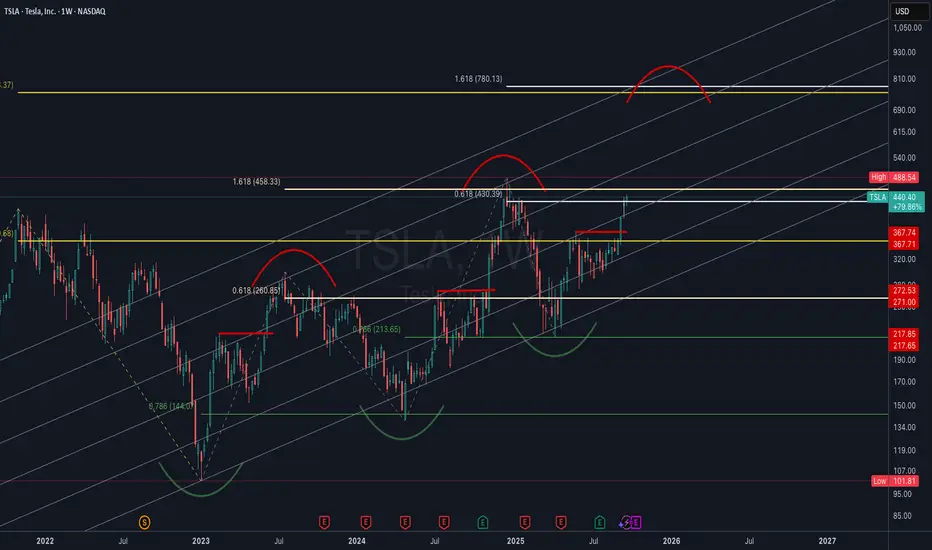
TSLA Weekly | Log Channel Analysis with Fibonacci ConfluenceThis chart presents Tesla (TSLA) on the weekly timeframe, plotted in logarithmic scale using a custom trend channel (not a pitchfork). The analysis combines price structure with key Fibonacci retracement and extension levels to highlight major inflection points in Tesla’s long-term trend.
Channel Structure: The log channel has consistently guided price swings, showing respect for both upper and lower boundaries across multiple cycles. This provides a framework for projecting potential tops and bottoms.
Fibonacci Confluence:
• Price is currently reacting around the 0.618 retracement ($430) from the previous major swing, a historically significant level for Tesla.
• Upside targets align with the 1.618 extensions ($753–$780), creating a strong confluence zone for a potential long-term resistance.
• Key downside supports sit at $367, $272, and $218, each coinciding with fib retracements and historical pivot zones.
Market Structure: The chart highlights repeating rounded top and bottom formations, suggesting cyclical behavior in Tesla’s price action. Rounded bottoms have historically marked accumulation zones, while rounded tops have aligned with distribution phases.
Current Outlook: After reclaiming the mid-channel region and pushing through significant resistance, Tesla is now at a pivotal stage. A confirmed breakout above $488 could open the path toward the higher channel range and eventual fib targets. Failure to hold $430, however, risks a retrace back to $367 or lower channel support.
TESLA Set To Fall! SELL!
My dear friends,
TESLA looks like it will make a good move, and here are the details:
The market is trading on 440.30 pivot level.
Bias - Bearish
Technical Indicators: Supper Trend generates a clear short signal while Pivot Point HL is currently determining the overall Bearish trend of the market.
Goal - 432.72
Recommended Stop Loss - 444.15
About Used Indicators:
Pivot points are a great way to identify areas of support and resistance, but they work best when combined with other kinds of technical analysis
Disclosure: I am part of Trade Nation's Influencer program and receive a monthly fee for using their TradingView charts in my analysis.
———————————
WISH YOU ALL LUCK

what is market needs ?market need a huge money to move < money will pass in market pocket to pocket.
each move is not same profit for them they also does not know how much they can earn so to minimize their loss they go for test .in test they have a pool we call it range/side. they feed small institute. they will help them with hedge funds in sharp move /.
when you want to trade . trust in just one trend do not trade by whole moves .

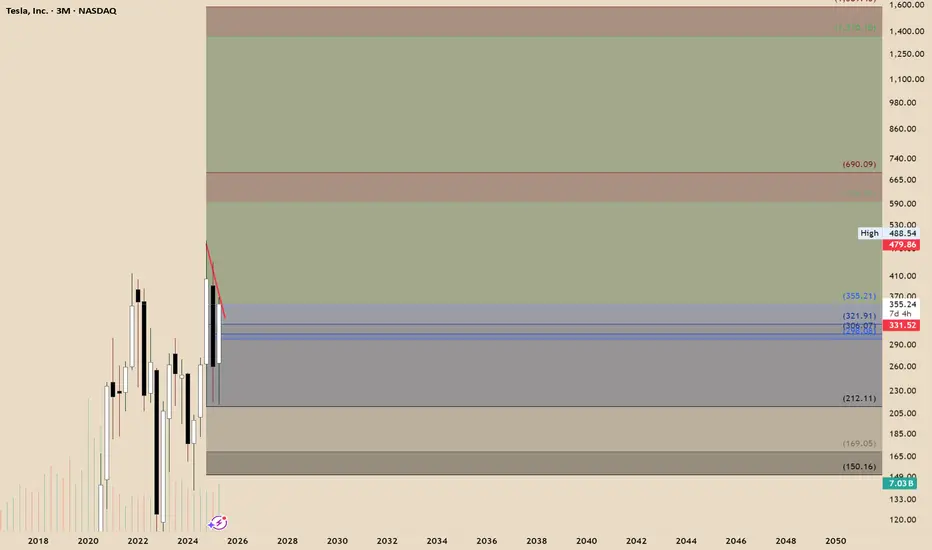
A Bullish Long-Term Outlook Tesla continues to present a compelling case for long-term investors, underpinned by its innovation-led growth trajectory and emerging dominance in autonomous mobility. Technically, recent market structure reveals an imbalance within a quarterly bullish breaker, suggesting further price expansion. If macroeconomic conditions remain favorable, the next algorithmic target zones fall between $594 and $690, signaling potential upside.
On the fundamental front, Tesla’s recent moves—particularly its rollout of the robotaxi network—have ignited fresh investor optimism. Analysts now estimate that autonomous driving could account for a substantial portion of Tesla’s future valuation, with some long-range forecasts placing the stock above $2,000 within the next several years.
While short-term pressures such as softening EV demand and regulatory barriers persist, Tesla’s consistent execution on AI-driven mobility may unlock new valuation territory.
TSLA looking for rejection around 200HMASo, I've been bearish on TSLA around that $400 mark and was waiting for more PA to evolve before calling the shots. It broke down. Quite rapidly actually. Currently looking to see what happens when price floats around that 200HMA in red. Also looking at weekly RSI that broke down the centre of the channel. If RSI on weekly cannot reclaim above centra at 50 and price has a hard time returning above 200HMA, I'll be looking for another leg down on HTF. I'm looking at weekly timeframe here so be mindful about that. I'm fluid. For me, price doesn't have to get a clean rejection for me to make up my mind. Although, that would make life easier, I'll also look at how price behaves around a certain price level. What I mean by that is: I don't care whether the price will go higher than that 200HMA in daily candles. I care about weekly closes and formations around that area.

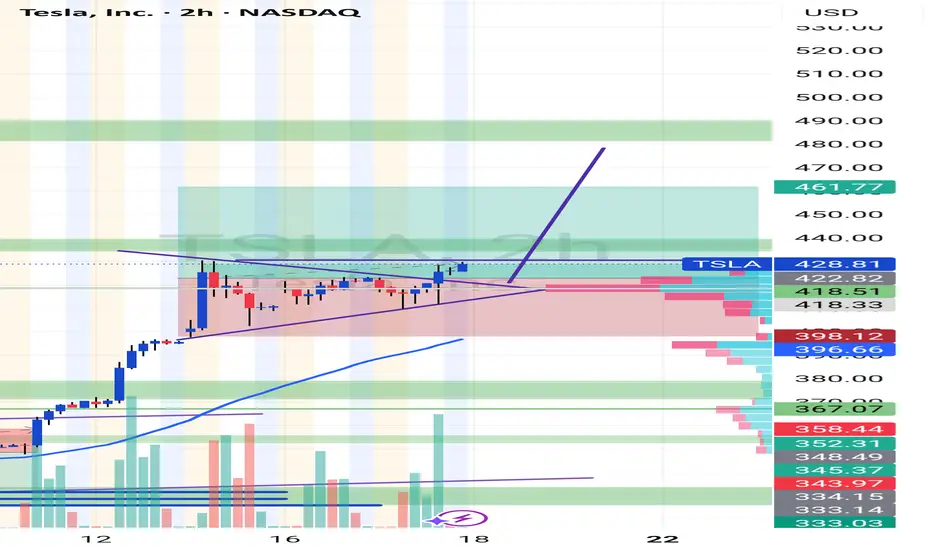
Bullish pennant pattern! This is what I'm looking at on the 2hr chart! It has finally broken out of this bullish pennant that was formed Monday, my price target now is somewhere 478/480 in the next few days! Will see ... this is NOT financial advice! Just sharing my personal analysis! That's all, Thanks!
HOW MUCH HIGHER CAN TESLA GO? (September 17, 2025)Since my last video Tesla stock is up over 25% in the past week and we are breaking a very key Fibonacci levels.
In this video, we look at a higher timeframe charts to determine if Tesla can keep pushing towards $600 and $1000 in the coming months ahead given how much it is outperforming everything else in the stock market
