Tesla's New Range. Hello I am the Cafe Trader.
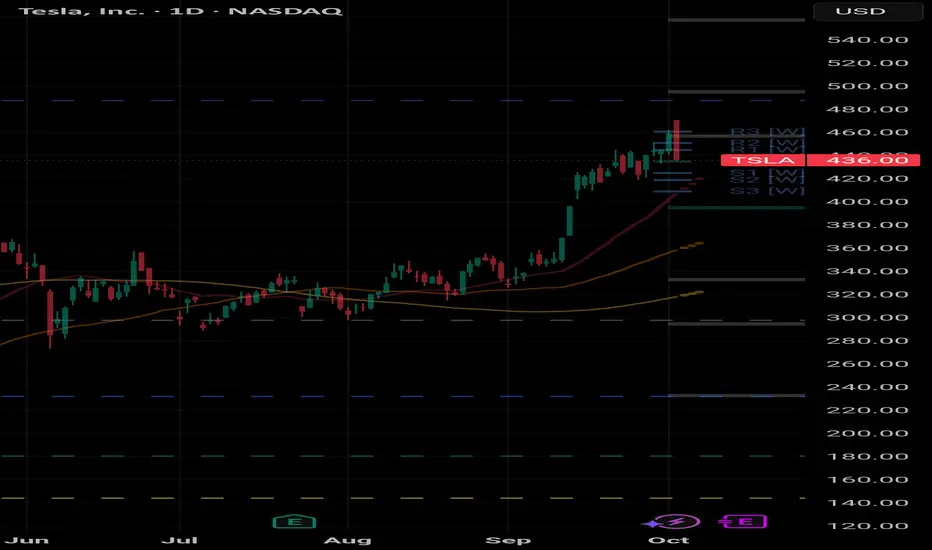
Today we are revisiting Tesla (TSLA).
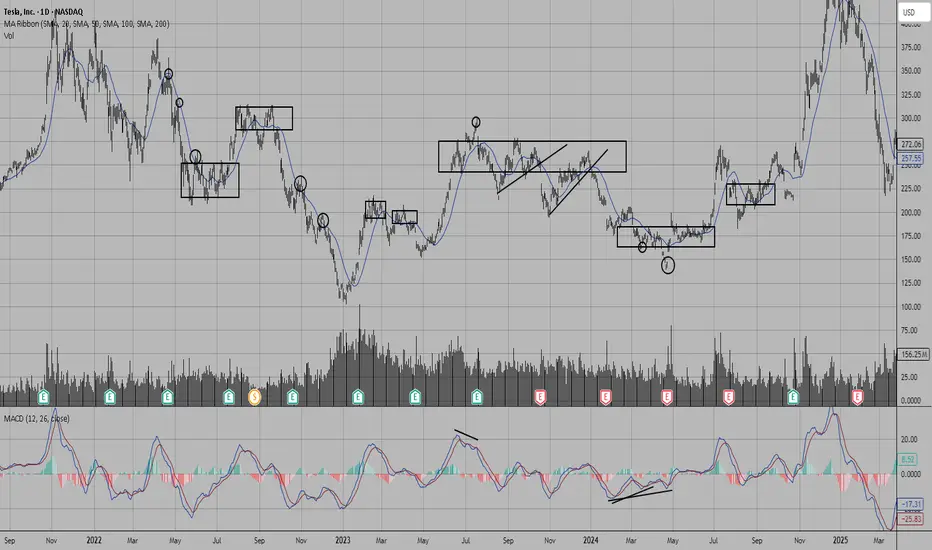
Last article we identified the Key seller before this big extension. Today I have identified the last key seller, and how you can capitalize.
Price has now entered into the Light Supply Zone , a place where sellers will try to slow things down.
It is likely that you will want to play TSLA at the Extremes. Strong Supply , and Strong Demand levels are going to give you the best chance at a stronger reaction. So if you are playing the short term, These two plays marked on the chart will be your best bet.
If the Strong Buyers hold at around 417, This will put a lot of pressure on that last strong seller at 461. A push through them should see you ATH's (not without a strong reaction from the Strong Supply first).
Missed out on the move and want to add TSLA to your long term?
Long Term
These Prices should match your conviction on TSLA:
Aggressive : 409 - 419.50 (Top of Demand, even better if you get into those strong buyers)
Value : 333-344
Extreme Value : 288-294 or the Conservative Trendline.
Expect big things from TSLA in the coming years. I would not be surprised to see TSLA reach over 1,000 again.
Happy Trading,
@thecafetrader
TSLA trade ideas

Tesla - Here we goooooo!🚗Tesla ( NASDAQ:TSLA ) is finally breaking out:
🔎Analysis summary:
Finally, after a consolidation of four years, Tesla is attempting another all time high breakout. With the bullish triangle coming to an end, bulls are dominating this stock. It just comes down to the next couple of months but a triangle breakout remains far more likely.
📝Levels to watch:
$400
SwingTraderPhil
SwingTrading.Simplified. | Investing.Simplified. | #LONGTERMVISION

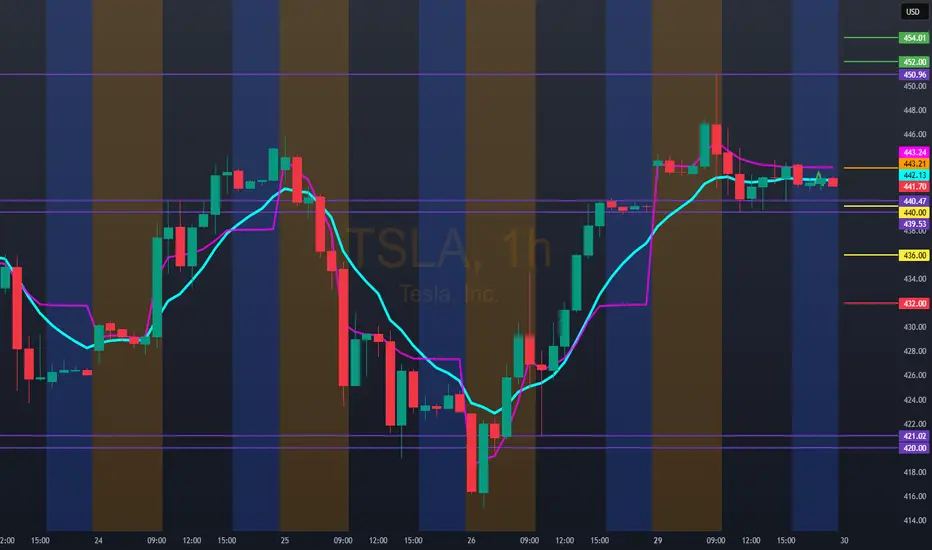
Hello trader, for tomorrow, 9/30/25, TSLA: 443.21Bullish entry above 454.00 with possible upside projection to 488.54, stop below vwap
Bearish entry only below 432.00. We could experiment with a rebound zone at 440.00/436.00, stop above vwap
TESLA: Short Trading Opportunity
TESLA
- Classic bearish formation
- Our team expects pullback
SUGGESTED TRADE:
Swing Trade
Short TESLA
Entry - 440.32
Sl - 443.84
Tp - 432.53
Our Risk - 1%
Start protection of your profits from lower levels
Disclosure: I am part of Trade Nation's Influencer program and receive a monthly fee for using their TradingView charts in my analysis.
❤️ Please, support our work with like & comment! ❤️

TSLA LONG SWING READ NOTES 25 SEP 2025I have bought some Tesla stocks now around $424 for swings. I know market is all time high & Tsla can do $450 here. I am just taking market over all support which is again very poor.
This is an average trade
If you are not confident dont trade.
I have gone long with stocks only

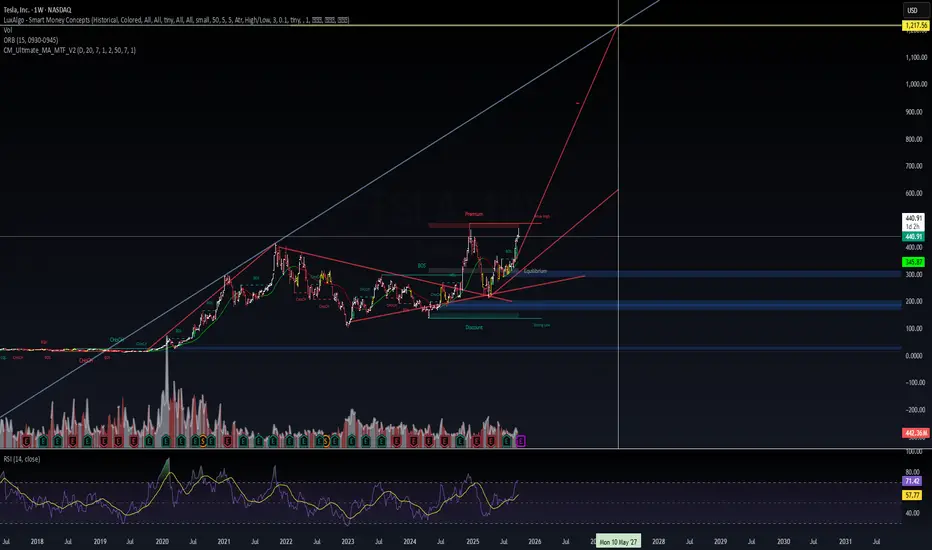
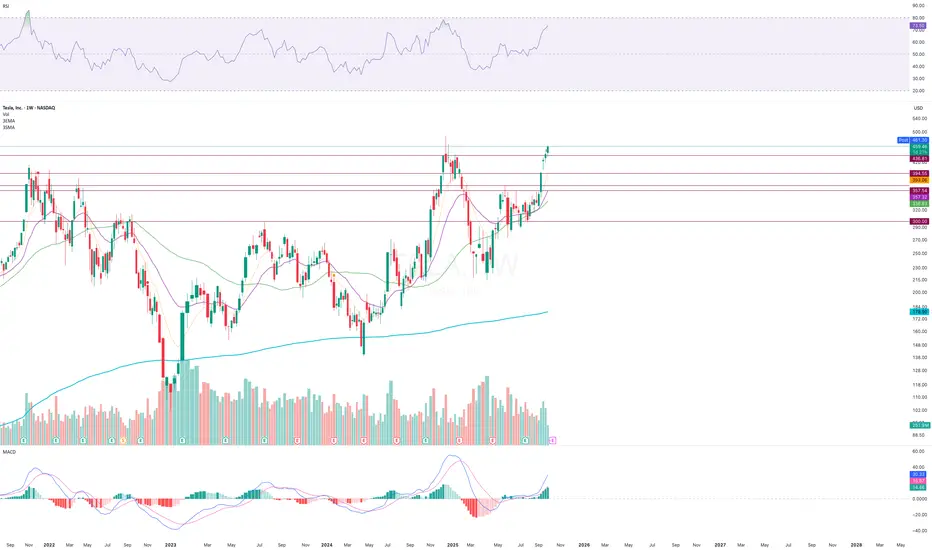
$TSLA – Weekly Outlook📊 NASDAQ:TSLA – Weekly Outlook
Price is holding above equilibrium (~400) after reclaiming structure.
Strong base formed in discount zone (~345–300) now acting as support.
RSI on weekly = 71.4 → momentum strong, trending into overbought.
Long-term projection points toward $1,217.56 (extension target).
🎯 Scenarios
Bull case (70%)
Hold >400 → momentum unlocks premium zone.
Next upside pivots: 470 → 600 → 1,217 (extension).
Bear case (30%)
Break <400 → return to equilibrium/discount at 345–300.
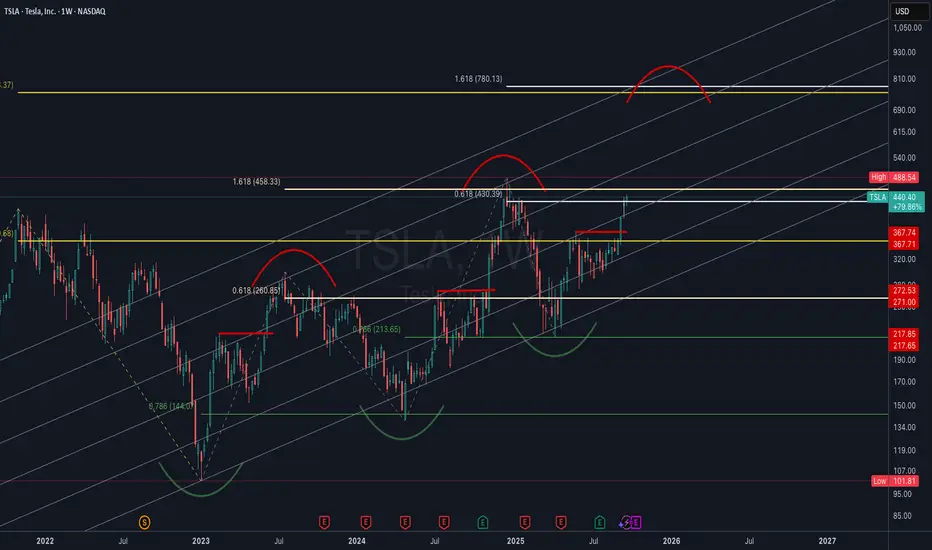
TSLA Weekly | Log Channel Analysis with Fibonacci ConfluenceThis chart presents Tesla (TSLA) on the weekly timeframe, plotted in logarithmic scale using a custom trend channel (not a pitchfork). The analysis combines price structure with key Fibonacci retracement and extension levels to highlight major inflection points in Tesla’s long-term trend.
Channel Structure: The log channel has consistently guided price swings, showing respect for both upper and lower boundaries across multiple cycles. This provides a framework for projecting potential tops and bottoms.
Fibonacci Confluence:
• Price is currently reacting around the 0.618 retracement ($430) from the previous major swing, a historically significant level for Tesla.
• Upside targets align with the 1.618 extensions ($753–$780), creating a strong confluence zone for a potential long-term resistance.
• Key downside supports sit at $367, $272, and $218, each coinciding with fib retracements and historical pivot zones.
Market Structure: The chart highlights repeating rounded top and bottom formations, suggesting cyclical behavior in Tesla’s price action. Rounded bottoms have historically marked accumulation zones, while rounded tops have aligned with distribution phases.
Current Outlook: After reclaiming the mid-channel region and pushing through significant resistance, Tesla is now at a pivotal stage. A confirmed breakout above $488 could open the path toward the higher channel range and eventual fib targets. Failure to hold $430, however, risks a retrace back to $367 or lower channel support.
I know you dont like me but..but... the whole universe is a huge fractal. Repetition inside a repetition repeated over time. Trading and investing is not far away from philosophy.
Look ar my BTC fractal prediction. its simple on point week by week.
Not an investment advice. Go to meditate.
Elon rules.

TSLA TeslaToday’s session printed a dark candle with heavy pressure and big price action — not the best look from a candlestick perspective. The immediate support sits at the uptrend line near 433. If price can hold that level tomorrow, the uptrend remains intact. But if we get a decisive close below, expect a sharper drop. First downside target would be 405, and if that fails, we could see an extension toward 370–360, lining up with the previous lower uptrend line. Tomorrow’s price action at that 433 support is critical — watch it closely. follow me on X Enginv777

TESLA Set To Fall! SELL!
My dear friends,
TESLA looks like it will make a good move, and here are the details:
The market is trading on 440.30 pivot level.
Bias - Bearish
Technical Indicators: Supper Trend generates a clear short signal while Pivot Point HL is currently determining the overall Bearish trend of the market.
Goal - 432.72
Recommended Stop Loss - 444.15
About Used Indicators:
Pivot points are a great way to identify areas of support and resistance, but they work best when combined with other kinds of technical analysis
Disclosure: I am part of Trade Nation's Influencer program and receive a monthly fee for using their TradingView charts in my analysis.
———————————
WISH YOU ALL LUCK

SMA 20: The most used, simple, and useful indicatorThe 20-period Simple Moving Average ( SMA 20 ) is easy to calculate and widely used, though often undervalued by traders eager for novelty. Its presence is notable in popular technical indicators like Bollinger Bands and Donchian Channels. Even the most purist price action traders include it on their charts, valuing its ability to identify trends and key support and resistance levels. Today, I want to explore the practical uses traders can derive from this versatile indicator.
Behavioral Patterns
Technical Analysis emerged from the detection and study of repetitive patterns or phenomena. These patterns are intrinsically tied to investor psychology, and their influence on decision-making is fundamental.
Repetitive patterns around an SMA 20 typically indicate that a trend has strength and stability, attracting investors and paving the way for highly effective systems or methodologies. One of my favorites involves identifying entry points in strong trends that have clearly respected the SMA 20.
Figures 1 and 2 illustrate this type of approach:
Figure 1:
Figure 2:
Price Overextensions
A price overextension in trading refers to an extreme price movement that significantly deviates from its average or reference level. This phenomenon often indicates that the price has moved too far, too fast in one direction (bullish or bearish) over a short period, suggesting a potential reversal or correction.
The SMA 20 is extremely useful for visually detecting these phenomena. Moreover, when trading in high-volatility contexts like overextensions, the SMA 20 can serve as a safe exit zone.
In Figure 3, you can observe how the price extends twice, significantly diverging from the SMA 20. The first overextension wouldn’t have been sufficient for an entry, but the second overextension generated a clear bearish divergence, which, combined with price action, would have validated a short entry.
The SMA 20 is a discreet target for taking profits without excessive exposure. This leverages a widely applied statistical concept in markets: mean reversion.
Figure 3:
Breakout Trading
Breakout trading involves entering the market when an asset’s price breaks through a key support or resistance level, with the expectation that the movement will continue in the breakout direction.
A price action phenomenon that significantly increases the likelihood of a successful breakout is pre-breakout tension , a state of compressed supply and demand characterized by a narrow range, low volatility, and order accumulation at key levels.
The SMA 20 is extremely useful for clearly identifying the dominance between buying and selling forces, as well as visually highlighting pre-breakout tension.
In Figure 4, I use a 20-period Exponential Moving Average (EMA 20) to increase sensitivity to the indicator’s changes.
Notice how the EMA 20 seems to compress the price against the range’s boundaries, as if trying to push it out.
Figure 4:
Retest Patterns
A retest occurs when, after breaking a significant support or resistance, opposing forces push back to test the strength of the prior level.
In Figure 5, you can see how, after a bearish breakout from an exhaustion pattern, bulls attack strongly but encounter resistance at what was previously a breached support. An SMA 20 aligned with this zone increases the level’s robustness, which is defended by sellers who see an excellent profit opportunity.
Figure 5:
Figure 6 shows an opposite example.
Figure 6:
Conclusions
With this brief overview, I aim to demonstrate that it’s not necessary to rely on novel or complex technical indicators to make sound market decisions. In Technical Analysis, simplicity, combined with deep understanding, often yields significant results.
Final Note
If you’d like to take a look at my analysis record, you can find my profile in Spanish, where I transparently share well-defined market entries. Send your good vibes if you enjoyed this article, and may God bless you all.
Long trade Trade Journal Entry
Pair/Asset: TSLA (Tesla Inc.)
Trade Type: Buyside trade
Date: Friday, 26th Sept 2025
Session: London to New York Session AM (11:00 AM)
Trade Details
Entry: 427.51
Profit Level (TP): 465.20 (+8.82%)
Stop Level (SL): 425.82 (-0.40%)
Risk–Reward (RR): 22.3
Technical Narrative
Pre-Trade Context:
The price consolidated above a demand zone at 423–427, which coincided with the origin of a prior order block. Inducement & BOS (Break of Structure) confirmed bullish intent.
Several fair value gaps (FVGs) were present on the climb, supporting bullish continuation.
Entry Justification:
*Entry at 427.51 aligns with the mitigation of the demand zone and FVG fill.
*The structure flipped bullish after the sweep of local lows, setting the stage for an upside liquidity grab.
Target Rationale:
*TP aimed at 465.20, aligning with the previous swing high and liquidity above.
*Clean imbalances left on the rally offer magnets for price.
Risk Management:
Tight SL at 425.82, just below the demand origin to invalidate trade if broken.
Observations & Notes
The accumulation structure within demand was well-formed before the breakout.
Entry captured an early move with FVG alignment + inducement sweep.
Monitor for potential rejection near 448.96 (intermediate resistance) before TP.

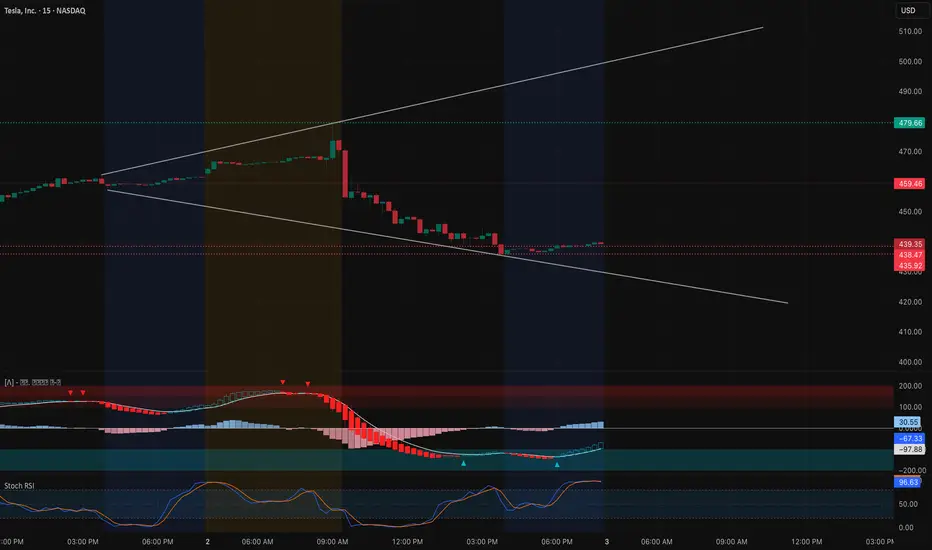
TSLA At a Crossroads: Bounce or Breakdown for Oct 3? Intraday Technical Outlook (15m Chart)
Tesla (TSLA) saw a sharp selloff, sliding from the mid-$470s to close near $439.35. On the 15-minute chart, the structure is now hugging a descending support line:
* MACD: Still deep in bearish territory but showing early signs of momentum cooling as histogram bars lighten.
* Stoch RSI: Reset from extreme oversold levels, suggesting potential for a relief bounce.
* Key Levels: Immediate support rests around $435–432, with a breakdown exposing $425–420. On the upside, first resistance is $445, followed by a more critical level at $452.5.
Intraday takeaway: Short-term traders should watch if TSLA holds above $435. A sustained bounce can spark a retrace to $445–452, while failure risks another leg lower toward $425.
Options Sentiment & GEX Outlook (1H Chart)
The 1-hour GEX map paints a decisive risk zone for tomorrow’s trade:
* Gamma Walls:
* $452.5–460: Strong call resistance cluster, where sellers likely re-emerge.
* $439.5: Key gamma pivot — trading below this opens up bearish flows.
* $432 / $425 / $420: Heavy put walls acting as magnets if weakness persists.
* Implications:
* Holding above $439.5 can squeeze shorts toward $445–452.5, offering upside for quick calls.
* Losing $435 confirms dealer hedging pressure lower, opening room to $425–420, favoring puts.
* Volatility Context: IVR at 26.9 vs IVx avg 65.2 shows premiums are mid-range but still elevated. This means intraday traders may prefer spreads over outright calls/puts to balance risk/reward.
My Thoughts & Recommendation
For Oct 3 trading, Tesla is sitting right at a critical gamma pivot.
* Intraday (scalping/trading): Look for a bounce play off $435, with upside targets at $445–452 if momentum aligns. A breakdown below $432 favors continuation toward $425–420.
* Options trading (swing/0DTE): Call positions only make sense above $439.5, with tight stops and targets capped near $452. Put strategies (vertical spreads or debit puts) look stronger if price fails at $439.5 and rolls back toward $425.
Bias heading into Oct 3: Cautiously bearish unless $439.5 is reclaimed with volume.
Disclaimer:
This analysis is for educational purposes only and does not constitute financial advice. Always conduct your own research and manage risk before trading.
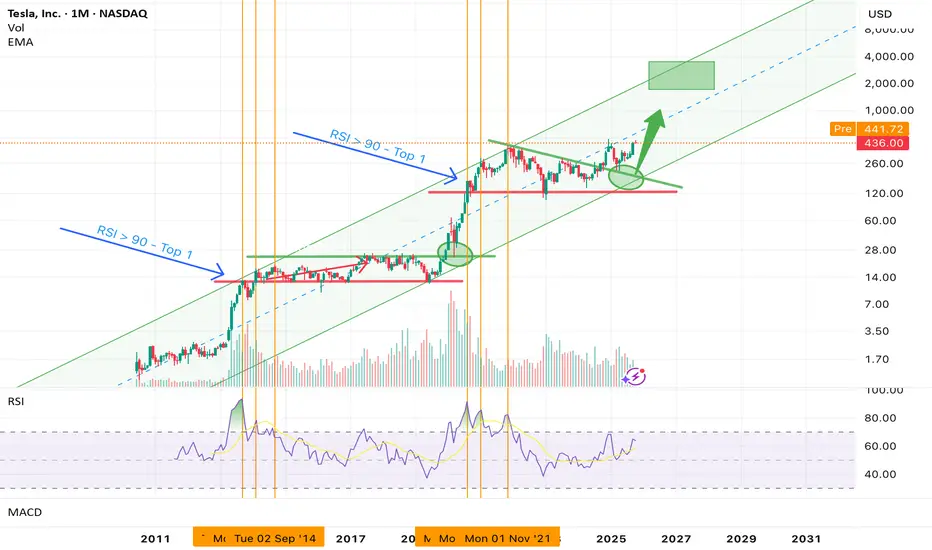
Tesla (TSLA) – RSI Signals New Bull Cycle, Not Near the TopTechnical View: Trend intact. Momentum constructive. Cycle still maturing. The RSI roadmap suggests the story is far from over — and the most explosive phase may still lie ahead.
Summary:
Back in April , we identified the $270–$320 region as a decisive long-term support zone — a confluence of the 0.382–0.5 Fibonacci retracement levels and the lower boundary of Tesla’s decade-long rising channel. That analysis has played out perfectly: TSLA retested this zone, built a solid base, and resumed its uptrend.
Today, with the stock trading above $430 and advancing toward the channel median — already within proximity of the next resistance zone around $480–$500 — the most powerful signal comes from momentum rather than price. The monthly RSI tells us something crucial: we are not near a cycle top. In fact, historical patterns suggest Tesla is entering the expansion phase of a new multi-year bull cycle , with much higher prices still ahead.
RSI and Market Cycles: What History Tells Us
Tesla’s two previous major bull markets — in 2013–2014 and 2019–2021 — followed a remarkably similar script before topping out:
The first euphoric peak of each cycle coincided with a monthly RSI above 90 , not in the middle of the channel but as price pushed into — and slightly above — the upper boundary.
After that first RSI > 90 event, the stock posted two higher highs with lower RSI peaks , a textbook sign of momentum exhaustion (bearish divergence).
The result each time: a sharp correction of 45–75% .
Today, RSI sits near 56 — nowhere close to overbought extremes. This strongly implies that Tesla is still in the mid-cycle expansion stage — a phase historically associated with sustained institutional accumulation, accelerating price gains, and multiple expansion.
Even more importantly, if history repeats, RSI > 90 will not occur until price reaches the upper boundary or slightly breaks above it . Based on current channel geometry, that implies a potential first euphoric peak in the $1,200–$1,600 range — far above where the stock trades today.
My Prediction and Trade Idea
I believe Tesla is now in the second phase of a new multi-year bull cycle, likely playing out over the next 18–30 months . The technical setup — price structure, channel dynamics, and RSI behaviour — all point to continued upside.
My base-case roadmap:
Near-term: Tesla approaches the $480–$500 resistance area (upper half of the channel) in the coming months.
Mid-term: A breakout above $500 could trigger a sustained expansion leg toward $650–$700.
Late-cycle: As momentum peaks and RSI nears 90, price could accelerate into the $1,200–$1,600 zone — the area historically associated with euphoric tops.
For long-term investors and swing traders, the current risk-reward profile remains compelling. As long as Tesla holds above the $320 accumulation zone, the path of least resistance remains higher.
Profit Targets and Stop Loss
First Target : $480–$500 (upper half of the channel)
Second Target : $650–$700 (mid-cycle breakout extension)
Third Target : $1,200–$1,600 (historical RSI > 90 / euphoric top zone)
Stop-Loss Strategy:
A sustained monthly close below $320 would invalidate the mid-cycle thesis and suggest a deeper corrective structure. For traders, this remains the technical “line in the sand.”
Risks to Consider
While the technical backdrop is bullish, several risks could challenge this thesis:
Macro Shifts : Higher-for-longer rates or a global recession could compress growth multiples.
Execution Risk : Delays in autonomy, robotics, or the energy business could dampen investor enthusiasm.
Valuation Pressure : Tesla’s premium valuation makes it sensitive to changes in growth expectations.
Momentum Signals : If RSI fails to advance significantly during the next leg higher, it may signal internal weakness and an earlier-than-expected cycle peak.
Conclusion
Tesla’s long-term uptrend remains robust, key support has held, and momentum indicators show we are still early in a powerful new bull cycle. Historical RSI behaviour strongly suggests that the first euphoric phase — where RSI exceeds 90 and a true cycle top begins to form — will occur at much higher levels , likely $1,200–$1,600 .
Until then, price action, structure, and momentum all point to continued appreciation. As long as support holds above $320, the base-case scenario is clear: Tesla’s next major move is higher — and the market is still writing the early chapters of this bull cycle .
$TSLA: Let The Rally Speak For Itself - 9/16/2025Based on the analysis, it’s confirmed that NASDAQ:TSLA has initiated a new rally following the completion of a lengthy and complex corrective structure at $288.
The stock bounced twice off the 50-week moving average, signaling strong support as the correction neared its end.
Due to the depth and complexity of the structure, Wave 3 is expected to unfold with high momentum, potentially delivering an explosive rally. Key upside targets are displayed in the chart — we’ll be watching closely to see how price reacts at those levels.
📚 Note: The internal structure and labeling were intentionally left visible in the chart for educational purposes. This is especially useful for traders interested in Modern Trading Algorithms and their structural variations.
Happy Trading, and let the rally speak for itself. 🚀

TSLA testInvestment Strategy: Rebalances quarterly to maintain exposure to high-momentum stocks while capping individual holdings at ~5% to manage risk. This factor-based approach aims to outperform the broader S&P 500 over the long term by riding momentum wav
$TSLA to $5,000 #CathiesBack!!! #Bullflag #AlwaysHasBeenSome Bull #corn for the PermaBulls out there after this V recoVery on Indices...
Just some log scale mathematical measurements from one flagpole to the next...
#AnythingIsPossible if Physics allows... Tesla at 5k is simply tesla at 5Trillion valuation... once self driving fulfilled? Odds increasing with GPU/AI capabilities...
NASDAQ:NVDA should be a major green light for the next leg up in markets or rejection... definitely leaning bullish still after V , dips to be bought in this environment...

Introduction to Bond Investing and Its Typesation
Bonds often move inversely to equities. When stock markets are volatile, bonds can provide stability, reducing overall portfolio risk.
2.4 Tax Benefits
Certain bonds, such as municipal bonds in the U.S., offer tax-free interest, making them attractive for investors in higher tax brackets. Similarly, tax-free bonds in India provide interest income exempt from income tax.
2.5 Hedging Against Inflation
While not all bonds hedge against inflation, inflation-linked bonds (like TIPS in the U.S. or Inflation-Indexed Bonds in India) adjust principal or interest based on inflation, protecting investors’ purchasing power.
3. Key Risks in Bond Investing
Despite their reputation as safe investments, bonds carry risks:
Interest Rate Risk: When interest rates rise, bond prices fall, and vice versa. Long-term bonds are more sensitive to rate changes.
Credit Risk: Risk of issuer default, especially in corporate or high-yield bonds.
Reinvestment Risk: Risk that interest income cannot be reinvested at the same rate.
Inflation Risk: Fixed interest payments may lose value if inflation rises faster than expected.
Liquidity Risk: Difficulty in selling bonds quickly at a fair price, especially for low-volume corporate bonds.
Investors must weigh these risks against their income and capital preservation goals.
4. Types of Bonds
Bonds can be classified in multiple ways—by issuer, maturity, interest structure, and risk level. Understanding these types helps investors choose bonds aligning with their investment objectives.
4.1 Based on Issuer
4.1.1 Government Bonds
Issued by central or state governments to finance budget deficits or infrastructure projects. These bonds are considered low-risk. Examples include:
Treasury Bonds (T-Bonds): Long-term securities issued by the U.S. Treasury.
G-Secs (Government Securities) in India: Bonds issued by the Reserve Bank of India on behalf of the government.
Municipal Bonds: Issued by local governments or municipalities; often tax-free.
Features:
Low default risk
Lower yields compared to corporate bonds
Highly liquid
4.1.2 Corporate Bonds
Issued by companies to raise capital for expansion or operations. They typically offer higher yields than government bonds to compensate for higher risk.
Types of Corporate Bonds:
Investment-Grade Bonds: High credit quality (AAA to BBB).
High-Yield (Junk) Bonds: Lower credit quality, higher risk, higher returns.
4.1.3 Supranational Bonds
Issued by international organizations like the World Bank or IMF. Considered safe due to backing by multiple governments.
4.2 Based on Maturity
4.2.1 Short-Term Bonds
Maturity less than 3 years.
Advantages: Low interest rate risk, high liquidity.
Disadvantages: Lower yields.
4.2.2 Medium-Term Bonds
Maturity between 3–10 years. Balance between yield and interest rate risk.
4.2.3 Long-Term Bonds
Maturity above 10 years.
Advantages: Higher yields.
Disadvantages: High interest rate sensitivity, price volatility.
4.3 Based on Interest Structure
4.3.1 Fixed-Rate Bonds
Pay a fixed coupon rate over the bond’s life. Simple to understand, predictable income.
4.3.2 Floating-Rate Bonds
Coupon rate adjusts periodically based on a benchmark rate, like LIBOR or RBI repo rate. Protects against interest rate fluctuations.
4.3.3 Zero-Coupon Bonds
No periodic interest; sold at a discount and redeemed at face value. Profit comes from the difference between purchase price and face value.
4.3.4 Inflation-Linked Bonds
Principal or interest adjusts according to inflation, protecting the investor’s purchasing power. Example: U.S. TIPS or India’s Inflation-Indexed Bonds.
4.4 Based on Risk Level
AAA/Investment-Grade Bonds: Low risk, stable returns.
High-Yield/Junk Bonds: Higher default risk, higher returns.
Convertible Bonds: Can be converted into company stock, offering upside potential with lower interest.
5. How Bonds Are Priced
Bond prices fluctuate in response to interest rates, credit risk, and market demand. The key concepts in bond pricing include:
Par Value: Price at which the bond is issued.
Premium: Price above face value when coupon rates exceed market rates.
Discount: Price below face value when coupon rates are lower than market rates.
Yield to Maturity (YTM): The total return expected if the bond is held to maturity, accounting for interest payments and capital gain/loss.
Example: A 5-year bond with ₹1,000 face value and 8% coupon rate may trade at ₹950 if market interest rates rise to 9%.
6. Methods of Investing in Bonds
6.1 Direct Bond Purchase
Investors buy bonds through brokers or banks. Suitable for large portfolios and those seeking control over bond selection.
6.2 Bond Mutual Funds
Mutual funds pool money to invest in a diversified portfolio of bonds. Benefits include professional management, diversification, and liquidity.
6.3 Exchange-Traded Funds (ETFs)
Bond ETFs track bond indices and trade like stocks on exchanges. Offer liquidity and diversification with lower minimum investment.
6.4 Laddering Strategy
Investing in bonds with different maturities to manage reinvestment risk and maintain steady income.
7. Factors to Consider Before Investing in Bonds
Investment Objective: Income, capital preservation, or growth.
Risk Tolerance: Comfort with interest rate fluctuations and default risk.
Liquidity Needs: Ability to sell bonds without loss.
Economic Outlook: Interest rate trends, inflation, and credit market conditions.
Tax Implications: Consider tax-exempt bonds or tax-deferred accounts.
8. Advantages of Bond Investing
Steady income and cash flow
Capital preservation, especially with government bonds
Portfolio diversification and lower volatility
Tax benefits for certain types of bonds
Access to professional management through funds and ETFs
9. Disadvantages of Bond Investing
Interest rate sensitivity can lead to price volatility
Credit risk in corporate or high-yield bonds
Lower potential returns compared to equities
Inflation can erode real returns
10. Current Trends in Bond Markets
Increasing interest rates impact bond prices negatively.
Rise of green bonds and ESG (Environmental, Social, Governance) bonds for sustainable investing.
Growing popularity of bond ETFs for retail investors.
Central banks actively using bonds for monetary policy interventions.
11. Conclusion
Bond investing plays a critical role in building a balanced investment portfolio. By understanding the types of bonds, their risks, and returns, investors can make informed decisions that align with their financial goals. Whether seeking stable income, capital preservation, or hedging against market volatility, bonds provide an essential foundation for both individual and institutional investors.
Successful bond investing requires careful assessment of credit quality, interest rate trends, and diversification strategies. Using a mix of government, corporate, and specialized bonds like inflation-linked securities, investors can optimize returns while minimizing risk.
what is market needs ?market need a huge money to move < money will pass in market pocket to pocket.
each move is not same profit for them they also does not know how much they can earn so to minimize their loss they go for test .in test they have a pool we call it range/side. they feed small institute. they will help them with hedge funds in sharp move /.
when you want to trade . trust in just one trend do not trade by whole moves .

$TSLA revert to mean? Would really like a NASDAQ:TSLA gap close just below 400, but would REALLY love 360/350.
NASDAQ:TSLA
TSLA looking for rejection around 200HMASo, I've been bearish on TSLA around that $400 mark and was waiting for more PA to evolve before calling the shots. It broke down. Quite rapidly actually. Currently looking to see what happens when price floats around that 200HMA in red. Also looking at weekly RSI that broke down the centre of the channel. If RSI on weekly cannot reclaim above centra at 50 and price has a hard time returning above 200HMA, I'll be looking for another leg down on HTF. I'm looking at weekly timeframe here so be mindful about that. I'm fluid. For me, price doesn't have to get a clean rejection for me to make up my mind. Although, that would make life easier, I'll also look at how price behaves around a certain price level. What I mean by that is: I don't care whether the price will go higher than that 200HMA in daily candles. I care about weekly closes and formations around that area.

Tesla - SHOW ME THE CHART AND I WILL TELL YOU THE NEWS!Back in June and July, Elon and Tesla were STILL getting a lot of bad press (Elon fighting with President Trump, people burning Tesla cars etc). Those that follow me may recall on July 29th I wrote the following:
"Tesla just needs a narrative shift (ie -new invention etc), & price action changes in a heart beat.
Yet, price action really has less to do with the news making Elon a hero, then a villain and then back and forth...but moreso to do with price action patterns that just keep repeating".
And you'll note that my July chart suggested that the huge pump to $400+ would begin around Sept 1st (Huge green arrow after the retest). What a coincidence that 2 weeks later Elon announces a $1Billion dollar Tesla stock buy (the new anticipated "narrative"). My huge green arrow was there many weeks before this "news". How could I have known?
SHOW ME THE CHART AND I WILL TELL YOU THE NEWS.
On July 29th Tesla was $321 and I suggested that Tesla was about to have a major breakout to at least $400 "with no major retraces". That target has now been hit. Is it because of the news or is it the patterns that just keep repeating?
My T1 targets are probable targets, so I anticipate them almost always getting hit. My ideal buy and sell targets are T2. Tesla now appears to be headed into my T2 target, so it's time to start monitoring price action closely.

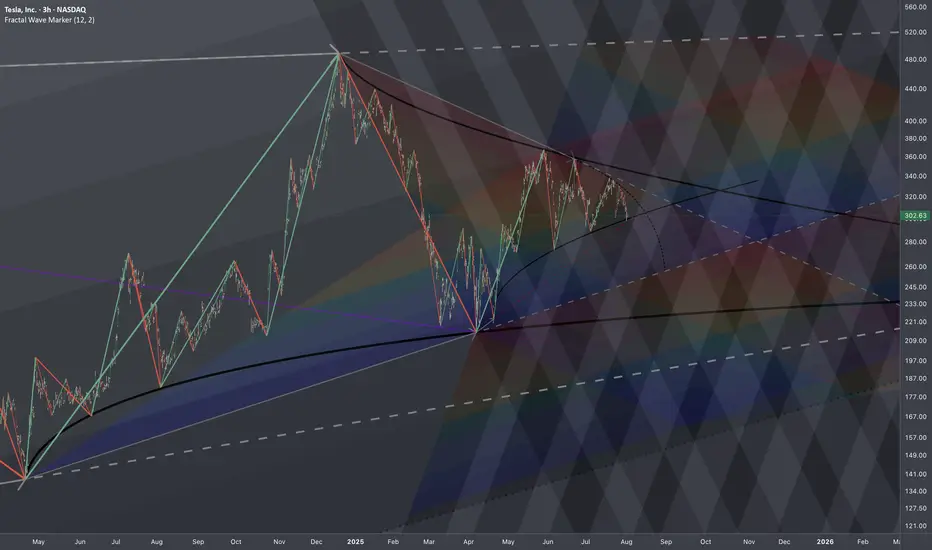
$TSLA: Branching Effect🏛️ Research Notes
Reaching branching effect through cross-cycle interconnection. Alongside I'll test some elements mentioned below.
Local Progressions
Rhyme and levels derived from apparent cycle compression.
Added channels with darkening gradient that cover bullrun from mid 2019, driven by angle of tops.
In the local scope, as price deepens into denser zone the probability of disproportional reaction gets higher. t would probably complete its intermediate and even longer-term cycles before escaping the boundary.