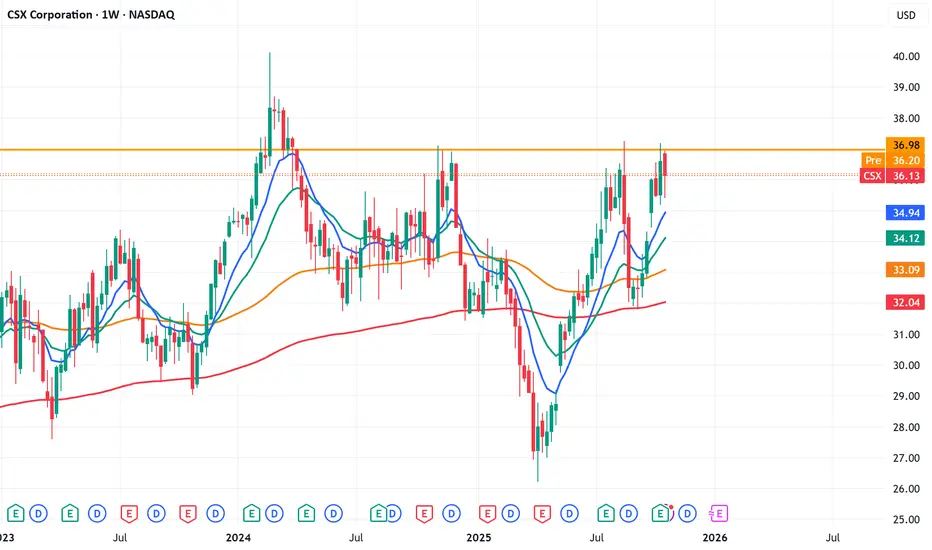
CSX Corp. getting ready for the breakoutCSX has formed inverted H&S pattern on weekly TF. Neckline is at 37 level, Keep an eye on it
20,886.36
0.00 BRL
18.71 B BRL
78.38 B BRL
About CSX Corporation
Sector
Industry
CEO
Stephen F. Angel
Website
Headquarters
Jacksonville
Founded
1827
ISIN
BRCSXCBDR005
FIGI
BBG00P14JWK1
CSX Corp. engages in the provision of rail-based freight transportation services. Its services include rail service, the transport of intermodal containers and trailers, rail-to-truck transfers and bulk commodity operations. It operates through Rail and Trucking segments. The Rail segment provides rail-based transportation services including traditional rail service and the transport of intermodal containers. The Trucking segment consists of Quality Carriers. The company was founded in 1827 and is headquartered in Jacksonville, FL.
Related stocks
CSX Stock Chart Fibonacci Analysis 051425Trading Idea
1) Find a FIBO slingshot
2) Check FIBO 61.80% level
3) Entry Point > 30/61.80%
Chart time frame: D
A) 15 min(1W-3M)
B) 1 hr(3M-6M)
C) 4 hr(6M-1year)
D) 1 day(1-3years)
Stock progress: A
A) Keep rising over 61.80% resistance
B) 61.80% resistance
C) 61.80% support
D) Hit the bottom
E

CSX in Buy ZoneMy trading plan is very simple.
I buy or sell when at three of these events happen:
* Price tags the top or bottom of parallel channel zones
* Money flow spikes beyond it's Bollinger Bands
* Stochastic Momentum Index (SMI) at near oversold overbought level
* Price at Fibonacci levels
So...
Here's
CSX Corporation Options Ahead of EarningsIf you haven`t bought CSX before the previous rally:
Now analyzing the options chain and the chart patterns of CSX Corporation prior to the earnings report this week,
I would consider purchasing the 35usd strike price Calls with
an expiration date of 2025-6-20,
for a premium of approximately $1.10

$CSX with a neutral outlook following its earnings #StocksThe PEAD projected a neutral outlook for NASDAQ:CSX after a negative under reaction following its earnings release placing the stock in drift D with an expected accuracy of 75%.

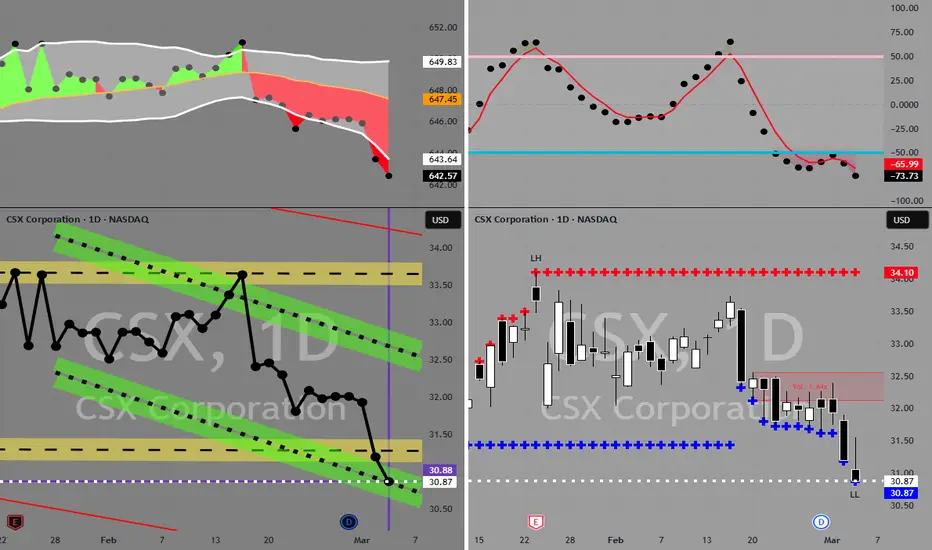
CSX is BullishPrice was in a downtrend, however a matured bullish divergence on RSI seems to be playing out on daily time frame. Previous lower high is broken successfully, and if the bulls maintain control over price action, we can expect a bullish rally from here. Targets are mentioned on the chart.

CSX potential Buy setupReasons for bullish bias:
- Price respecting weekly trendline
- Price is at strong horizontal support
- Simple DOW theory
- Safe Entry at LH breakout for bull trend confirmation
- Bullish divergence
Here are the recommended trading levels:
Entry Level(Buy Stop): 34.04
Stop Loss Level: 31.45
Take Pr


possible buying opportunity appoarchingHey everyone, this stock recently caught my attention, so I decided to take a closer look and see if there's an opportunity here.
Below, I used ChatGPT to give me a quick analysis of the stock and to examine the reasons behind its decline over the past year.
My plan is to buy in (DCA - Options) as

Possible wave tradeI follow a long term trend analysis based on a tutorial published by @TradeWithParas, so naturally I suggest you refer to his idea for a longer term swing. But inside this analysis there should be some wave to wave trades.
Currently I see consolidation between the 50 and 200 moving avgs, a break of

See all ideas
Summarizing what the indicators are suggesting.
Oscillators
Neutral
SellBuy
Strong sellStrong buy
Strong sellSellNeutralBuyStrong buy
Oscillators
Neutral
SellBuy
Strong sellStrong buy
Strong sellSellNeutralBuyStrong buy
Summary
Neutral
SellBuy
Strong sellStrong buy
Strong sellSellNeutralBuyStrong buy
Summary
Neutral
SellBuy
Strong sellStrong buy
Strong sellSellNeutralBuyStrong buy
Summary
Neutral
SellBuy
Strong sellStrong buy
Strong sellSellNeutralBuyStrong buy
Moving Averages
Neutral
SellBuy
Strong sellStrong buy
Strong sellSellNeutralBuyStrong buy
Moving Averages
Neutral
SellBuy
Strong sellStrong buy
Strong sellSellNeutralBuyStrong buy
Displays a symbol's price movements over previous years to identify recurring trends.
CSX4600597
CSX Corporation 4.65% 01-MAR-2068Yield to maturity
5.72%
Maturity date
Mar 1, 2068
CSX4415158
CSX Corporation 4.25% 01-NOV-2066Yield to maturity
5.60%
Maturity date
Nov 1, 2066
CSX4234690
CSX Corporation 3.95% 01-MAY-2050Yield to maturity
5.60%
Maturity date
May 1, 2050
CSX4880195
CSX Corporation 3.35% 15-SEP-2049Yield to maturity
5.59%
Maturity date
Sep 15, 2049
US126408HK2
CSX Corporation 4.3% 01-MAR-2048Yield to maturity
5.57%
Maturity date
Mar 1, 2048
CSX4971773
CSX Corporation 3.8% 15-APR-2050Yield to maturity
5.57%
Maturity date
Apr 15, 2050
CSX5894351
CSX Corporation 4.9% 15-MAR-2055Yield to maturity
5.55%
Maturity date
Mar 15, 2055
CSX4766116
CSX Corporation 4.75% 15-NOV-2048Yield to maturity
5.54%
Maturity date
Nov 15, 2048
CSX4145235
CSX Corporation 4.5% 01-AUG-2054Yield to maturity
5.52%
Maturity date
Aug 1, 2054
CSX5450130
CSX Corporation 4.5% 15-NOV-2052Yield to maturity
5.50%
Maturity date
Nov 15, 2052
US126408HT3
CSX Corporation 2.5% 15-MAY-2051Yield to maturity
5.49%
Maturity date
May 15, 2051
See all CSXC34 bonds