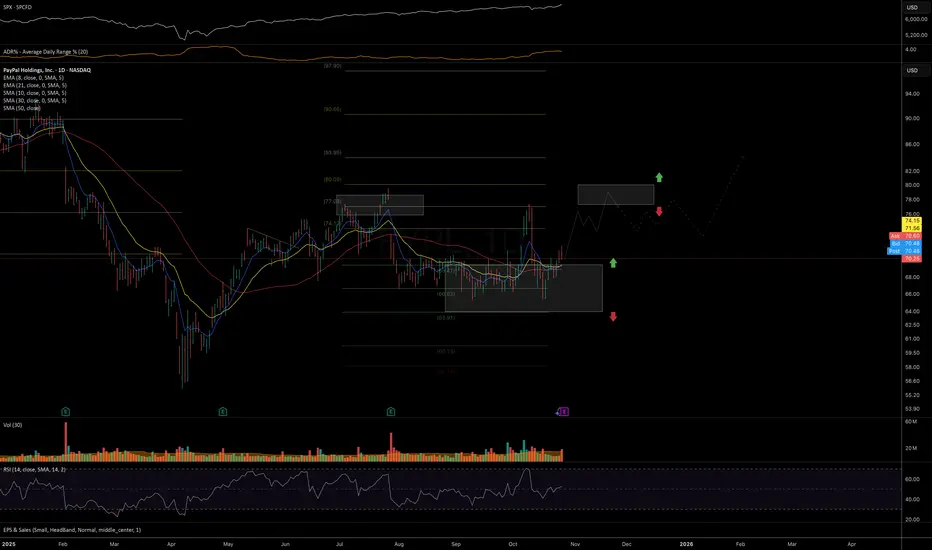
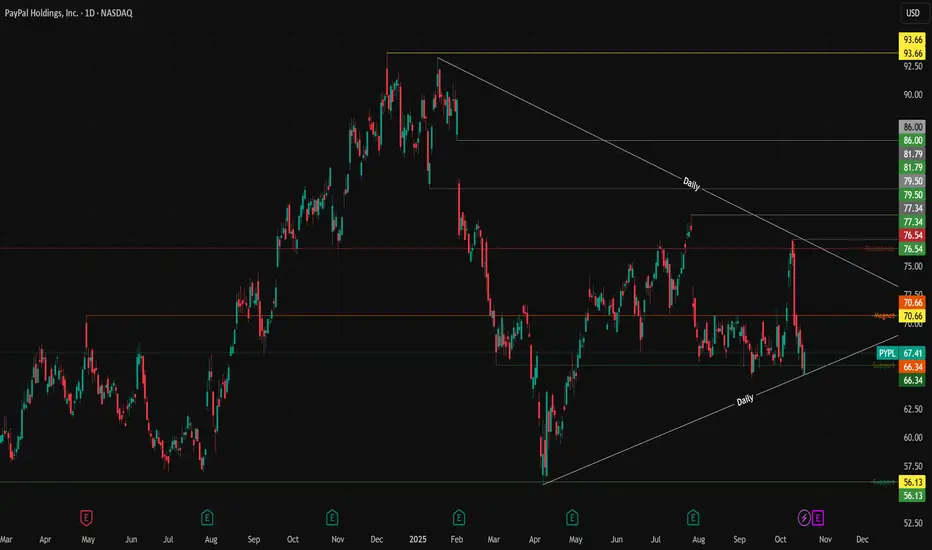
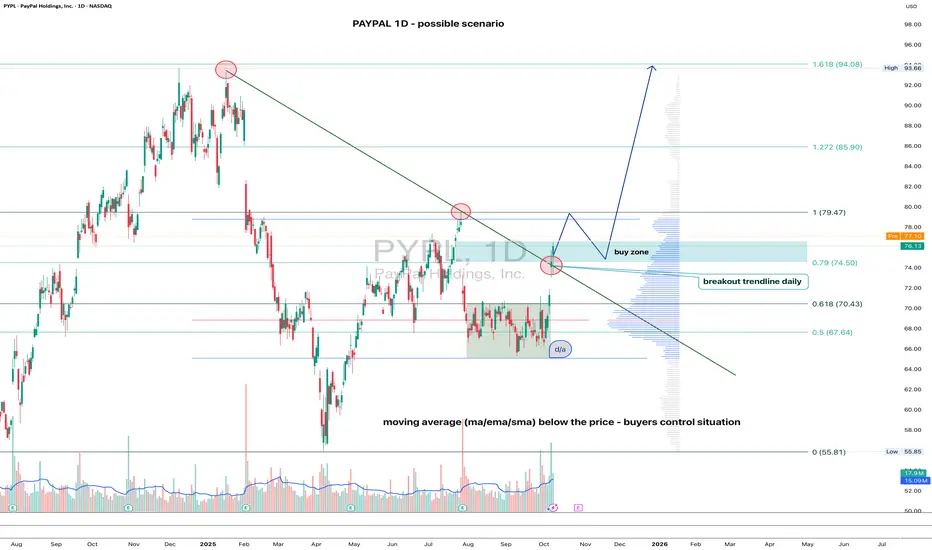
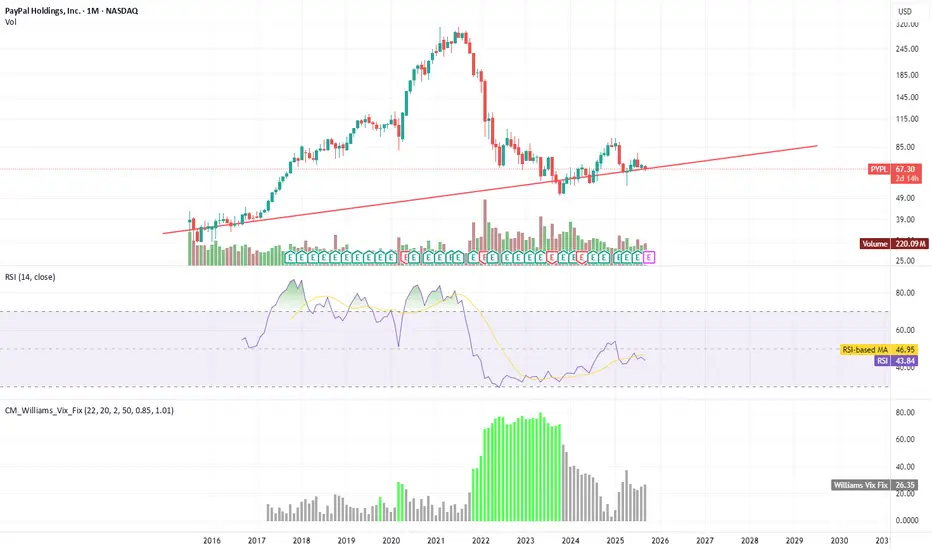
PYPL cleared gap at $77, creater gap at $71Pypl has closed the gap at $77 but now created a gap at $71. Expect more volatility and a high probability of gap fill.
Trade ideas

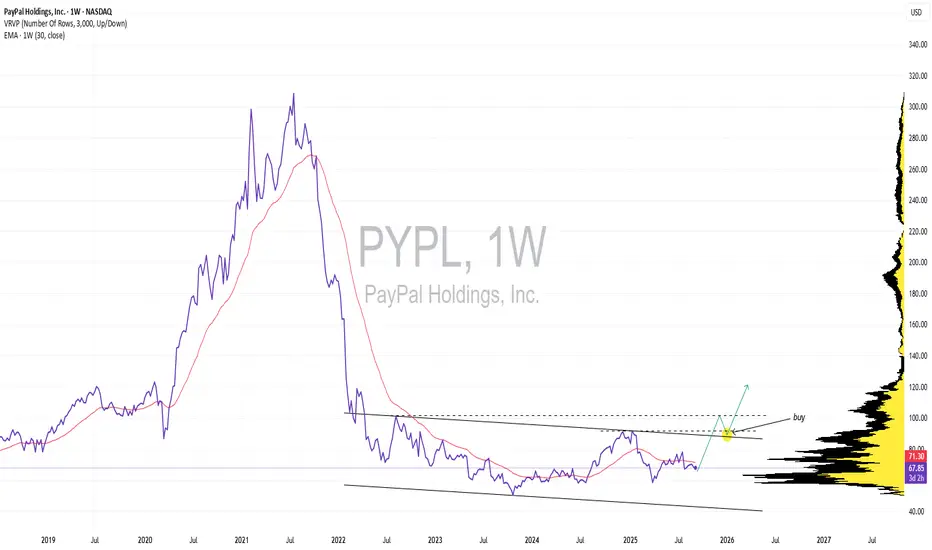
PYPL potential start of a new uptrendPrice may have completed its correction from the July highs and started the first wave of a new uptrend.
As long as the price continues to trade above 65, I expect upside momentum to persist toward the 80 resistance level, likely followed by a period of consolidation and base-building before a more sustainable breakout attempt in the coming months.
Chart:
Previously:
On mid-term resistance (Jul 24):
Chart:
www.tradingview.com
and (Jul 30):
Chart:
www.tradingview.com
On potential bottom (Sep 18):
Chart:
www.tradingview.com
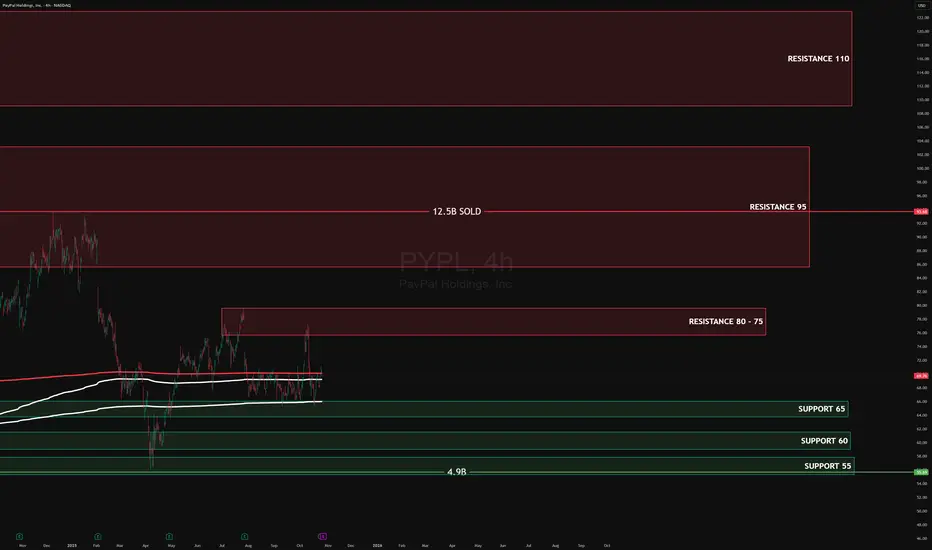
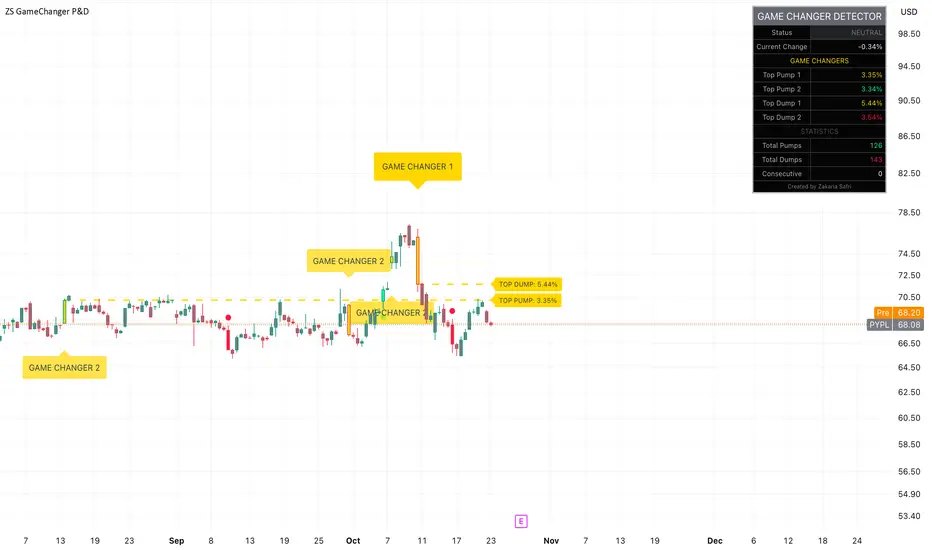
PYPL EARNINGS OCT - 2025PYPL basing above 65 support; 75–80 sell zone capped bounce;
heavy distribution near 95 (12.5B).
Target ↑72.5–75 | ↓65→60.
#PYPL
PYPL Weekly Outlook (Oct 21–25): Buyers Defend the BaseCan Bulls Reclaim $70? 🚀
📆 Daily Chart — Macro Structure and Bias
Market Structure:
PayPal (PYPL) continues to trade within a broad descending channel but is showing early signs of structural stabilization. After several failed breakdowns, bulls defended the $64.50–$65.00 demand zone — a key level where prior liquidity sweeps triggered reversals. The most recent BOS (Break of Structure) around $69.00 indicates that smart money might be accumulating again within this base range.
We can see multiple CHoCH and BOS interactions suggesting buyers are quietly absorbing supply below $70, preparing for a potential structural shift back toward the mid-channel zone.
Supply & Demand / Order Blocks:
* Major Demand Zone: $64.00–$65.00 (deep OB and liquidity defense).
* Intermediate Supply Zone: $70.50–$71.00 (mid-channel resistance).
* Major Supply Zone: $79.00–$80.00 (top of the previous swing high cluster).
If bulls can maintain daily closes above $68.50, this could evolve into a mid-term reversal attempt toward $75+.
Indicator Confluence:
* 9 EMA vs 21 EMA: Bearish on macro view but flattening — momentum loss from sellers.
* MACD: Histogram is improving from deep negative; a cross above zero could confirm a macro shift.
* Stoch RSI: Rising sharply from oversold (10 → 45), signaling renewed buying strength.
* Volume: Buyer volume expanding near the base, consistent with accumulation phase behavior.
The daily structure remains in a potential bottoming phase; sustained closes above $69.50 will confirm a bullish shift.
⏱️ 1-Hour Chart — Short-Term Trend and Swing Bias
Market Structure:
The 1-hour timeframe paints a much clearer bullish microstructure after a decisive CHoCH from the descending wedge. Price reclaimed $67.00, then printed a BOS toward $69.20, completing the first leg of reversal structure.
We’re now consolidating just beneath $69.80–$70.00, which lines up with the mid-term supply zone and a key call wall on the GEX chart. The structure remains bullish as long as $68.00 holds as a higher low.
Supply & Demand / OB Zones:
* Demand Zone: $67.00–$68.00 (recent breakout OB).
* Supply Zone: $69.80–$70.50 (local resistance and liquidity pocket).
Indicator Confluence:
* 9 EMA > 21 EMA — clear bullish alignment, steep slope.
* MACD: Strong expansion with rising histogram, supporting upward bias.
* Stoch RSI: Hovering at 80+ — slightly overheated, but not reversing yet.
* Volume: Increasing on breakouts, declining during pullbacks — healthy pattern.
Trade Scenarios:
* Bullish Setup: Buy dips near $68.20–$68.50 → Target $70.00 / $71.00 → Stop $67.20.
* Bearish Setup: If rejection from $70.50 with divergence → Short to $68.00 / $67.00 → Stop $71.00.
If PYPL breaks and closes above $70, it will invalidate short setups and start targeting $72.50–$73.50 next.
🕒 15-Minute Chart — Intraday Momentum and Scalping Zones
Market Structure:
The 15-minute chart confirms strong short-term bullish control with stacked BOS and higher-low formations. Price is trending neatly along the rising intraday trendline, using the 9 EMA as dynamic support. Each micro pullback toward $68.80–$69.00 has been aggressively defended.
Supply & Demand / OB Levels:
* Demand Zone: $68.60–$68.80 (scalp OB and trendline support).
* Supply Zone: $69.80–$70.20 (intraday resistance + liquidity sweep potential).
Indicator Confluence:
* 9 EMA vs 21 EMA: Strong bullish slope; 9 EMA acting as perfect bounce line.
* MACD: Histogram slightly flattening after expansion — possible short-term cool-off.
* Stoch RSI: Overbought (>80), indicating potential short-term pause before continuation.
Scalp Plan:
* Bullish Bias: Enter near $68.80 pullback → Target $69.80 / $70.20 → Stop below $68.20.
* Bearish Bias: If $70 rejects twice with fading MACD momentum → Short scalp to $68.80 → Stop $70.40.
Intraday bias stays bullish unless price closes below $68.50 — that would mark short-term exhaustion.
📊 GEX (Gamma Exposure) & Options Sentiment Overview
PYPL’s options structure shows a neutral-to-bullish gamma setup with dealers likely positioned to stabilize price between $66–$70. The highest positive NET GEX sits around $70, effectively pinning current price in a tight gamma range.
Key GEX Levels:
* Highest Positive Gamma: $70.00 (dealer magnet).
* Major Call Walls: $72.00 and $74.00 — resistance zones if momentum expands.
* Put Support: $65.00 and $64.00 — strong floor if pullback occurs.
* IVR: 58.6 — elevated but not extreme, indicating active trader participation.
* Call Flow: 35.2% (muted but rising), suggesting cautious optimism.
If price sustains above $70.00, dealer hedging could flip to positive gamma expansion, pressing for a gradual melt-up toward $73–$74. A rejection below $68.00, however, might trigger delta-neutral unwind and short-term reversion to $65.
🎯 Closing Outlook
PYPL enters the week with a constructive recovery tone. The broader daily structure suggests a possible bottoming phase, while the intraday trend shows active buyer defense near $68. The GEX map supports a magnetized range between $68–$70, with potential gamma breakout if momentum persists midweek.
I’m watching for a decisive daily close above $70 — if bulls manage that, $72.50–$74 could be in play before the week ends. Below $68, expect a controlled retest toward $65 before another attempt higher.
Disclaimer:
This analysis is for educational purposes only and not financial advice. Always do your own research and manage your risk.
PYPLTwo gaps filled on Daily from a few months ago.
Divergence on Monthly chart and found potential support. Long target +160

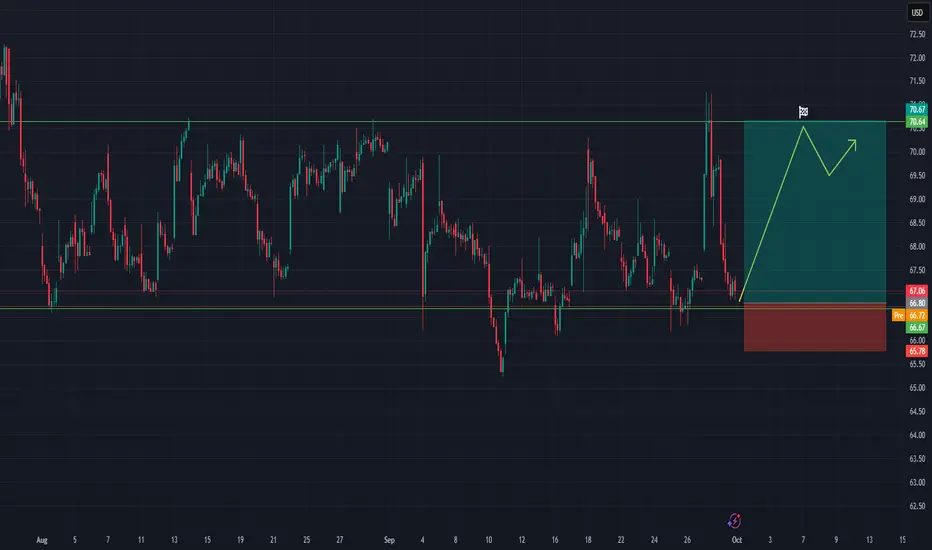
Trade Plan 10/18 Post: $PYPL #PYPLTrade Plan 10/18 Post: NASDAQ:PYPL #PYPL
📊 Setup Overview:
• NASDAQ:PYPL is forming a large symmetrical triangle, tightening range between $65.70 support and $70.66 resistance (magnet zone).
• The stock is coiling near the apex, setting up for a potential breakout or breakdown in the coming sessions.
• Momentum remains neutral but leaning bullish while price holds above the rising trendline.
🐂 Bullish Scenario:
• Hold above $65.70 and reclaim $70.66 for upside continuation.
• Breakout above $70.66 targets → $75 → $82 → $93.66.
• Watch volume — confirmation requires expansion above average daily volume.
🐻 Bearish Scenario:
• Lose $65.70 = breakdown from structure.
• Downside targets → $61 → $56.13 → $50.58.
• Sustained close below $56 would confirm a larger bearish trend resumption.
⚖️ Key Levels:
• Resistance → $70.66 / $75 / $82 / $93.66
• Support → $65.71 / $61 / $56.13 / $50.58
🕓 What I’m Watching:
• Confluence between trendline support and horizontal resistance near $68–70 — volatility likely.
• RSI and MACD compression signaling a breakout setup.
• Ideal trade: Wait for confirmation candle above or below the triangle with volume spike.
💬 If you found this helpful, drop a like and comment if you’re watching $PYPL.
Follow
@optibiz_trades
for daily setups, breakout alerts, and market analysis!
Paypal Looking Bullish!! Lets Go!Paypal is looking Really bullish.
Setup is Based on AMD, Accumulation, Manipulation and Distribution phase.
It has been accumulating at this price range for a while and enough Manipulation has takenplace. Now it is TIME for Distribution and hunt SL of Sellers, that is BSL.
It is not a Financial advice. It is a speculative idea that i am publishing for educational purposes.
Do your own Research.
Leave a thumbs up if you like this idea.

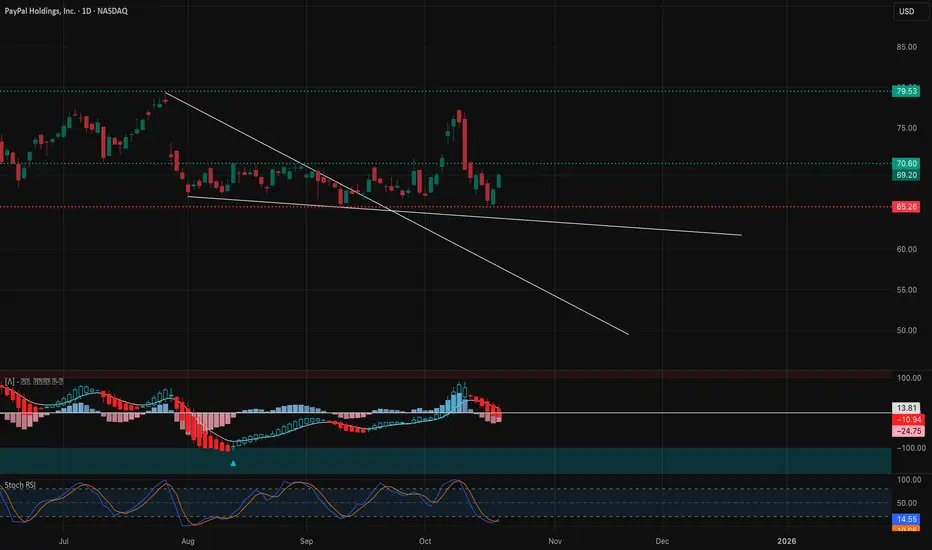
PYPL Ascending Triangle FormingBreakout above 77 it can go above 80 easy. It's consolidating after a long drop the last few years. Still great fundamentals.
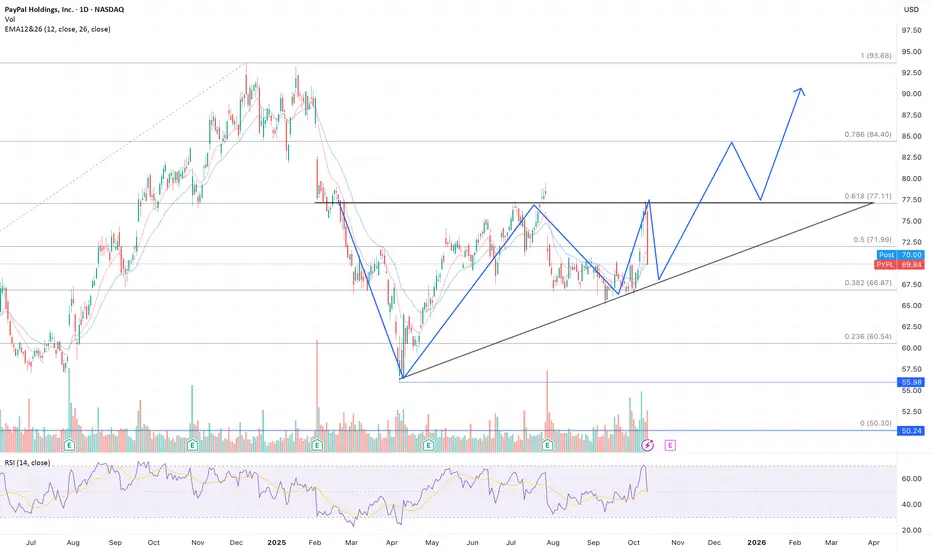
PAYPAL(PYPL) 1D - gaining traction On the daily chart, the price has confidently broken through the descending trendline — the first strong sign of a bullish shift.
All key moving averages (MA, EMA, SMA) sit below the price, showing that buyers are clearly in control.
Buy zone: 74.50.
A retest in this area (74.5–76) looks likely before another push higher.
First resistance: 79.47.
This level might trigger a short-term pullback, but a breakout above it opens the way toward targets at 85.90 and 94.00.
In short - the structure looks healthy, the breakout is done, and PayPal may be just warming up for a bigger move. Stay sharp - dips could be opportunities, not danger.
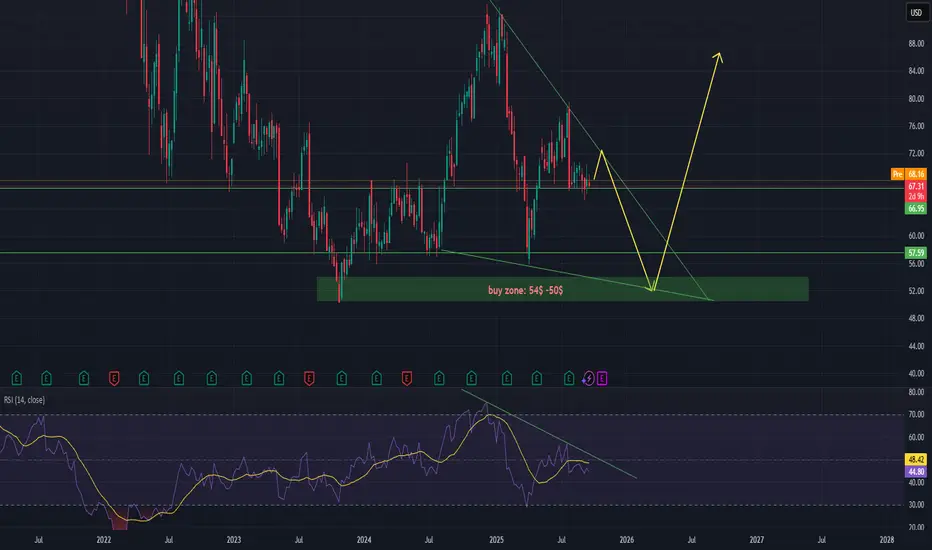
PYPL - one last drop before a bull run startshi traders,
Currently, PayPal is trading around the $68 level, but the chart suggests that the stock may not yet be ready to resume a sustained bullish trend. Based on the technical setup, we anticipate a possible drop in the coming months before a new bull run begins.
The key buy zone to watch is in the range of $54–$50. This area aligns with a strong support zone and potential trendline confluence, making it an attractive entry level for long-term investors.
Our expectation is that price action will retest this zone before reversing upward and starting the next significant bullish leg. Traders should remain patient and look for confirmation signals once PayPal approaches this support area.
PYPL watch $64.77-65.12: Dual Golden zone would be ideal BOTTOMPYPL has been drifting lower since rejecting at $70.20
Now approaching a Double Golden fib zone $64.72-65.12
Bulls need to hold this major support or face $60.00 next.

$100PayPal is about to explode looking to move towards the 90's quickly as long as the overall market stavs hot big growth earnings coming up everyone is loading something is brewing $75 $80 some levels to watch for pullbacks. You can see where the big buying and selling is on the chart.
Long Setup on PayPal (PYPL) – 1H Charthi traders
PayPal is currently trading around $66.80 – $67.00 after retesting a key support level that has held multiple times in recent sessions. The price action shows consolidation near support, with potential for a bullish reversal.
Entry Zone:
Around $66.80 – $67.00 (current support area).
Stop Loss (SL):
Below $65.78 (recent swing low and invalidation zone).
Take Profit (TP):
Targeting $70.60 – $70.70 (strong resistance and recent highs).
Risk/Reward Ratio (RRR):
Approximately 1:3, favorable setup for a long position.
Trade Thesis:
The chart suggests a bounce from support with momentum building for an upside move.
If the price holds above the $66.80 support zone, there is room for a bullish push toward the $70.60 resistance.
Confirmation can come from bullish candles forming around the current level.
Plan:
Go long near $67.00.
Place stop below $65.78.
Aim for $70.60+ as the first profit target.
Partial profits may be secured on the way up, with stop moved to breakeven for risk management.
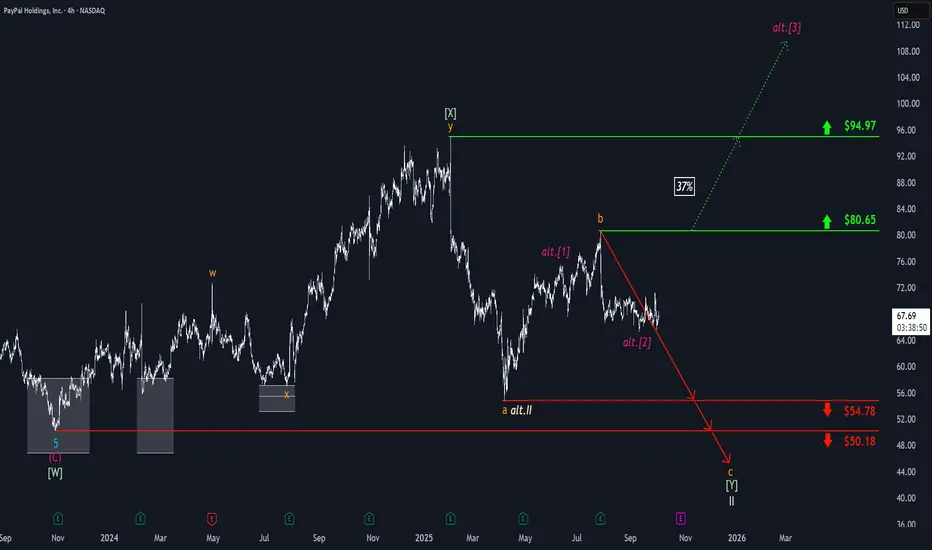
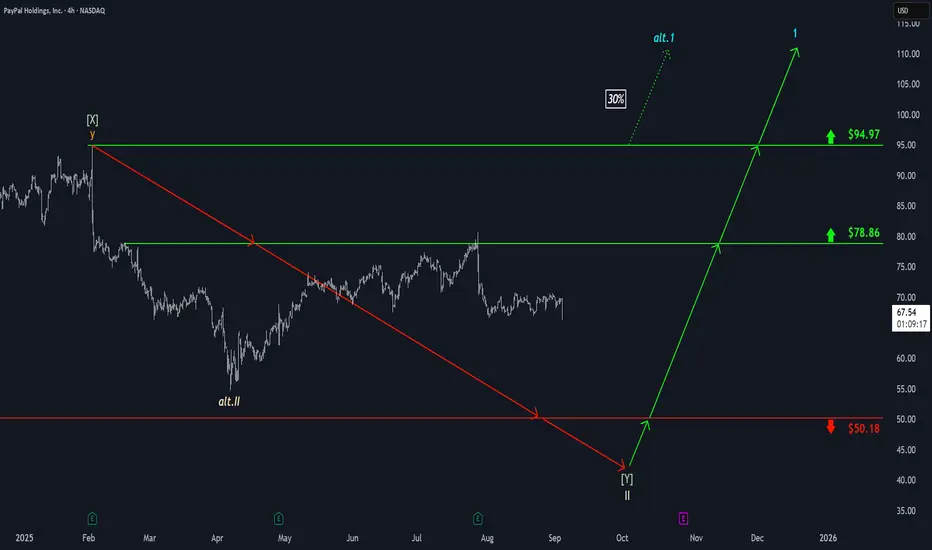
PayPal: Trading Sideways Amid VolatilityPayPal has recently experienced notable volatility but has continued to trade sideways within a certain range. Our primary expectation is that further downward momentum will dominate, potentially driving price below both support levels at $54.78 and $50.18 to complete the correction of beige wave II. However, there is also a 37% chance that PYPL has already finished beige wave alt.II at $54.78. In that scenario, the stock would already be building a sustained magenta upward impulse and could break out above the resistance levels at $80.65 and $94.97 during wave alt. .
PYPL - Hold this line and we're goodConsidering the basic technicals and seeing the post covid rally just as exuberance it would now be a good time to buy. Invalidation under the memeline.

$PYPL PainPal Bros have attained Nirvana! - Waiting for massive gains, they have grown old and achieved Nirvana!
- NASDAQ:PYPL is getting better in innovation but the company isn't innovative faster. It is bloated with legacy tech and in many places their teams are working in silos with duplicated initiatives and effort.
- Alex is great CEO but stock buyback alone won't help. Law of large numbers and massive competition by various fintech will always be a drag for $PYPL.
- Market likes growth (organic expansion of multiple) which is a like drug for the market participants or massive EPS growth ( inorganic )
Where does NASDAQ:PYPL stand?
year | 2025 | 2026 | 2027 | 2028
EPS | 5.26 | 5.82 | 6.61 | 7.07
eps% | 14.59% |10.81% | 13.45% | 6.96%
For a mid teen eps%, fair forward p/e would be 15
Fair stock value:
year | 2025 | 2026 | 2027 | 2028
price | 78.9 | 87.3 | 99.15 | 106.05

Trade Idea: $PYPL (PayPal Holdings)📝 Trade Idea: NASDAQ:PYPL (PayPal Holdings) —
Bias: Long-term bullish (wealth accumulation)
Entry Zone (Wholesale Area): $55 – $100
Stop Loss: Below $50 (structure break)
Target 1: $150 (mid-zone retest)
Target 2: $300 (Retail Supply Zone)
Risk/Reward: ~1:4+ if entering near $60–70
Rationale:
Price is consolidating inside a fresh Wholesale Demand Zone.
RSI reset, building a long base after heavy distribution.
Macro structure favors accumulation → long-term upside toward $300 Retail Zone.
Strong asymmetric play: limited downside risk, outsized reward if recovery unfolds.

First time looking at this chartLooks like consolidation is nearing completion. A move above the bottoming channel, then successful retest, would be a good buy signal.
New Setup : $PYPLFake action to test the ema 200 and then all the emas back in a bearish scenario, with the price testing the resistance of the ema 50.
Ready to catch an action lower
PayPal: Stuck in Consolidation—Breakout or Breakdown Ahead?We expect PayPal to eventually break out of its current consolidation to the downside to complete the larger correction of beige wave II below the $50.18 support level. Alternatively, it’s possible that PYPL already finished wave alt.II back in April, which could set the stage for an early upside breakout—first above the $78.86 resistance and then even beyond the higher $94.97 level (probability: 30%).
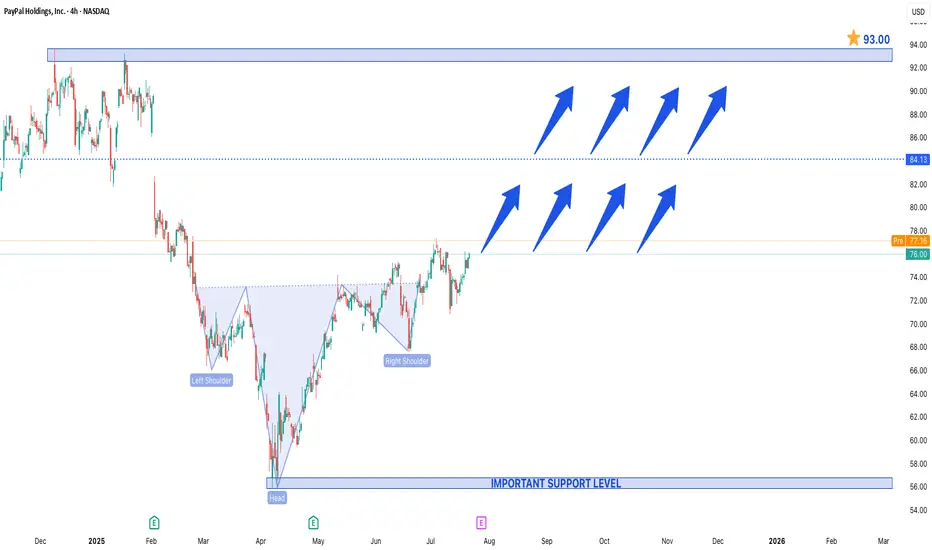
Head & Shoulders Pattern Spotted in PayPal Holdings IncHead & Shoulders Pattern Spotted in PayPal Holdings Inc.
A Head & Shoulders (H&S) pattern has been identified in PayPal Holdings Inc. (PYPL), but unlike the traditional bearish reversal setup, this could be an inverse Head & Shoulders, signaling a potential bullish turnaround.
Key Observations:
1. Left Shoulder – A decline followed by a rebound.
2. Head – A deeper low, then a recovery.
3. Right Shoulder – A higher low, suggesting weakening selling pressure.
4. Neckline Break – A decisive close above the resistance (neckline) confirms the bullish reversal.
Price Projections:
- Support at $55 – This level has held strong, acting as a critical demand zone. A bounce from here could fuel the next rally.
- Upside Target at $93 – A successful breakout above the neckline could propel PYPL toward $93, representing a ~40% upside from current levels.
Why This Matters for Traders:
- Bullish Momentum – The pattern suggests that sellers are exhausted, and buyers are stepping in.
- Volume Confirmation – Increasing volume on the breakout would strengthen the bullish case.
- Market Sentiment Shift – If PayPal sustains above key resistance, it could attract institutional interest.
Trading Strategy:
- Stop Loss – Below $55 for risk management.
- Target – $93, with interim resistance near $75 and $85.
Final Thoughts:
While technical patterns are not foolproof, the inverse H&S in PYPL suggests a potential trend reversal. If the breakout holds, $93 could be the next major target, making PayPal an interesting watch for swing traders and investors.