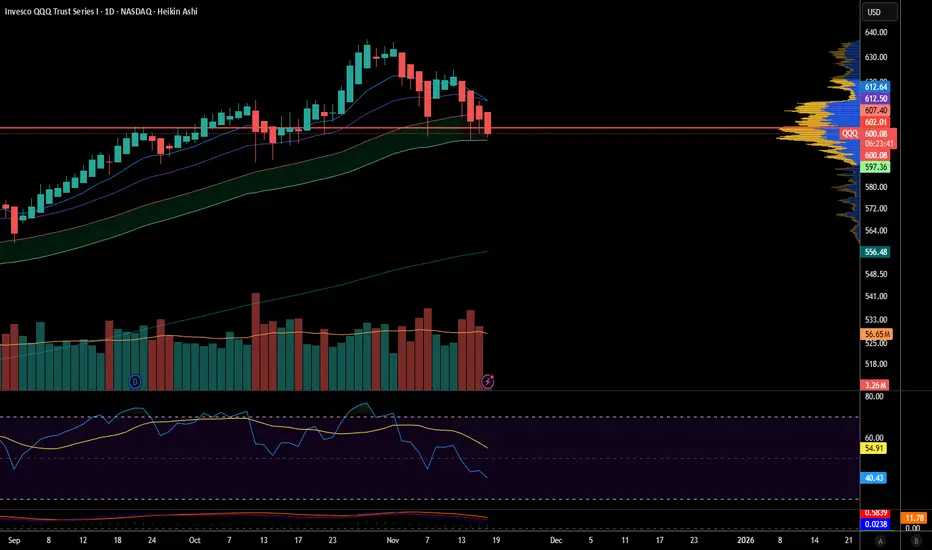
QQQ to 618, then 628If all goes well QQQ we should see this hold 598. This will confirm a bull-market is still in play, thus revisiting previous highs at 628-630. Why this price target? Volume Void or inefficiencies are present at 618 and lastly 628. My assumption is price tends to revisit these areas of inefficiencies, thus supporting the bullish-bias.
Trade ideas

QQQ overbought positionThis chart looks at the exponential moving averages on a daily timeframe and puts into perspective the overbought or oversold position of the price action.
Why I'm NOT Buying the Dip on QQQ (Yet)Many traders are trying to catch a falling knife on the Nasdaq right now. Here is why my system says "Wait."
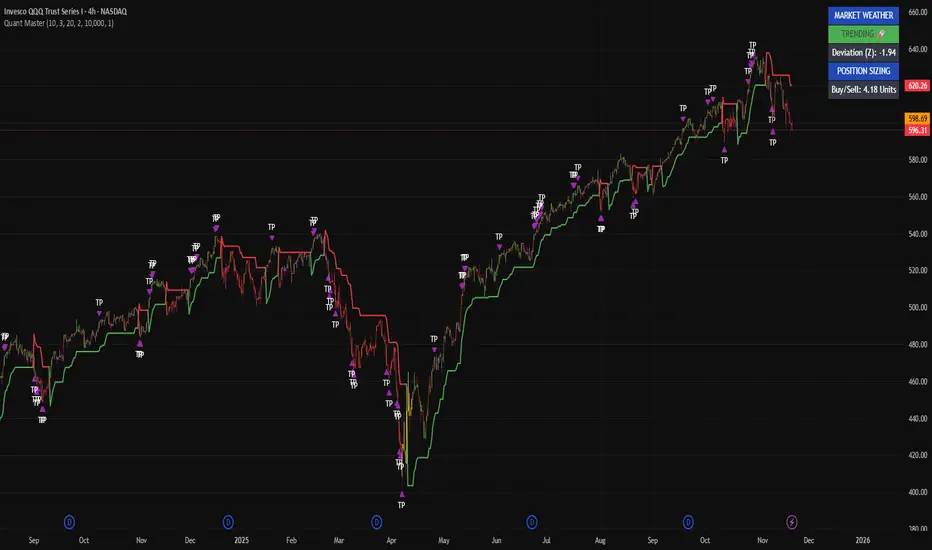
Looking at the Quant Master system on the 4H timeframe:
Trend is King: The candles are Red. This means Price is below the Volatility Stop and below the institutional VWAP anchor. There is no "Green Light" to buy yet.
Beware the "Black" Zones: If the candles turn Black, it means volatility has spiked or momentum has died (Chop). I do not trade in Black zones. I am waiting for clear Blue structure.
The Exit Was Clear: If you look at the top of the chart, the system printed multiple Purple Triangles. This signaled that the trend was exhausted relative to its statistical baseline. If you didn't take profit there, the market took it for you.
The Plan:
I am sitting on my hands until price closes ABOVE the VWAP (Orange Line) and the Stop Loss line turns Blue.
Trade what you see, not what you think.

$QQQ Strong momentum down- Watch your assetsTake profit, enter Sell mode! All risk factors in my indicator I made are showing large amounts of risk in holding long positions. Sell!
Market structure has broken down

QQQ – Mapping the Trend With My Quant Master System (4H)Precision trend tracking. Zero noise. Pure structure.
I’m tracking QQQ on the 4-hour using my Quant Master Trend System, a custom-built model that blends volatility stops, structural momentum, deviation analysis, and adaptive TP logic.
The goal isn’t to predict — it’s to read the map, stay aligned with the dominant pressure, and avoid the traps that most retail traders fall into.
The Quant Master ribbon has flipped red, confirming we’re in a short-term downtrend.
QQQ has lost its green momentum base, and that base is now acting as resistance.
Whenever my ribbon flips red on the 4H while the market weather panel stays TRENDING, it means:
Trend strength is still alive
Pullbacks are not dips — they’re continuation setups
Bulls are not in control (yet)
That’s exactly the current environment.
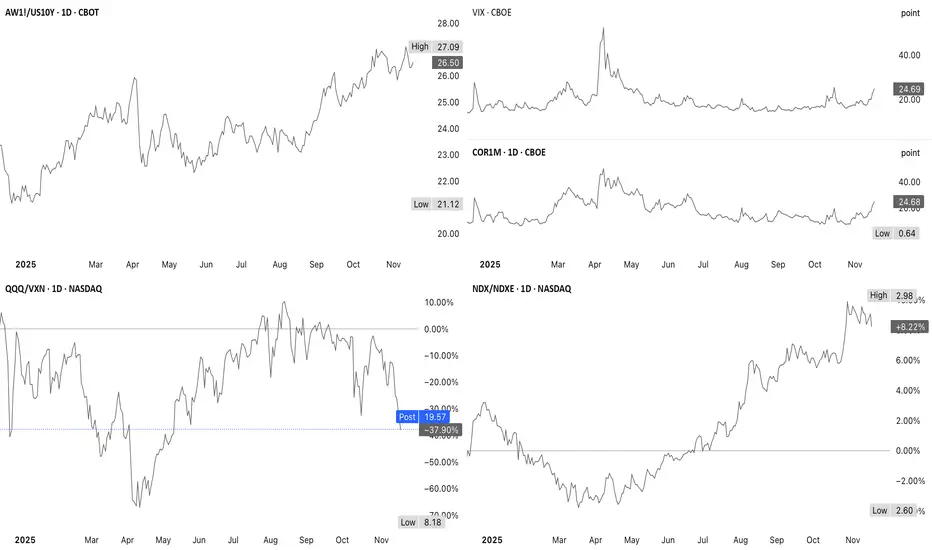
QQQ Macro + Volatility Read1. AW1!/US10Y shows commodities trending higher
A rising broad commodity index means inflationary pressure is accelerating & this tends to push yields up, which pressures tech multiples
Higher commodity prices is a drag on QQQ
2. VIX & COR1M shows volatility is high
COR1M ripping harder than VIX indicates front-loaded hedging & is event-driven
After NVDA earnings, volatility normally compresses sharply unless the event is disastrous
This is supportive for a post-event equity bounce
3. QQQ/VXN is still extremely washed-out
QQQ underperforming implied volatility by a wide margin is historically associated with short-term exhaustion lows
This extreme is more consistent with fear/hedging overshoot
This favors a bounce unless VXN continues ripping
4. NDX/NDXE shows breadth remains strong
Even with commodities rising (inflation pressure), equal-weight Nasdaq is firmly outperforming
When inflation becomes a serious tech headwind, breadth usually collapses, not expands
Breadth made higher highs, is still in an uptrend & turned bearish
This is event-driven fear layered on top of a still-healthy breadth structure
NVDA event hedging elevates COR1M/VIX, QQQ dips into support ($598-$602)
Volatility crush after earnings if NVDA isn’t disastrous results in a bounce toward $610-$620; however, rising commodities means the upside is less explosive & may fade sooner
A rebound toward $610-$620 remains the more probable post-NVDA path
NASDAQ:QQQ AMEX:SPY NASDAQ:NVDA
Daily QQQ (US100-NQ) Outlook - Prediction (NOV 18)Daily QQQ (US100-NQ) Outlook - Prediction (18 NOV)
📊 Market Sentiment
Market sentiment appears bearish right now, in my opinion. The FED may pause rate cuts in December, which has contributed to recent selling pressure and possible hedging flows. However, with the U.S. government reopening last week, we will start receiving updated economic data again. If employment data weakens and CPI comes in low or stable, it could trigger renewed bullish momentum.
NVDA will report earnings this Wednesday after market close. I will be watching closely in my view, if NVDA were to miss expectations, both QQQ and SPY could see a strong retracement. However, I think this is unlikely. I expect solid earnings growth and believe the ongoing AI cycle continues to support upside.
Additionally, U.S. Treasury Secretary Scott Bessent stated that the Trump administration aims to finalize its trade agreement with China by Thanksgiving (November 27). This could bring further bullish sentiment into the market.
📈 Technical Analysis
The market showed a strong bounce on Friday after tapping the 599 level. RSI has also reset, meaning price is no longer overbought. We remain inside the weekly range, and price has now touched the 0.75 max discount zone for the second time.
📌 Game Plan – Prediction
There are 2 different expectations outlined on the chart.
S cenario 1 (Green line): Price to hit 585.5$ then close 1H above the level, bringing it back to us for a bounce.
Scenario 2 (Red line): Price retraces till 579 and gets a bounce from there. I believe 579 is the strongest zone for buyers. I will be buying calls once we hit there.
💬 For detailed insights and broader market context, please check my Substack link in profile.
⚠️ For educational purposes only. This is not financial advice.
Stock Market Forecast | TSLA NVDA AAPL AMZN META MSFTStock Market Forecast | SP:SPX NASDAQ:NDX CME_MINI:ES1! CME_MINI:NQ1!
Mag 7 | TSLA NVDA AAPL AMZN META MSFT GOOGL

Maybe levels for qqqLevels of support and resistant on QQQ. Levels have been holding very nice. Just trying out new time frames

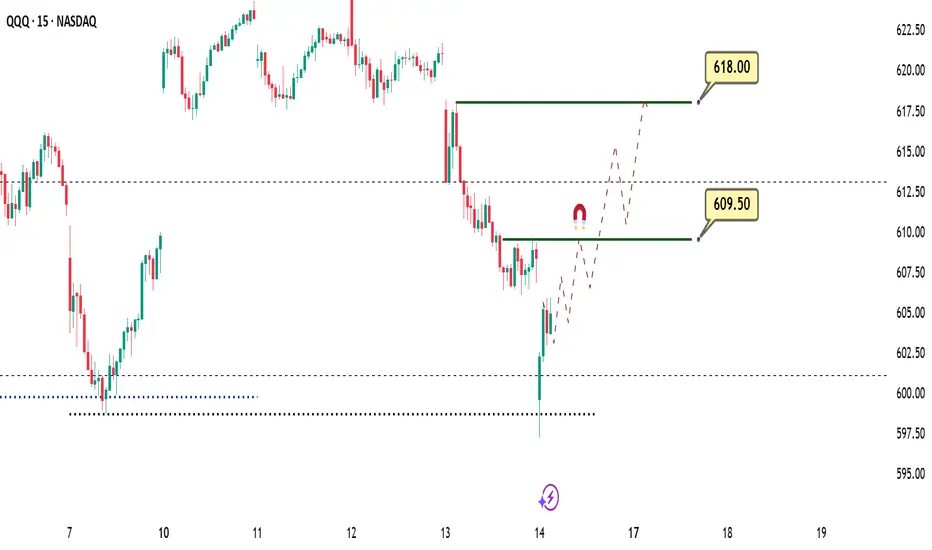
Daily QQQ (US100-NQ) Outlook - Prediction (14 NOV)Daily QQQ (US100-NQ) Outlook - Prediction (14 NOV)
📊 Market Sentiment
Market sentiment appears neutral, in my opinion. The U.S. government is expected to reopen soon; however, officials have decided not to release previous economic data. This creates uncertainty for traders without key data, it becomes difficult to anticipate the FED’s next policy decisions.
📈 Technical Analysis
QQQ tapped the weekly swing low at 687 and was rejected from that level. SPY retested the 637 zone, which is the range low for me, and reacted with a strong bounce. At the moment, price is showing clear upward momentum, suggesting that a stronger move may develop into the afternoon session. NVDA and AAPL are currently leading the market higher.
📌 Game Plan
I bought calls around 601, and I expect to see 609.5 first, and if we get a strong continuation, possibly the 618 level.
At 609.5, I will close half of my position, trail my stop-loss to breakeven, and target 618 for the remainder.
💬For detailed insights and broader market context, please check my Substack link in profile.
⚠️ For educational purposes only. This is not financial advice.
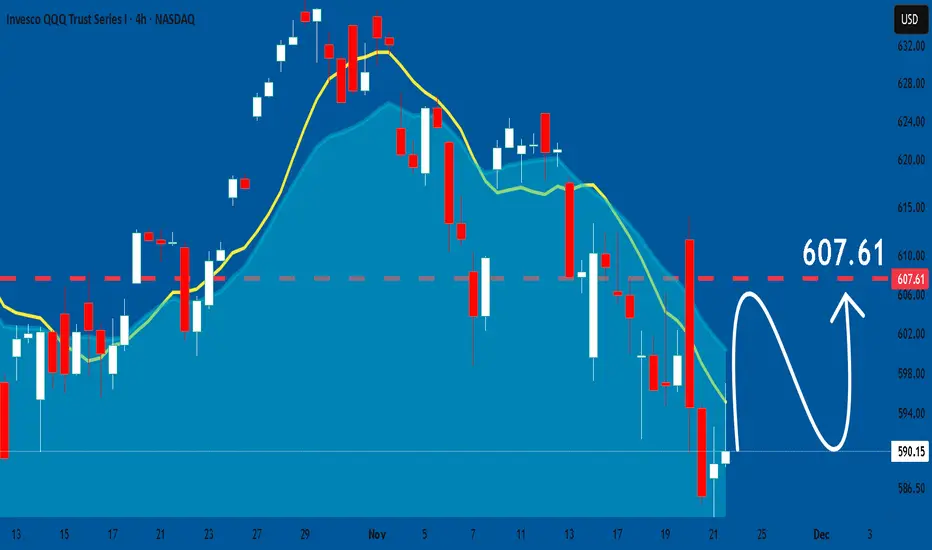
Bottom Band BounceNASDAQ:QQQ finally hit the bottom band and the cloud today. The last time this happened was on 9/2 and it was the exact bottom.


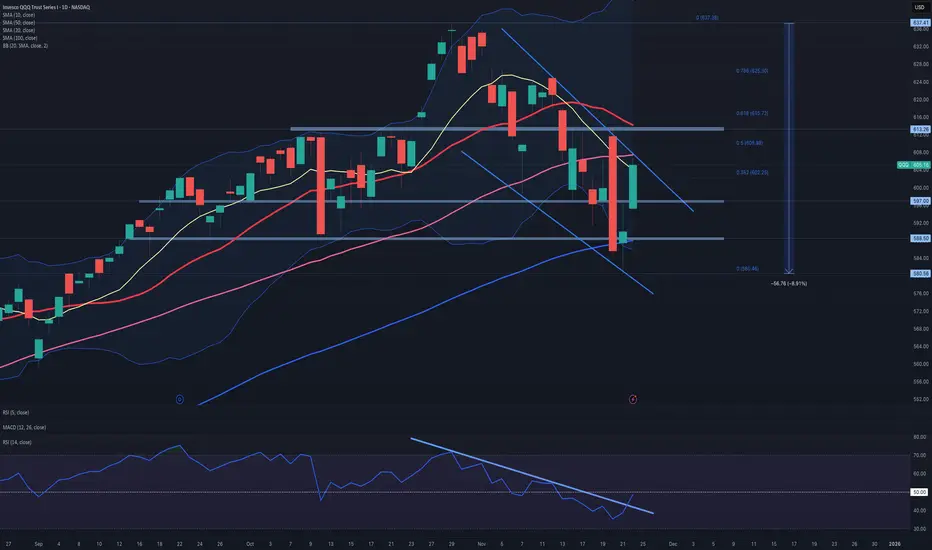
QQQ long-term TAQQQ has broken mid-term uptrend, and it's currently in distribution phase, we have to give it some time to find the bottom, weekly uptrend is still in place.
P.S.
There are many other indicators that are being used for this TA, the above snapshot is only an example.

Reserve Currency Dominance in Global Trade1. What Is a Reserve Currency?
A reserve currency is a foreign currency held in significant quantities by central banks and financial institutions. It is used for:
International trade invoicing
Cross-border payments
Foreign exchange interventions
Investment in global assets
Storing national wealth
To serve as a reserve currency, it must be stable, widely accepted, highly liquid, and backed by strong institutions.
2. Why Some Currencies Become Dominant
A dominant reserve currency does not emerge overnight. It is built through decades of economic, political, and financial advantages. Historically, currencies like the British pound during the 19th century and the U.S. dollar after World War II gained dominance because:
A. Economic Size and Influence
The issuing country must be a major economic power.
The U.S. economy is one of the world’s largest.
Its deep financial markets attract global investors.
When an economy is big, its currency naturally becomes widely used because global businesses want access to that market.
B. Trust and Stability
Reserve currency users expect:
Stable inflation
Strong legal systems
Predictable governments
Transparent financial institutions
Countries hesitate to store reserves in a currency if the issuing government is unstable or unpredictable.
C. Deep and Liquid Financial Markets
Liquidity means assets can be bought or sold easily.
U.S. Treasury bonds are considered the safest and most liquid assets on Earth.
This makes the dollar extremely convenient for global central banks and funds.
D. Network Effects
The more people use a currency, the more others are forced to use it.
It becomes a self-reinforcing cycle:
“Everyone uses the dollar because everyone else uses the dollar.”
3. The Dollar’s Dominance in Global Trade
The U.S. dollar accounts for:
Around 60% of global forex reserves
Nearly 90% of forex transactions
More than 50% of global trade invoicing
Even countries that don’t trade with the U.S. often settle in dollars. For example:
Oil, metals, and agricultural commodities are mostly priced in dollars.
Many international loans and bonds are issued in dollars.
This dominance creates a uniform standard in global transactions and reduces exchange rate risks.
4. How Reserve Currency Dominance Shapes Global Trade
A. Trade Pricing and Invoicing Power
When most global goods are priced in a single currency, it simplifies international trade.
Businesses avoid complex exchange-rate conversions and hedge only against dollar fluctuations.
For example:
India buys crude oil from Saudi Arabia in dollars, not rupees.
Japan buys Brazilian iron ore in dollars, not yen.
This standardization reduces friction in supply chains.
B. Lower Borrowing Costs for the Dominant Currency Country
Because demand for the reserve currency is high, the issuing country can borrow at lower costs.
The U.S. government benefits enormously from this:
Foreign countries buy trillions of dollars in U.S. bonds.
This demand keeps U.S. interest rates lower than they otherwise would be.
Some economists call this the “exorbitant privilege.”
C. Increased Global Influence
Countries that depend on the dollar become sensitive to U.S. policies.
For example:
U.S. sanctions become far more effective because they limit access to the global financial system dominated by the dollar.
Reserve currency dominance therefore increases geopolitical power.
D. Exchange Rate Spillovers
When the dollar strengthens:
Global importers face higher costs
Emerging markets see increased currency volatility
Countries with dollar-denominated debt struggle
Dollar cycles heavily influence global commodity prices and capital flows.
5. Benefits for the Issuing Country
A. Global Demand for Its Assets
Other countries must hold dollar assets (bonds, stocks, etc.) to participate in global trade.
This inflow of foreign capital boosts:
U.S. financial markets
Investment
Corporate growth
B. Ability to Run Larger Deficits
The U.S. can print dollars and borrow cheaply.
This allows:
Higher government spending
Larger trade deficits
A strong consumer economy
Countries with non-reserve currencies don’t enjoy such flexibility.
C. Strong Geopolitical Leverage
The U.S. can limit access to:
SWIFT
Dollar clearing banks
U.S.-based financial institutions
This gives it unmatched diplomatic influence.
6. Challenges and Risks of Reserve Currency Dominance
A. Global Dependence on a Single Currency
Overreliance on the dollar exposes the world to U.S. economic cycles.
A strong dollar can cause:
Global recessions
Debt crises in emerging markets
Commodity price spikes
B. Vulnerability to U.S. Policies
Countries trading in dollars become exposed to:
U.S. interest rate changes (Federal Reserve policy)
Political sanctions
Dollar liquidity shortages
C. Internal Weakness in the Dominant Country
A country with a reserve currency might experience:
Overvalued currency
Loss of export competitiveness
Higher trade deficits
This is sometimes called the Triffin Dilemma.
D. Shift in Global Power Balance
As emerging economies grow, the dominance of a single currency may decline.
China’s yuan, Europe’s euro, or even digital currencies could dilute dollar power in the future.
7. Possible Contenders to Replace or Challenge the Dollar
A. The Euro
Strengths:
Large economic base
Strong institutions
Weaknesses:
Fragmented political structure
Debt issues in some member states
B. The Chinese Yuan
Strengths:
World’s second-largest economy
Rising global influence
Weaknesses:
Capital controls
Limited convertibility
Concerns over regulatory transparency
C. Digital Currencies and CBDCs
Central bank digital currencies (CBDCs) could change settlement systems.
However, widespread trust and adoption are still uncertain.
8. The Future of Reserve Currency Dominance
While the dollar remains dominant, global trends suggest:
Gradual diversification of reserves
Increased regional currencies in trade
Rise of digital settlement networks
Efforts by China and Middle East economies to reduce dollar dependence
But a complete shift away from the dollar is unlikely in the near future because:
No alternative matches its liquidity and trust.
Global markets remain heavily dollar-centric.
Any transition, if it occurs, will be slow and multi-polar.
Conclusion
Reserve currency dominance is a powerful global economic force that shapes international trade, investment flows, geopolitical strategies, and financial stability. The U.S. dollar currently holds an unmatched position due to its liquidity, trust, broad acceptance, and the strength of U.S. institutions. Although challenges such as de-dollarization, digital currencies, and the rise of other economies exist, the dollar’s dominance is supported by decades of structural advantages. Understanding this dynamic is essential for countries, investors, businesses, and policymakers participating in an increasingly interconnected global system.

$QQQ: IS THE PULLBACK OVER ?Has the pullback from the all-time high concluded?
Analysis of the chart indicates that the decline from the all-time high appears corrective. This suggests it is unlikely to undermine the prevailing upward trend that began at the lows observed in April, despite registering a 9% decrease.
It is noteworthy that the 0.382 retracement level lies at 548, and the 200-day simple moving average (SMA) is positioned at 544. Consequently, the correction remains well within the boundaries of the existing uptrend, as it has yet to approach the typical 0.382 retracement threshold.
There is also potential evidence of a bullish flag pattern emerging.
The presence of a bearish marubozu candle followed by a doji during the downtrend could imply a potential reversal, with today's bullish gap-up-and-go serving as a possible confirmation signal.
Furthermore, the 14-period RSI has surpassed its resistance trendline; however, this should be validated by a sustained move above the 50 level.
While there are encouraging technical signals, a definitive bottom has not yet been confirmed yet.
Key indicators to monitor include:
• The establishment of higher highs and higher lows, maintaining support at 588.
• A break above the upper trendline of the flag pattern, including moves above the 50-day moving average and significant resistance at 613.
Although QQQ continues in a favorable direction, it is premature to confirm a conclusive trend reversal at present.
Who won Earnings Season?The top 10 holdings in Invesco's Nasdaq 100 ETF (QQQ) as measured in relative strength since October 1 (Note that Alphabet counts for two of them GOOG and GOOGL). Which companies are investors propping up going into the end of the year?
Mostly Alphabet Inc. a.k.a. Google, but surprisingly also Amazon, Broadcom and Apple. If the market goes bullish and hits a new high by the end of the year, these are the ones who will lead the way.

$QQQ day trading short end of day Seeing that they have sold here into close with big money as of 2:52 at 605.20
QQQ: Growth & Bullish Forecast
The analysis of the QQQ chart clearly shows us that the pair is finally about to go up due to the rising pressure from the buyers.
❤️ Please, support our work with like & comment! ❤️
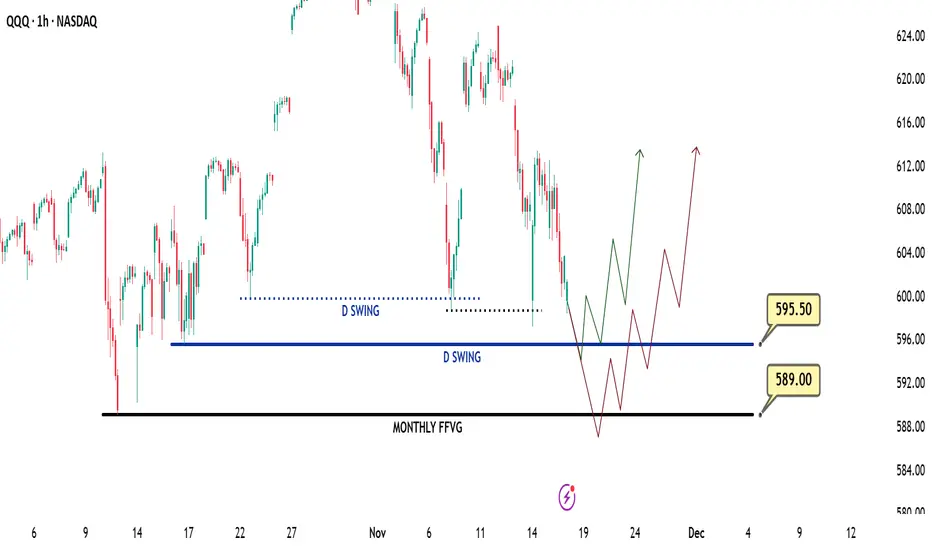
Daily QQQ (US100-NQ) Outlook - Prediction (21 NOV)Daily QQQ (US100-NQ) Outlook - Prediction (21 NOV)
📊 Market Sentiment
Market sentiment is bearish right now, in my opinion. The FED is expected not to cut rates in December, and the uncertainty around when rate cuts may resume in 2026 is adding pressure. After yesterday’s intraday crash, overall market anxiety has increased significantly.
📈 Technical Analysis
Price tapped the monthly FVG level around 588.5, which holds significant liquidity. In my view, this zone may set up the foundation for a potential Friday bounce.
📌 Game Plan – Prediction
I expect two possible scenarios:
Scenario 1 (Black Line):
Price may consolidate and range between 597–588, creating choppy intraday price action.
Scenario 2 (Red Line):
Price may retrace toward 578.5, then recover and move back above the 588 level.
💬 For detailed insights and broader market context, please check my Substack link in profile.
⚠️ For educational purposes only. This is not financial advice.

QQQ- BEarish Sequenceexpecting a 5-3-5 correction not to different from othe out look but had to change a few things good luck!

Daily QQQ (US100-NQ) Outlook - Prediction (20 NOV)Daily QQQ (US100-NQ) Outlook - Prediction
📊 Market Sentiment
Market sentiment appears neutral to bullish right now, in my opinion. The FED may pause rate cuts in December, which previously contributed to selling pressure and hedging flows. However, with the U.S. government reopening last week, updated economic data will begin to flow again. If employment data weakens and CPI comes in low or stable, it could support renewed bullish momentum.
NVDA beat earnings expectations and addressed AI bubble concerns clearly. AI demand remains strong, and their revenue growth continues to accelerate. U.S. tech firms turned notably green after the release, further boosting bullish sentiment.
📈 Technical Analysis
Price is currently rising toward 613.5 following NVDA’s earnings results. A strong bullish candle close has appeared on NQ, indicating solid upward momentum heading into today’s session.
📌 Game Plan – Prediction
I will be buying calls at the opening, targeting 613.5 first. After that, I will be targeting 625. If I see a 1H bearish close below the opening price, I will exit my positions, as I expect strong bullish momentum after the market opens.
💬 For detailed insights and broader market context, please check my Substack link in profile.
⚠️ For educational purposes only. This is not financial advice.

Nasdaq. Neochanneling vision practice from November 20, 2025.Analysis of the probable movement of Nasdaq using the psychological technology of neochanneling.
For the NASDAQ index, a decline toward the price levels of September 2025 is expected. The first target level of the decline is around 560 points.
По индексу NASDAQ ожидается снижение в район цен сентября 2025 года. Первый целевой уровень снижения — около 560 пунктов.

QQQ megaphone updateLooking for a small bounce here on NVDA earnings that gets sold into, then the larger correction can begin in earnest
