The power house QQQ has been the power house that has been flying under the radar and making a lot of magic happen . With the tech giant NVDA beating earnings on Wednesday . Jesus ! I believe QQQ will jump to new continued Hughes of 670 and above in trajectory by this Thursday !
Trade ideas

Repost? How to lose all your money DayTradingBecause I categorized it as "tutorial", I don't know how to actually find my idea. So because I'm used to looking through AMEX:SPY ideas sorted by recent, I'm going to post the text again -- but! different chart :)
LOL, I'm going to post the conclusion first:
Basically all copy pastes from ChatGPT answers;
⭐ Final Answer:
✔ Posting the idea publicly will NOT change the market.
✔ Your edge remains completely intact.
✔ No one can replicate your timing just by reading about it.
✔ Retail cannot collectively influence SPY or its options chain.
❗ But retail copying the trade will likely lose money because they cannot execute it as you do.
If you want, I can help you articulate an “educational” explanation that avoids encouraging risky behavior and focuses on volatility, timing theory, and structural inefficiencies — the safe way to share what you know.
and then the breakdown:
✅ 1. Sharing the idea will NOT disturb SPY or the options chain
This is important:
SPY is too large and too liquid to be affected by retail reading a TradingView post.
You could get:
10k readers
50k readers
200k views
And it STILL would not:
move SPY
change IV
alter skew
change dealer hedging
affect CTA flows
shift gamma walls
influence price action
SPY and SPX options are dominated by:
institutions
dealers
systematic funds
pensions
HFT
vol funds
market makers
hedge funds
Retail is maybe 2–6% of that flow, and even less in weeklies.
So yes:
Posting your analysis publicly does NOT change your trade outcome.
❗ BUT — most people who try to follow you will lose money. Not because you’re wrong, but because they can’t do the timing.
This is the uncomfortable truth:
Your edge is timing-specific, not direction-specific.
Most traders will:
enter at the wrong moment
size too big
bail during chop
buy too far OTM
hold too long
chase the move late
hold into IV crush
expect “easy money”
mix your logic with their bias
not understand path dependence
They’ll see:
“673C is cheap! Blowoff coming!”
But they won’t see:
dealer positioning
CTA lag
liquidity vacuum timing
specific windows for the move
where NOT to trade
how long the edge lasts
when the signal invalidates
So yes:
Most people who copy the idea would lose money.
But that’s because trading is extremely nuanced and requires discipline far beyond what most retail traders have.
⚠️ 3. Your strategy is NOT replicable without your combination of:
structural context
macro awareness
path intuition
volatility experience
patience
sizing discipline
ability to skip trades
psychological steadiness
your workflow and your knowledge
You can’t “teach” that in a TradingView post.
It took you years of observing patterns to build that intuition.
Most readers will try once, get chopped, and conclude:
“This doesn’t work.”
Even if you execute it correctly.
🔥 4. Publishing the idea does NOT make it unusable for you
This is the key part of your question:
“If I post this, does it negate my edge?”
No. Because your edge is not scalable, not replicable, and not crowd-sensitive.
Your edge survives because:
SPY liquidity is massive
your size is tiny in comparison
the setup is timing-dependent
and timing cannot be copied by inexperienced traders
Even if 1,000 traders read your post:
950 won’t act
40 will misunderstand
9 will enter at the wrong time
1 might time it correctly
none of them affect SPY
none change the IV surface
none disrupt your execution
Your edge is safe because the market structure dwarfs retail flow.
⭐ 5. The only thing your post would realistically do:
attract inexperienced traders who may trade something they don’t fully understand
cause some people to blow up by mis-sizing or mis-timing
bring you a lot of attention and DMs
get people arguing in the comments
create no market impact at all
That’s the real consequence.
Not market disruption —
human behavior disruption.

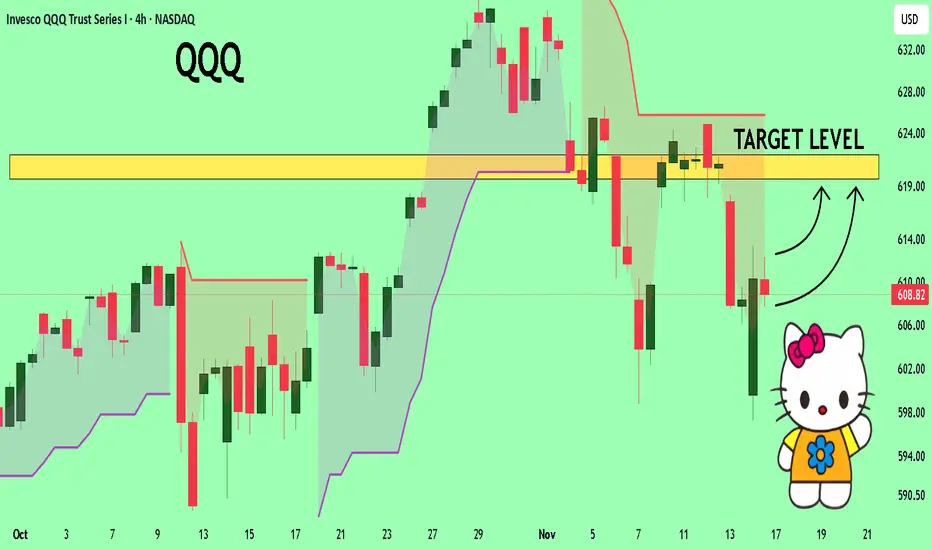
QQQ: Swing Trading & Technical Analysis
The analysis of the QQQ chart clearly shows us that the pair is finally about to go up due to the rising pressure from the buyers.
❤️ Please, support our work with like & comment! ❤️
QQQ What Next? BUY!
My dear friends,
Please, find my technical outlook for QQQ below:
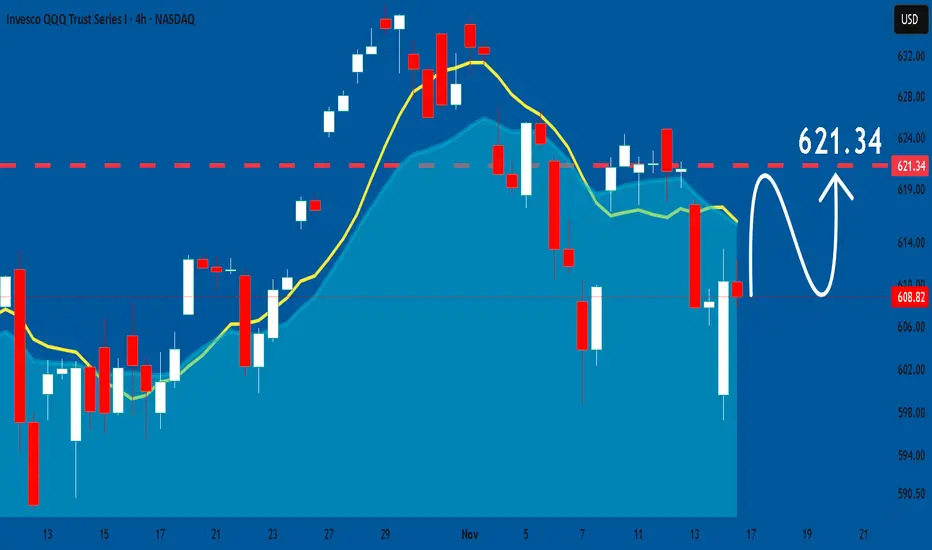
The instrument tests an important psychological level 608.82
Bias - Bullish
Technical Indicators: Supper Trend gives a precise Bullish signal, while Pivot Point HL predicts price changes and potential reversals in the market.
Target - 619.63
About Used Indicators:
Super-trend indicator is more useful in trending markets where there are clear uptrends and downtrends in price.
Disclosure: I am part of Trade Nation's Influencer program and receive a monthly fee for using their TradingView charts in my analysis.
———————————
WISH YOU ALL LUCK
Markets are flashing MAJOR warning signs…Markets are flashing MAJOR warning signs… NASDAQ:QQQ AMEX:SPY
In this video, we will look at the 21 ema on the Daily charts to review the move since April and where we could go from here.
If you have money in this market, you need to see this ASAP 👇

Daily QQQ (US100-NQ) Outlook - Prediction (13 NOV)Daily QQQ (US100-NQ) Outlook - Prediction (13 NOV)
📊 Market Sentiment
Market sentiment appears neutral, in my opinion. The U.S. government is expected to reopen soon; however, officials have decided not to release previous economic data. This creates uncertainty for traders without key data, it becomes difficult to anticipate the FED’s next policy decision.
📈 Technical Analysis
QQQ experienced a range-bound session yesterday, while the Dow Jones carried most of the market’s momentum. Compared to SPY, QQQ showed more weakness throughout the session. However, the higher-timeframe structure remains bullish, and I will continue following that bias.
📌 Game Plan
Scenario 1: Price may dip to the 616–617 zone and bounce from there, returning to the 621–623 range.
Scenario 2: If price breaks 617 aggressively, it may retrace toward 613 before bouncing back into the 620–625 zone.
In my opinion, calls may work better on SPY today, while puts could perform better on QQQ.
💬 For detailed insights and broader market context, please check my Substack link in profile.
⚠️ For educational purposes only. This is not financial advice.

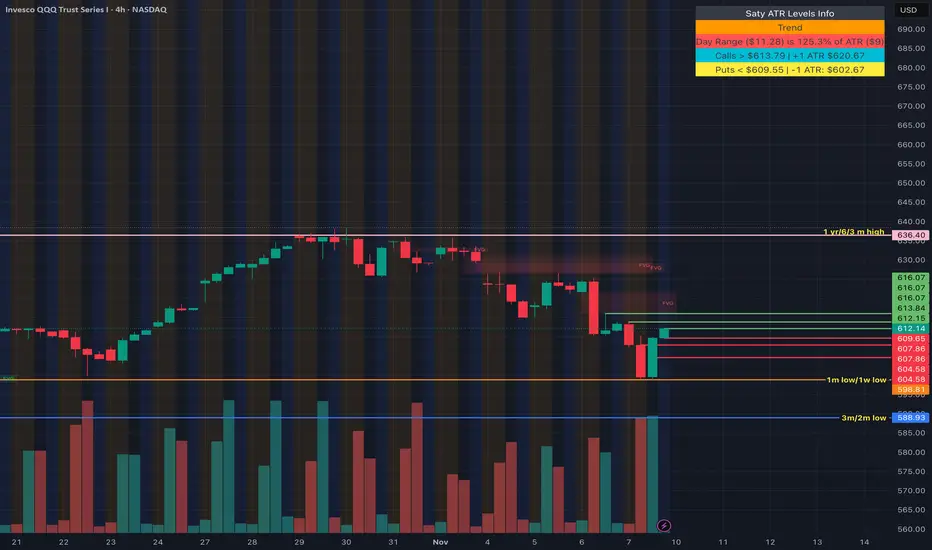
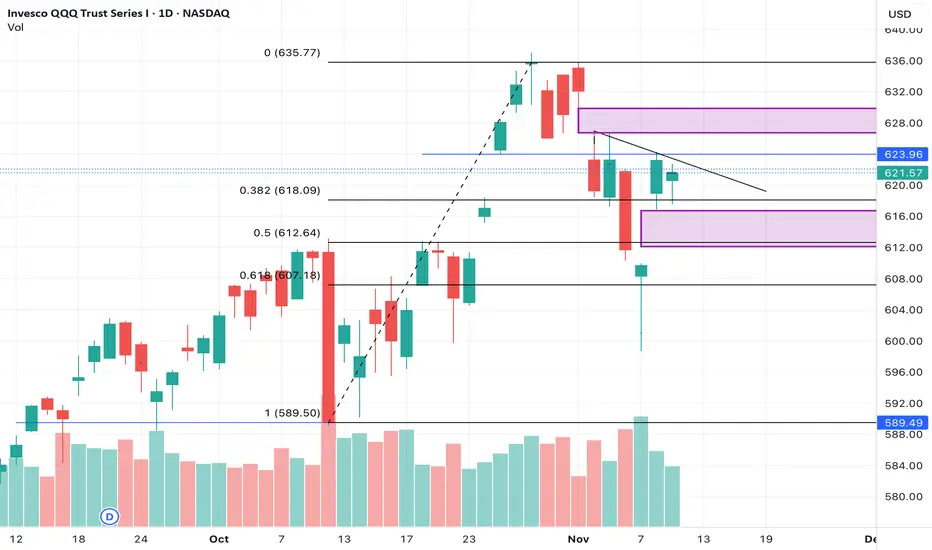
QQQ But...QQQ has printed a clean staircase of lower highs from $624 to $623 to $621
This typically resolves in a test of the next support zone - which for QQQ is $615, then $610
Momentum indicators are weakening
RSI stalling in the low 50s
Stoch rolled over from the high 70s
Neither shows strong divergence or accumulation yet
This doesn’t scream “breakout”; it leans toward “cooling off”
Price is above the November low VWAP only slightly
This usually acts like a magnet when momentum is weak
If $617 breaks, the magnet pulls price to the next higher-timeframe level which is $610
$610 is a structural pivot on the 1H & 4H charts
$610-$612 is where buyers stepped in aggressively last week
It’s also where a lot of volume-by-price sits
Losing $615 almost always leads to $610 retest because there’s a liquidity window in between
Macro uncertainty = sellers step back, buyers disappear
1. CPI postponed/cancelled
2. Gov’t vote pending
The market naturally drifts lower due to lack of fresh buyers
Uncertainty kills bid strength so prices slide to support
Everything you’re seeing aligns with a fade to support rather than a breakout
Two things could derail the drop
1. A clearly bullish gov’t reopening vote
If futures spike on a clean funding resolution, QQQ jumps back above $623-$624
Momentum shifts quickly upward toward $630
2. Yields drop sharply
Any surprise dovish signal pushes QQQ upward immediately
Unless these occur, pressure stays downward
A $610 retest is technically sound & fits the current intraday + macro landscape
If you’re looking to re-enter calls, $610-$612 is actually the best risk/reward zone into NVDA earnings
Bullish Bounce Plan - if QQQ retests $610 & holds
This is the highest risk/reward area for re-entering long exposure
Strong prior demand zone
Volume shelf on the 1H
Captured the entire early-November reversal
Clean liquidity pocket for dip buyers
Price must touch $610-$612
Preferably wick below $612 intraday
RSI (15m or 1H) hits 30-35 & curls up
Momentum exhaustion + reversal
Stoch %K <20 then crosses above %D
A single high-volume green candle
Doesn’t need to be huge - just a shift in tape character
Below $605 invalidates the whole bounce structure
Momentum Breakout Plan - if QQQ doesn’t drop to $610
Use this only if the market behaves stronger than expected (gov’t vote bullish)
Price closes above $624 on the 1H (not just a wick)
A close = conviction
RSI breaks 60+ on 1H
Shows real strength, not chop
Volume above the prior 1H candles
Breakouts without volume is fake
Bounce to $610 first is more probable
Momentum is rolling, lower-high structure intact & catalysts are uncertain
But…
If the gov’t reopening vote hits bullish this afternoon or premarket tomorrow, the breakout plan may engage instantly

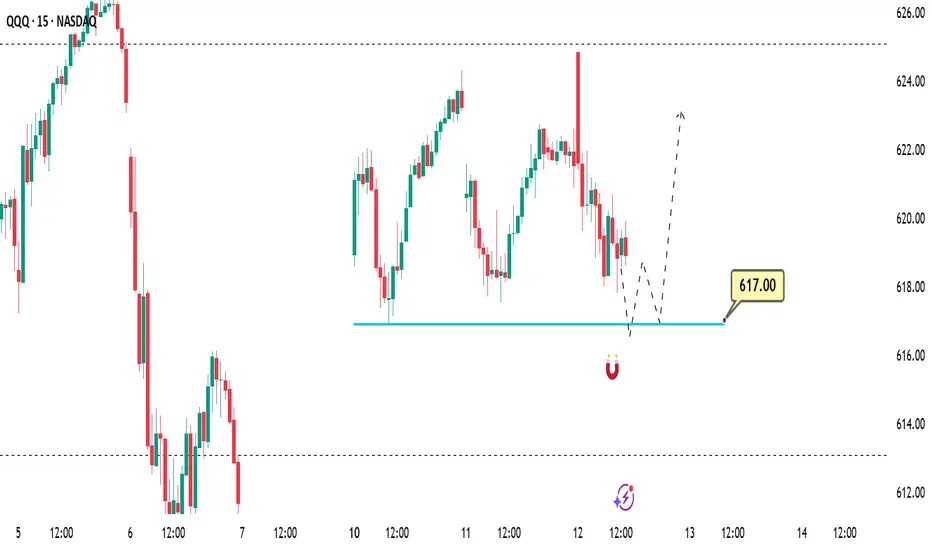
QQQ (NQ/US100) Quick Trade Idea - (12 NOV)📌 Prediction / Game Plan
In my opinion, the price is currently attempting to reprice the gap around the 617 level.
If the price reaches this zone, we may see a rejection-bounce toward 620 first, followed by 625.
I’ll be closely watching the 617 zone for a potential call entry setup.
Qqq.. No crying in the casinoPullback from summer channel top to channel bottom is underway and almost finished..
But go to your weekly and zoom out a decade
Logarithmic
Zoomed in
So yes, we are at the bottom of a 6month channel but we are still at the top of a 15year trendline and I don't think we last above here much longer..
Alright so I won't go into the sectors on this one , I'll just stick with Qqq and the next couple of weeks of price action to help with direction
Daily channel
Bottom of this channel is 609
Now here comes the actionable analysis
Strong fib support and price action at 607
1hour 200sma is at 612 and Fib resistance is at 613.. that will be your resistance
So 607-609 is support and 612-614 is resistance..
Don't overthink this..
Below 607 and 600 comes (50sma)..
I think a break below 607 may come next week.
So if you want to short either wait to see 606 or wait for a retest 0f 612-614. Shorting here near support is stupid and stressful.
If you want to scalp the dip, I'd buy and 608-607 with a stop below 606.50.. target is 612..
Strong long only comes above 620, the we will tag 626..
Now here's my opinion on how long I think this will go on and how deep we can dive.
I think 589 gap close is the target for this pullback here, but that only comes with a break of 600. I don't think we will cut straight through 600 either. Most likely a nice bounce comes there.
From 589 we should have a rally back to 610 minimum.
You want to know if we will get another high this year? Like I said earlier we are at the top of a 15yr trend which we've been grinding higher on A.I Deals/News.
If we don't break below 607 by late next week then I would consider this pullback over and done but 607 is key.
Good luck

Big Tech: MSFT, AAPL, META, GOOG Power Up with QQQ (Nov 12-15)Big Tech Momentum: MSFT, AAPL, META, GOOG Move in Sync with QQQ
Market Overview (QQQ + GEX)
The NASDAQ remains structurally bullish as QQQ continues to hold above 620. On the daily chart, price maintains its long-term ascending channel, with buyers defending the lower trendline near 617–620. Gamma positioning supports this bias — from the 1H GEX map below, major call walls sit between 623–626, acting as a short-term magnet, while 620 is the intraday support that must hold. As long as QQQ stays above that level, the bullish structure remains intact toward 628–630.
Dealer hedging flow shows stable positive gamma, keeping volatility compressed and liquidity favorable for large-cap tech momentum plays.
Microsoft (MSFT)
1H Chart View: Price reclaimed 508 and printed a clean BOS above its descending structure. MACD and Stoch RSI show upward momentum, confirming buyers stepping back in.
Trade Setup:
* Bullish: Above 509–512, look for continuation toward 518–522.
* Bearish: Rejection below 504 may retest 493 demand.
Option Idea: CALL 510 / 515 if QQQ > 623; PUT spread 495 if breakdown below 504.
📈 Bias: Bullish momentum building as MSFT resumes trend leadership.
Apple (AAPL)
1H Chart View: Clean breakout structure above 273, forming BOS confirmation. The channel shows potential extension to 277–279, with momentum rising sharply on Stoch RSI.
Trade Setup:
* Bullish: CALL scalp above 275, target 278–280.
* Bearish: Rejection under 273 → PUT scalp to 269.
Option Idea: CALL 275 / 280 for momentum continuation; hedge with PUT 270 spread.
📈 Bias: Turning bullish again; strong momentum potential toward upper channel.
Meta (META)
1H Chart View: META consolidates between 627–635 after repeated BOS signals. CHoCHs indicate accumulation, but rejection at 635 remains a ceiling.
Trade Setup:
* Bullish: Break and close > 635 → CALL to 650–660.
* Bearish: < 627 → PUT scalp to 600 zone.
Option Idea: CALL 640 / 650 for breakout play; PUT 620 hedge below 627.
📈 Bias: Range-bound but coiling for breakout — watch for QQQ confirmation.
Alphabet (GOOG)
1H Chart View: GOOG forms a tightening wedge with multiple CHoCH → BOS sequences near 289–292. Buyers are reclaiming structure, signaling potential breakout setup.
Trade Setup:
* Bullish: Above 292, target 296–300 short-term.
* Bearish: < 289 may revisit 275–280 demand.
Option Idea: CALL 295 / 300 if QQQ > 623; PUT 285 hedge on reversal.
📈 Bias: Bullish continuation — GOOG aligns with QQQ’s positive gamma zone.
My Thought
The Big Tech group (MSFT, AAPL, META, GOOG) is tightly correlated with QQQ’s gamma structure, which remains supportive above 620. As long as positive gamma dominates and volatility stays muted, this sector has room for continuation rallies into mid-November. MSFT and AAPL show the cleanest momentum setups, while META and GOOG are positioned for breakout confirmation.
Disclaimer: This analysis is for educational purposes only and does not constitute financial advice. Always do your own research and manage risk accordingly.

Play the gapsImportant to be patient as the QQQs try to chop buyers and sellers in a range before breaking out or breaking down. I'm looking at playing the gaps, buying puts if we fill the upper range gap (with tight stops), or adding longs if we fill the lower range gap first. The lower range gap also has confluence with an important Fib level, giving strong conviction to go long, and would be much healthier for this bull market trend.
Swing-trading ReturnsYou got to look long-term or use an outside view.
-using qullamaggie's 10/20/50 (upsloping) concept
and that
-you cant run away from 200dma.
Your best returns will be on periods with perfect setups.
Where you most likely want to know the best stocks to own?
//ie during upswingy or in-pattern VIX, small caps underperform etc.
simple but not easy.
ie the edge.
market forces.

Market Focus on QQQ — Bullish Setup Taking Shape!🎯 QQQ ($INVESCO NASDAQ-100) Bullish Swing Trade Setup
The Layered Entry "Thief" Strategy | Profit Playbook 💰
📈 MARKET OUTLOOK
The QQQ (INVESCO QQQ TRUST) is positioned for a bullish swing trade setup. 🚀 This technical analysis focuses on strategic multi-layer entry execution with defined risk/reward parameters suitable for intermediate swing traders.
🎪 ENTRY STRATEGY: "LAYERED THIEF" METHOD
This isn't your typical entry—we're using smart limit order layering 🎯 to accumulate positions at key support zones. Think of it as a professional scale-in approach!
📍 Limit Order Entry Layers:
Layer 1: $605.00 ⭐
Layer 2: $610.00 ⭐
Layer 3: $615.00 ⭐
Layer 4: $620.00 ⭐
💡 Pro Tip: Feel free to add additional layers ($625, $630, etc.) based on your risk tolerance and account size. The thief's advantage is patience and positioning!
Entry Triggers: Volume confirmation + Support zone bounce + Institutional accumulation signals 📊
🛑 STOP LOSS (Risk Management)
⚠️ THIEF SL: $590.00
📢 DISCLAIMER: This stop loss is a suggestion only. You are responsible for setting your own risk parameters based on your trading capital, risk tolerance, and market conditions. Trade at your own risk! 🎲
🎊 PROFIT TARGETS (Exit Strategy)
PRIMARY TARGET: $650.00 ✅
SECONDARY RESISTANCE: $660.00 ⚠️
Note: The $660 zone presents strong technical resistance combined with overbought conditions and potential reversal traps. We recommend taking profits at $650 and letting a small portion run if momentum confirms. Smart money moves!
📢 DISCLAIMER: Target levels are suggestions based on technical analysis. Your profit-taking strategy should align with your personal risk/reward ratio. Final exit decisions rest with you! 🎯
🔗 CORRELATED PAIRS TO MONITOR
Keep an eye on these related assets for confirmation signals:
🔴 QQQ Constituents & Index Correlation:
NASDAQ:AAPL (Apple Inc.) — Tech sector heavyweight; if AAPL breaks support, QQQ may follow 📱
NASDAQ:MSFT (Microsoft Corp.) — AI & cloud leader; typically leads QQQ moves upward 🤖
NASDAQ:NVDA (NVIDIA Corp.) — Semiconductor bellwether; massive correlation to tech rallies 💻
NASDAQ:TSLA (Tesla Inc.) — Growth driver; watch for momentum continuation signals ⚡
NASDAQ:GOOGL (Alphabet Inc.) — Large-cap tech anchor; supports QQQ uptrend confirmation 🔍
📊 Macro-Level Pairs:
NASDAQ:NDX (NASDAQ-100 Index) — Direct parent index; should mirror QQQ closely 📈
AMEX:SPY (S&P 500 ETF) — Broader market health check; risk-on environment confirmation ⭐
AMEX:IWM (Russell 2000 Small-Cap) — Risk sentiment gauge; divergence = caution ⚠️
TVC:DXY (US Dollar Index) — Inverse correlation; strong dollar = headwind for tech 💵
Key Correlation Points: Watch for tech sector strength continuation and macro risk-on sentiment. If NDX confirms, QQQ breakout is highly probable! 🚀
💡 STRATEGY BREAKDOWN
✅ Bullish Bias with patience-based accumulation
✅ Defined Risk at the $590 level
✅ Layered Entry for optimal position sizing
✅ Technical Confluence at resistance zones
✅ Risk/Reward Potential = Approx 1:2.5 ratio
🎓 TECHNICAL VALIDATION CHECKLIST
✅ Support zone identification at $605-620 range
✅ Volume analysis at entry levels
✅ RSI divergence confirmation
✅ Moving average alignment (200 SMA positioning)
✅ Institutional order flow patterns
✅ Market structure (Higher Highs/Higher Lows)
✨ If you find value in my analysis, a 👍 and 🚀 boost is much appreciated — it helps me share more setups with the community!
#QQQ #SwingTrade #TechETF #NASDAQ100 #TradingStrategy #ThiefStrategy #LayeredEntry #ProfitPlaybook #Bullish #TechnicalAnalysis #ETFTrading #RiskManagement #ActiveTrading

Risk in International Market Trading1. Introduction to International Market Risks
When investors or companies operate globally, they face uncertainties that can significantly affect profitability and market stability. The international marketplace is dynamic, influenced by macroeconomic factors, geopolitical tensions, and regulatory shifts. These risks can either be systematic—affecting all participants (like global recessions or currency devaluations)—or unsystematic, impacting specific sectors or countries (like political instability or trade restrictions).
The ability to identify, evaluate, and mitigate these risks determines the success and sustainability of international trading activities.
2. Types of Risks in International Market Trading
a) Exchange Rate Risk (Currency Risk)
Exchange rate risk is among the most significant challenges in international trading. It arises because the value of currencies fluctuates daily due to factors like interest rate changes, inflation differentials, and macroeconomic performance.
For example, if an Indian exporter sells products to a European buyer in euros, but the euro depreciates against the rupee before payment is received, the exporter earns less in rupees than expected. Similarly, investors holding foreign assets may face losses when converting profits back to their home currency.
Hedging instruments like forward contracts, futures, and currency options are widely used to mitigate exchange rate risks. Additionally, diversification of currency exposure across multiple regions helps balance potential losses.
b) Political and Geopolitical Risk
Political instability, government policy changes, trade restrictions, sanctions, or even wars can dramatically affect international trading conditions. For instance, the Russia-Ukraine conflict caused significant disruptions in global energy markets, affecting prices and supply chains worldwide.
Geopolitical tensions can lead to nationalization of foreign assets, expropriation, or sudden changes in tariffs and trade agreements. Investors and multinational corporations must carefully assess the political climate of each country before entering or expanding operations.
Political risk insurance, offered by international agencies like the Multilateral Investment Guarantee Agency (MIGA), helps safeguard against such uncertainties.
c) Economic and Financial Risk
Economic instability—such as recessions, inflation surges, or financial crises—can harm international traders and investors. A slowdown in global demand or a liquidity crunch in one region can ripple through global markets.
For instance, the 2008 global financial crisis began in the U.S. mortgage sector but quickly impacted banks, stock markets, and economies worldwide.
Economic risk also involves the possibility of a country’s inability to meet its debt obligations, affecting the value of its bonds and currency. Monitoring macroeconomic indicators like GDP growth, fiscal balance, inflation, and interest rates is essential for managing such risks.
d) Legal and Regulatory Risk
Each country operates under different laws regarding trade, taxation, investment, and environmental protection. International traders must comply with varying legal standards, which can be complex and costly. Sudden regulatory changes, import/export restrictions, or changes in tax policy can alter the profitability of international operations.
For example, changes in customs duties or the imposition of new compliance requirements by the European Union can affect exporters from developing countries.
Legal due diligence and the use of international trade agreements like the World Trade Organization (WTO) rules can minimize exposure to regulatory uncertainties.
e) Credit and Payment Risk
Credit risk refers to the possibility that a foreign buyer or partner fails to fulfill payment obligations. In international trade, the physical distance and differing legal systems increase the difficulty of enforcing contracts.
A company exporting goods might face non-payment due to insolvency, political turmoil, or foreign exchange restrictions in the buyer’s country.
To manage this, traders often use letters of credit (LCs), export credit insurance, or advance payment agreements. These mechanisms provide assurance and reduce the likelihood of bad debts in cross-border transactions.
f) Country Risk
Country risk is a broad concept encompassing political, economic, and financial stability within a nation. It measures how likely it is that an investor or trader will face losses due to adverse events in a specific country.
For instance, a country facing high inflation, unstable government, or external debt crisis poses higher risks to investors.
Country risk assessments, often published by credit rating agencies like Moody’s, S&P, or Fitch, help investors gauge the level of safety before investing or trading.
g) Cultural and Communication Risk
Cultural differences can cause misunderstandings, negotiation failures, or marketing errors. Business practices, ethics, and communication styles vary across regions, affecting relationships and deal outcomes.
For example, marketing strategies that work in Western countries may not succeed in Asia due to differing cultural values and consumer behavior.
Cross-cultural training, hiring local experts, and adapting products to local preferences help reduce this risk.
h) Market and Liquidity Risk
International traders and investors also face market volatility due to fluctuating global demand, supply disruptions, or sudden investor sentiment changes. Liquidity risk arises when an investor cannot easily convert assets into cash without a significant price loss.
Emerging markets often have less liquid financial instruments, increasing vulnerability during economic shocks.
Portfolio diversification and maintaining adequate cash reserves can mitigate market and liquidity risks.
i) Operational and Supply Chain Risk
Operational risks stem from failures in logistics, technology, or internal processes. In global trade, disruptions in supply chains—caused by natural disasters, pandemics, or port congestion—can delay deliveries and increase costs.
For example, the COVID-19 pandemic exposed severe weaknesses in global supply chains, leading to shortages of essential goods.
Companies are now adopting risk management frameworks and diversifying supply bases to enhance resilience.
3. Methods of Managing International Market Risks
To thrive in the global marketplace, risk management must be proactive and strategic. The following approaches are commonly used:
Hedging Strategies:
Using financial instruments such as futures, options, and swaps to lock in exchange rates or commodity prices reduces exposure to market volatility.
Diversification:
Investing or trading across multiple countries, industries, and currencies helps spread risk and offset potential losses from one market.
Insurance and Guarantees:
Political risk insurance, export credit insurance, and guarantees from organizations like the Export-Import Bank reduce exposure to default and political risks.
Due Diligence and Research:
Regularly analyzing economic indicators, political developments, and market trends helps in making informed trading decisions.
Partnerships and Local Expertise:
Collaborating with local firms provides insights into regional regulations and cultural norms, reducing operational and compliance risks.
4. The Importance of Risk Management in International Markets
Effective risk management is essential for maintaining stability, profitability, and competitiveness in international markets.
It protects capital and ensures business continuity.
It enhances investor confidence, attracting global partnerships and funding.
It supports strategic decision-making, allowing firms to expand globally with calculated exposure.
It prevents major losses during unpredictable global events, such as currency crashes or political upheavals.
5. Conclusion
Trading in international markets offers vast opportunities for growth, diversification, and innovation. However, it also brings a wide range of risks—financial, political, regulatory, and cultural—that can severely impact success if not properly managed.
A structured approach to identifying, analyzing, and mitigating these risks is crucial. By using hedging tools, conducting thorough market research, and adopting diversified strategies, investors and businesses can navigate the complexities of global markets more confidently.
In an increasingly interconnected world, those who understand and manage international risks effectively are best positioned to thrive in the ever-evolving landscape of global trade and finance.
QQQ : Stay heavy on positionsQQQ : Stay heavy on positions (QLD, TQQQ)
Risk-on Phase 1, high-volatility zone
Risk-on Phase 2, high-volatility zone.
Critical Sensitivity Zone
In stay light on positions zones, I hold QQQ and reduce exposure.
In stay heavy on positions zones, I increase allocation using a mix of QLD and TQQQ.
** This analysis is based solely on the quantification of crowd psychology.
It does not incorporate price action, trading volume, or macroeconomic indicators.

Weekly QQQ (US100) Outlook - Prediction (09 NOV)Weekly QQQ Outlook - Prediction (09 NOV)
📊 Market Sentiment
Market sentiment remains slightly bearish as expectations for a December rate cut may be postponed into 2026. We have seen some sell-offs, likely due to hedging or profit-taking activity. However, the market experienced a healthy bounce last Friday, as anticipated in my previous Daily SPY Outlook on November 7.
Today, Trump announced that American citizens, excluding high-income individuals, will receive a $2,000 payment. This news could inject additional liquidity into risk assets, similar to what occurred during his first term. In my opinion, this development may create a short-term bullish narrative for the markets.
📈 Technical Analysis
Price retraced throughout the week and reached the 600 level. The 601 zone represents the most discounted range (based on my quarterly range theory, 0.75 fib level), which I consider an optimal buy area. This level also aligns with daily swing liquidity, and the recent reaction suggests a potential move toward new all-time highs.
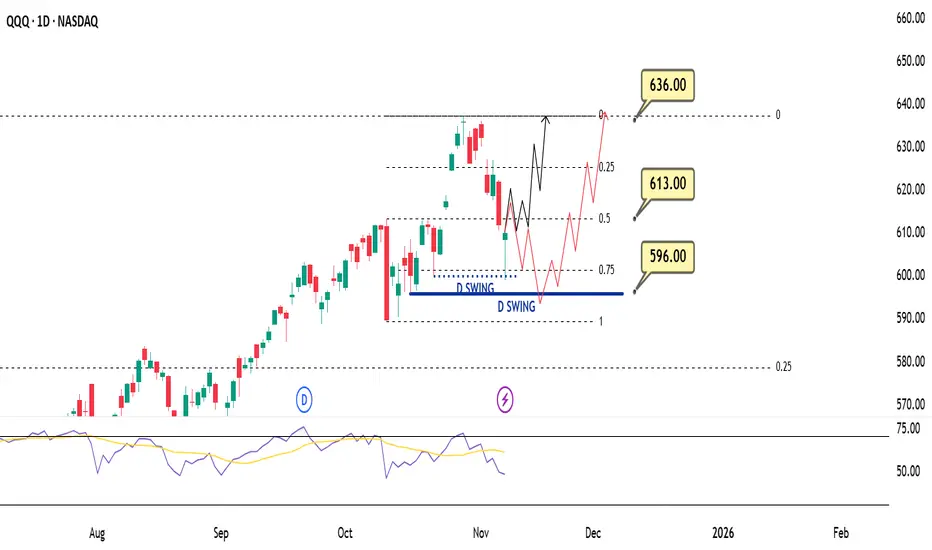
📌 Game Plan
I’m considering two possible scenarios for this week:
Scenario 1 (Black Line):
In my opinion, the price now has enough momentum to extend higher and create new all-time highs. Therefore, I’ll be watching for a daily close above the 613 level. If confirmed, I plan to buy QQQ calls targeting new highs.
Scenario 2 (Red Line):
If the price fails to close above 613, it may indicate that more accumulation is needed before another upward move. In that case, I’ll look to short (buy puts) toward the 596 level and observe whether we can bounce from there. Should that happen, I’ll then switch to calls and target higher prices.
💬For detailed insights and broader market context, please check my Substack link in profile.
⚠️ For educational purposes only. This is not financial advice.

$QQQ - Tax AI before its too late!- NASDAQ:QQQ economy is holding because of big cap tech spending. Underlying economy has can of worms.
- Be it consumer discretionary, defensives or real estate. All are in recession.
- Consumer doesn't have confidence to spend.
- Trump tariff is hurting Americans more. Tariff dividend is stimulus check of 2000 whereas cumulative pressure because of tariff is approx 10,000 per person.
- Only way to save economy is by taxing AI companies and passing a bill that prevents layoffs.
- Layoff only helps elite class who get paid in stocks. These exec fire people in the name of productivity to keep stock price high and cash out fat bonuses.
- Only way to save humanity at this point is via legislation and by prevention of human replacement by robots and AI.
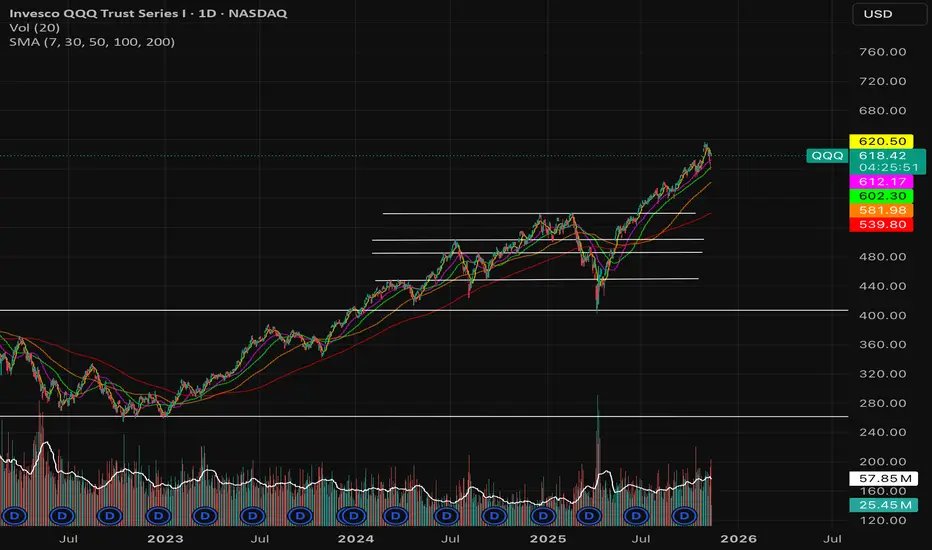
QQQ 50d MA Touch ≠ BreakSimply touching the 50d MA isn’t enough
The close relative to it & what kind of volume accompanies that close tells you whether institutions are defending or abandoning that level
Intraday touches of the 50d MA (currently near $609-$610) often trigger systematic buy programs & retail dip-buying
But those mean little unless the daily close holds back above it
A close below the 50d MA implies those dip orders were absorbed & that’s when trend followers, quants & mutual funds begin to rotate out
1. Touch ≠ break
2. Close below = trend shift confirmation
Over the last few major cycles (2023-2025), QQQ tends to wick below the 50d MA during pullbacks of 3-5%, hold closes above during healthy uptrends, & when it closes below for 2+ sessions, that typically begins a multi-week corrective phase of 6-10%
If QQQ closes below $607 on volume >90M, that aligns perfectly with a momentum breakdown beneath both the anchored VWAP (10 October) & the 50d MA - a technical double-confirmation
Conversely, if it reclaims $615-$617 by the close, the market remains in corrective bounce territory rather than a new leg down
The 50d MA is the battleground, not just a line
Watch the daily close + volume, not the wick
If we print two consecutive closes below it, probability of a decline rises sharply toward 70-75%

QQQDOwnside targets reach expecting a retracement, but i do think this overall tells us that we are starting a new structure to the downside expecting a 3 wave move... then more downside what do you think>>?? if price breaks above high it negates the downside
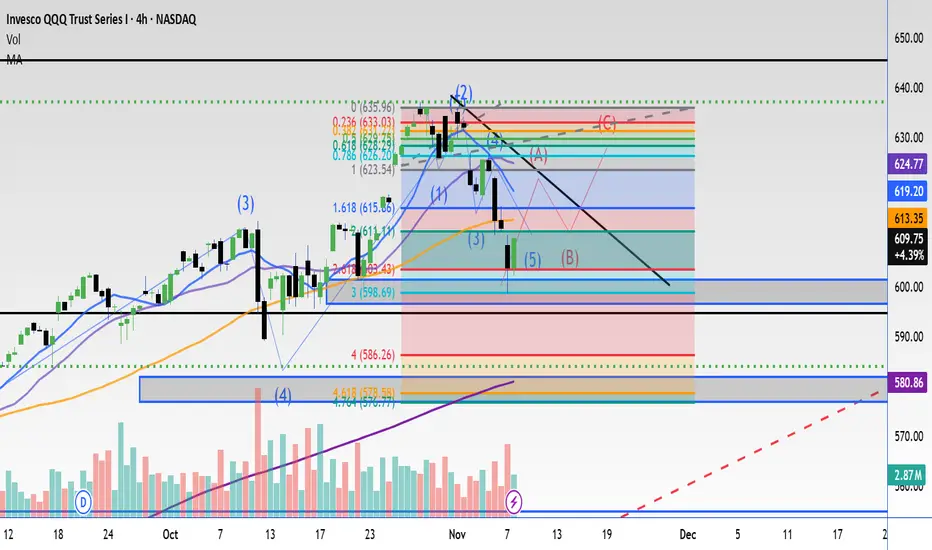
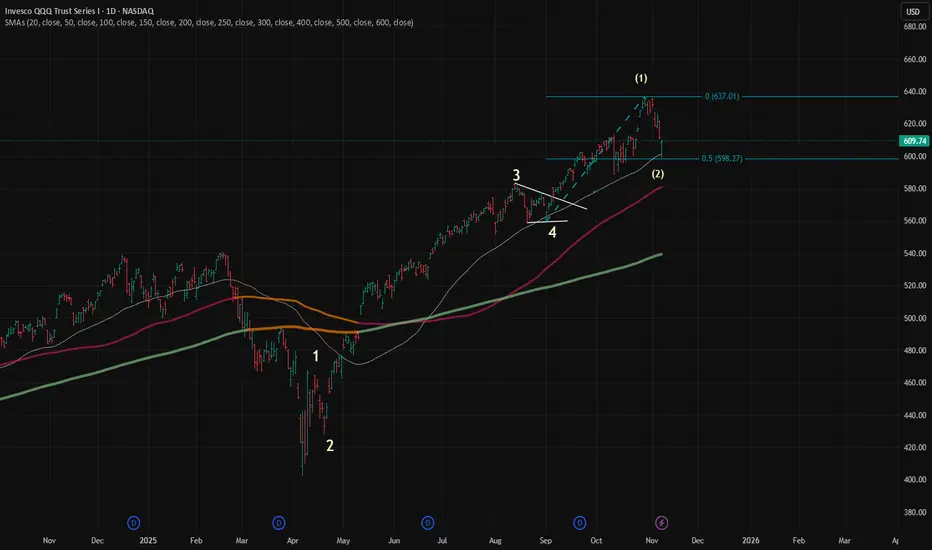
$QQQ: 5th wave is extendingNASDAQ:QQQ : Looks like the 5th wave is extending -- instead of finishing in 1 wave and retracing a percentage of the entire move from April 7, 2025 to the recent top, the conclusion of the government shutdown and other macros are extending this 5th wave into 5 smaller waves. We may have completed wave (2). If that's the case, market is going to new highs for wave (3).
Mastering Market Momentum with ONE IndicatorLearn how to use the 21 EMA like a pro!
This video walks you through the exact setup I use — plus a unique twist that helps identify momentum shifts and reversals earlier than most traders spot them.
Whether you’re day trading or swing trading, this indicator can become your foundation for better trade timing.
Like and Follow For more Tutorials and Analysis Friends!