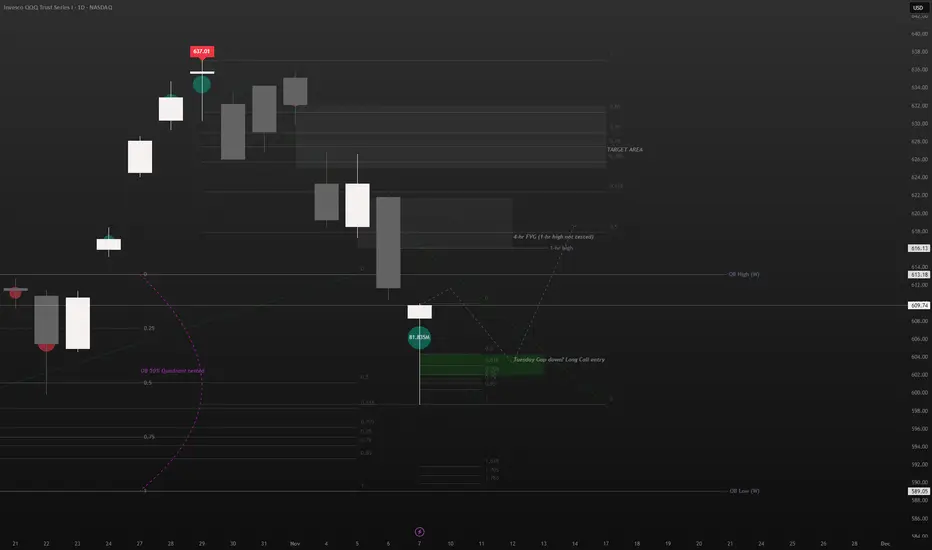
QQQ (Long idea)Lots of things going on here (haha).
1. This week we closed with a bullish hammer on daily after testing the inside 50% quadrant of the weekly OB candle.
- Good support shows strength back to the upside.
- I want to see a gap down Tuesday into the green area for calls.
2. Don't get the long idea twisted, I am still temporarily bearish.
- I am long back up to the 4-hr FVG, looking at a 1-hr high sweep. After this I am watching for continued downside.
- A push past the 4-hr FVG indicates bullishness and my target changes to .705 of the fibs.
3. If the 4-hr FVG fails, then my target becomes the OB low on weekly.
Trade ideas
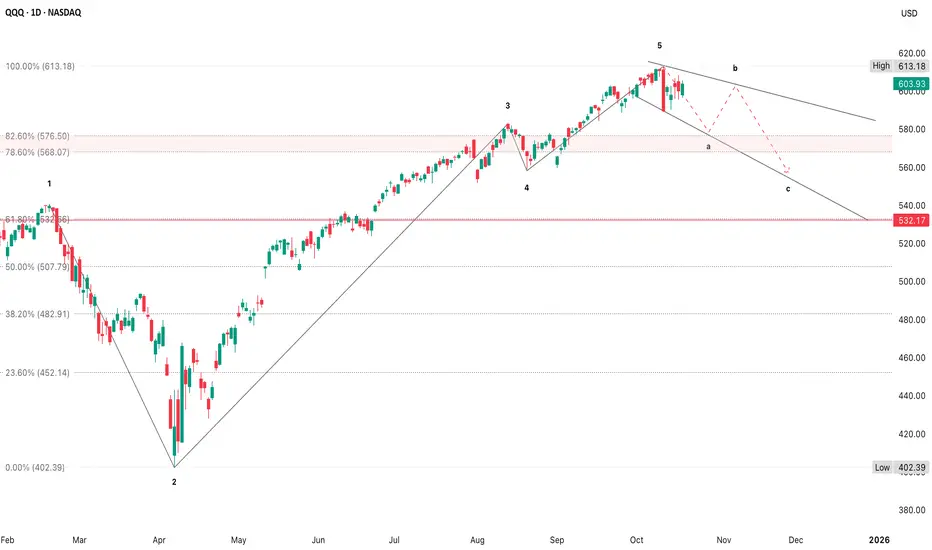
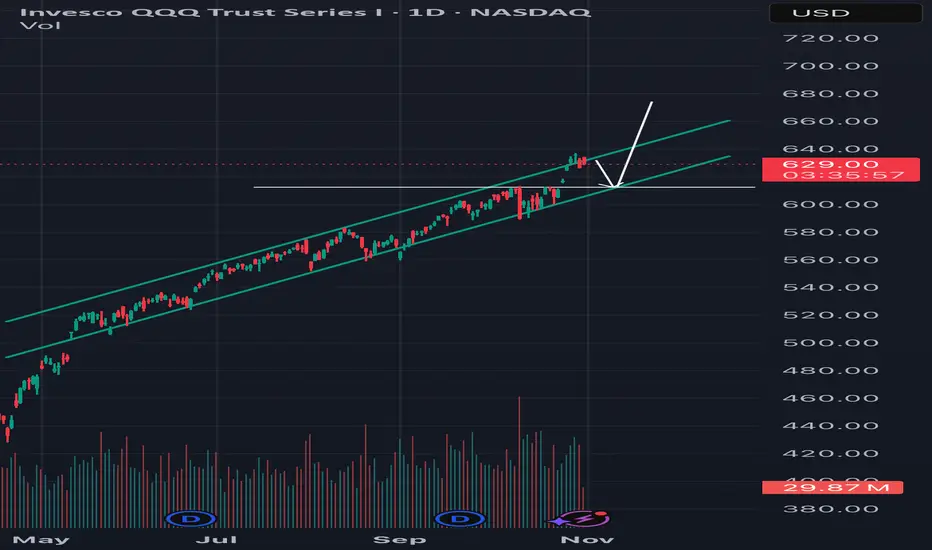
QQQ Probable RetracementThe current leg (mid-2025 onward) is the steepest recovery yet & that slope just broke
This indicates a possible mean reversion phase rather than another leg up
Steep advance > rounding top > 8-12% correction
Then a multi-month basing period before recovery
If that rhythm repeats, the current topping area around $613 could imply a pullback to $560-$580
That would be a “standard” correction, not a crisis
The red projection mimics the 2024 & mid-2023 patterns that featured a short distribution, decline & support at the previous breakout area
The support shelf sits near $580-$585, where prior resistance turned support (June-July 2025)
Below $575 would confirm a more durable trend break & that’s where longer-term funds start de-risking
Large-scale corrections on this timeframe (daily, spanning 6-12 months) usually take 2-4 weeks to play out from first break to low, followed by a 1-3 week consolidation near the floor
So if the current roll continues, your next decisive move window is late October into early November
If you’re trading via options, it reinforces using 2-3 week puts since they align with both the short-term structure & this macro corrective window
QQQ: Bulls Will Push Higher
Looking at the chart of QQQ right now we are seeing some interesting price action on the lower timeframes. Thus a local move up seems to be quite likely.
Disclosure: I am part of Trade Nation's Influencer program and receive a monthly fee for using their TradingView charts in my analysis.
❤️ Please, support our work with like & comment! ❤️

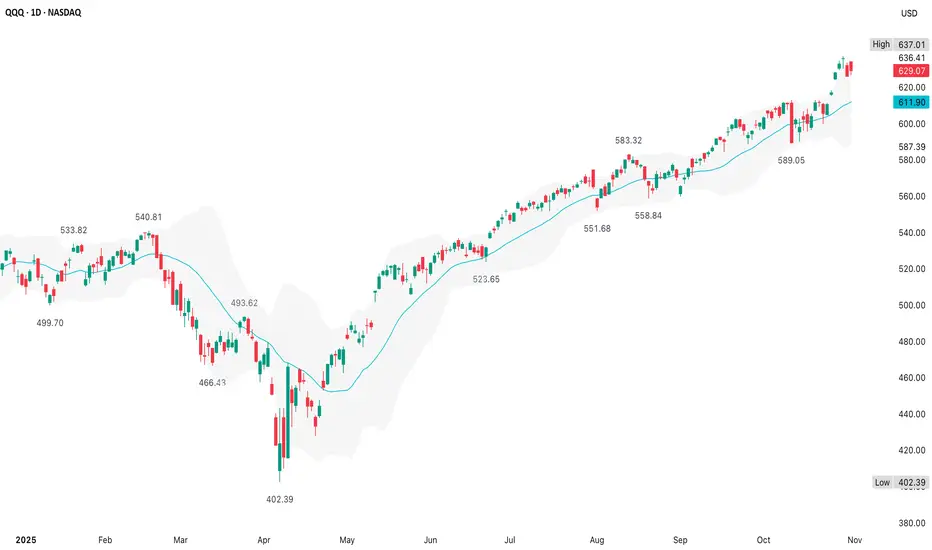
QQQ (7 November)QQQ remains within statistical bounds of its uptrend
A daily close back above $625 would re-open the path to $637+, while a close below $595 would warn that the current mean-reverting structure is breaking down
The ±3% price envelope nicely visualizes how tightly QQQ has been hugging its midline trend & how contained volatility has been despite recent pullbacks
The upper band (+3%) ≈ $635-$640
The lower band (−3%) ≈ $592-$595
The recent dip to ~$600 perfectly tagged the -3 % boundary, confirming that pullbacks have stayed within normal statistical volatility - a hallmark of a healthy uptrend
Each prior test of the lower band (June, mid-August, early October) led to mean reversion & then fresh highs within 2-3 weeks
A compression of price between $600-$620 while the ±3 % envelope narrows would likely precede a volatility burst for late November to early December
Hold >$611 is constructive; targets $625 to $635
Close <$600 suggest trend fatigue; would signal risk of a move toward $585-$590

FULL REVIEW 8-11-25 BEARISH REVERSAL TREND IN THE STOCK MARKET?TOP BEARISH REVERSAL SIGNAL IN THE STOCK MARKET?
Stock market overview.
On all the larger timeframes, everything on my watchlist is in a BULLISH TREND. On Daily market in bearish reversal signal.
The RSI is overbought and has negative divergence, indicating a likely downside reversal.
My watchlist: #gold #dxy #qqq #spx #vix #dia #iwm #appl #tsla #nvda #msft #amzn #googl #meta
Thanks for the likes and comments!
Good luck to everyone!

Momentum QuantSignals AI Screener 2025-11-06Momentum QuantSignals AI Screener 2025-11-06
🎯 UNUSUAL OPTIONS ACTIVITY DETECTED
AI Momentum Scanner Results
════════════════════════════════════════════════════════════════════════════════
💰 MARKET SCREENER SIGNALS
Generated: November 06, 2025 at 10:34 PM
════════════════════════════════════════════════════════════════════════════════
📊 2 Total Opportunities • ✅ 2 Ready to Trade • ⏸️ 0 Monitor
────────────────────────────────────────────────────────────────────────────────
┌─ #1 ✅ NASDAQ:HOOD • Score: 68/100 • ENTER NOW
│
│ 📅 DTE: 7 days
│ 🟡 Risk Level: Medium Risk (4/10)
│
│ 📰 Catalyst: +59.2% buying pressure indicating institutional accumulation
│ 📊 Setup: Strong bullish order imbalance with high liquidity and tight spreads
│ 🎯 Target: $135-138 within 3 days
│ 📈 Options: $130 CALL exp 2025-11-14
│
│ 💡 Trade - Monitor entry timing
│ ⚠️ Risk: Close below $127.50 negates setup
└───────────────────────────────────────────────────────────────────────────────
┌─ #2 ✅ NASDAQ:SOFI • Score: 62/100 • ENTER NOW
│
│ 📅 DTE: 14 days
│ 🟡 Risk Level: Medium Risk (4/10)
│
│ 📰 Catalyst: -60% imbalance often precedes short squeeze in small/mid caps
│ 📊 Setup: High liquidity despite selling pressure, potential reversal candidate
│ 🎯 Target: $29.50-30.25 within 4 days
│ 📈 Options: $28 CALL exp 2025-11-21
│
│ 💡 Trade - Monitor entry timing
│ ⚠️ Risk: Breakdown below $26.80 invalidates momentum
└───────────────────────────────────────────────────────────────────────────────
────────────────────────────────────────────────────────────────────────────────
📖 QUICK GUIDE:
✅ ENTER NOW → High probability setup, optimal timing, low-medium risk
⏸️ WAIT → Monitor for better entry or catalyst resolution
🟢 Low Risk → Heat 1-3 (stable, far from catalysts)
🟡 Med Risk → Heat 4-6 (moderate volatility)
🔴 High Risk → Heat 7-10 (near catalysts, high volatility)
Image
💎 Position Sizing: 2-5% per trade • Max 2-3 concurrent positions
🎯 Exit Strategy: Take profit at 50% max gain or stop at 2x loss
════════════════════════════════════════════════════════════════════════════════

QQQ Bearish Pullback: Retest Toward 590–595 ZoneQQQ on the 1D chart has been trending higher for months, but the latest session printed a clean Bearish Engulfing with a ~1.86% drop and a break below the 20-day (around 614.50). That rejection left fresh supply near the recent high at 635 and flipped 610–615 into near-term resistance. Momentum has shifted short-term to the downside even as the broader structure remains bullish.
Primary path: a corrective leg toward the 590–595 demand zone. That area aligns with prior polarity and the 60-day moving average, with the lower Bollinger Band near 588 adding confluence. A sustained break below 610 would likely unlock that move, where buyers can attempt to stabilize price and rebuild trend structure.
Alternative: if buyers reclaim 622 on a daily close, the bearish signal is invalidated and the door reopens for a retest of 635. Conversely, if 590 fails decisively, the correction can extend toward the 120-day region around 570–575, signaling a deeper, medium-term reset.
This is a study, not financial advice. Manage risk and invalidations

QqqI think this channel holds gap has been filled . rsi is oversold on the 1 hr bought calls here and hedge with puts just in case . If support fails I think it goes to 600

QQQ : Stay heavy on positionsQQQ : Stay heavy on positions (QLD, TQQQ)
Entering a risk-on, high-volatility zone.
A signal for catching a bounce has emerged.
In stay light on positions zones, I hold QQQ and reduce exposure.
In stay heavy on positions zones, I increase allocation using a mix of QLD and TQQQ.
** This analysis is based solely on the quantification of crowd psychology.
It does not incorporate price action, trading volume, or macroeconomic indicators.

QQQ Controlled ShakeoutPrice pulled back right to the midpoint of its rising channel
The daily pivot (P) at ~$618.8 is being tested & that’s nearly identical to the 4H VWAP from the 10 October low
This area has been a launchpad several times in the past (late July & early October)
QQQ is at a major confluence of support & the channel midline, daily pivot & 20d MA all meet around here
As long as price stays above $618-$615, we’re still within a bullish retracement phase
Only below $600 would it flip to a genuine correction
Daily volume (~63M) is above average, showing active rotation, not liquidation
That’s consistent with funds taking profits near the channel top & adding back near support
RSI has cooled from ~70 to ~50
Stochastic already oversold
No bearish divergence on the daily timeframe - meaning trend structure is still intact
Momentum is resetting inside an uptrend; historically, a buyable dip setup
1. Base & Bounce
Hold $615-$620, reverse off oversold RSI
~60 %
Revisit $633-$637 (R1)
2. Range Extension
Choppy hold $615-$625
~25 %
Rebuild base before next leg
3. Breakdown
Lose $615 on volume
~15 %
Drop toward $600 (S1)
The daily chart confirms this is a trend pullback to major support, not a structural break
The $618-$615 area is pivotal since holding here likely produces a reflex rally toward $633-$637 (R1)
Only a daily close below $600 would invalidate the broader bullish trend channel
Both AMD & PLTR actually had decent numbers with solid growth, upbeat commentary & yet both stocks faded after the initial pop
That tells you the market has moved into a digestion/valuation reset phase, where earnings beats are already priced in
Funds are trimming positions to lock in Q4 gains
Buyers are demanding cheaper entry points, not chasing momentum
Fundamentals are fine, but sentiment is stretched & the market is rebalancing risk, not reacting to data
QQQ is ~50% weighted in 5 mega-caps (AAPL, MSFT, NVDA, AMZN & GOOG)
AMD (~1.5%) & PLTR (~0.3%) just don’t have the muscle to offset broad weakness in those heavyweights
AAPL & MSFT; for instance, have both seen post-earnings drift lower & that alone outweighs the total impact of AMD+PLTR’s strength
Even if AMD had ripped +10%, QQQ might’ve barely budged unless NVDA or MSFT joined in - my working hypothesis from last week
QQQ was extended at $637 & has reverted right to the trendline
Until it bases near $615-$620 & rebuilds momentum, positive catalysts won’t “stick”
The “risk-on” rotation will need confirmation likely through NVDA earnings (19 November), gov't reopening, or cool CPI print before institutions chase tech again
Yields down helps valuation, but not enough to spark inflows when everyone’s already overweight tech
VIX still ~19-20 indicates lingering hedging pressure
Funds are rotating into laggards (industrials, small caps) temporarily - not abandoning risk entirely, just diversifying exposure
This is sector rotation after a long tech-led run
Short term (1-3 days)
Choppy base-building near $615-$625
RSI/Stoch flattening, VIX <18.5
Medium term (1-2 weeks)
Grind higher into mid-November
NVDA earnings or soft CPI reignites momentum
Risk zone
Close <$610
Triggers momentum sell programs toward $600-$602
AMD & PLTR didn’t lift QQQ not because they failed, but because the market isn’t rewarding good news right now - it’s recalibrating positioning after a strong run
The tape still looks like a sector rotation, not a risk-off event
Once this consolidation burns off, QQQ can re-challenge $635-$640; likely, on a catalyst with broader weight (NVDA or macro)

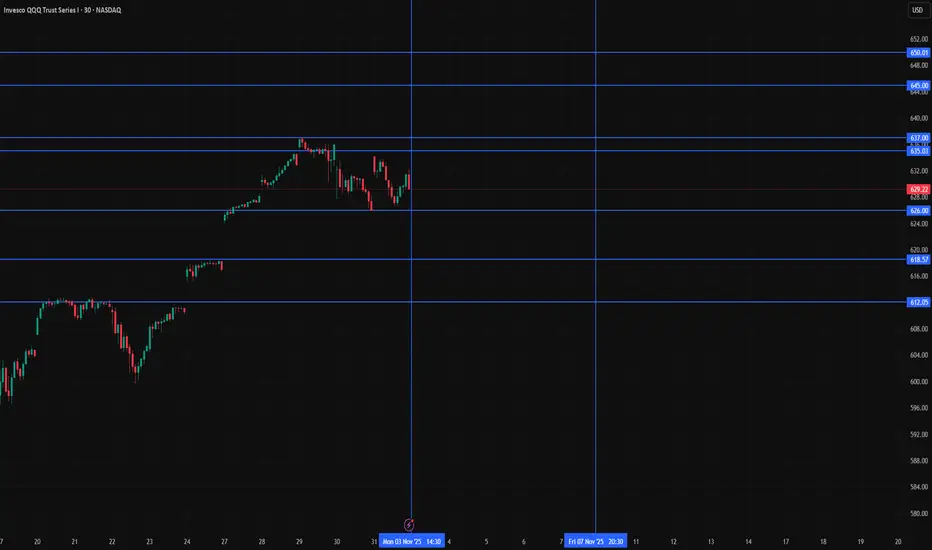
QQQ Weekly Map 3–7 Nov 2025Context
QQQ finished the week near the highs after a steady October climb. Buyers keep absorbing every shallow pullback. This week sits on two hinges. First, jobs and services data that nudge yields and implied vol. Second, a small cluster of tech earnings that can rotate leadership inside semis and handsets. The plan is simple. Let the market prove strength above the record band or let it pull back into patient demand. You will trade the reaction, not the forecast.
Chart setup
Use a one hour chart. Add 20 and 50 EMAs, a daily VWAP with bands, and the previous week high and low. Keep plots at global scope and turn lookahead off. Display VIX on a small separate pane for bias only.
Levels that matter
• 637.01 is the record high and the top of the current band
• 635 to 637 is the breakout ridge where wicks happen first and real holds happen later
• 629 is the Friday close reference for gap work on Monday
• 626 is last week’s first shelf where buyers defended cleanly
• 620 is a round shelf with memory from October
• 612 is the mean reversion area that often aligns with short term moving averages
• 597 is the bigger trend check where the intermediate crew steps in
How to read the week
Imagine a door at 637. When price opens that door and stays inside the new room for a while, trend traders have permission. If price knocks and gets rejected, range traders take the other side. If price steps down into 620 to 612 while volatility stays tame, that is where you seek bounces with tight risk. Your confirms are simple. VIX under the upper teens is friendly. Yields not jumping is friendly. If either flips, you slow down.
Three rules only
• Rule 1. Momentum only above the ridge. If cash breaks and holds above 637 for at least thirty minutes, take a starter. First target 645, stretch 650. Invalidate on a clean loss and thirty minute close back inside 635.
• Rule 2. Buy the dip into 620 to 612 only if volatility stays calm. Enter in the 620 to 612 pocket when VIX stays below your upper guardrail. Manage a first target 620 to 626 and trail. Invalidate on a decisive thirty minute close under 609 to 610.
• Rule 3. Risk first below 597. If the week forces a daily close below 597, treat it as a trend health check. Reduce gross and net and wait for a reclaim before trying to be a hero.
Why this works
One instrument. One band at the highs. One pocket for mean reversion. You are not predicting the data. You are pricing the reaction at the lines the market already respects. Breakout failures happen and that is fine because your hold filter removes most traps. Dips fail too and that is fine because your volatility guardrail removes the worst ones.
Intraday guide
• Morning plan. If we gap up into the ridge, let the first thrust exhaust and demand the hold. If we gap down toward 626, let the opening range print and only act after the first pullback.
• Midday plan. If price is inside 629 to 635 around lunch, expect chop. Trades there are optional.
• Afternoon plan. If the day is trending, trail behind a five minute reclaim of your entry line.
Risk and heat
Set maximum portfolio heat per idea at one half of one percent. Scale entries in thirds. Respect your stop even when it feels unfair. A string of small scratches is the tuition for the one clean runner that pays for the week.
Earnings and calendar awareness
AMD and Qualcomm after the close on Tuesday and Wednesday can swing semis and handsets. Shopify and Airbnb bookend consumer tone. The first week of the month carries ADP, services PMIs, ISM services, and payrolls. Do not guess the print. Trade the reaction at the levels on your chart. If VIX jumps before data, size down and wait for the dust to settle.
Cross checks
• If the ten year sits near recent levels or drifts lower, multiples breathe and the 637 break has better odds
• If VIX pins below the upper teens, dips are easier to buy
• If one of these flips, you slow down and treat the day like a range
Reminder
Education and analytics only. No advice. No guarantees. Process beats prediction.
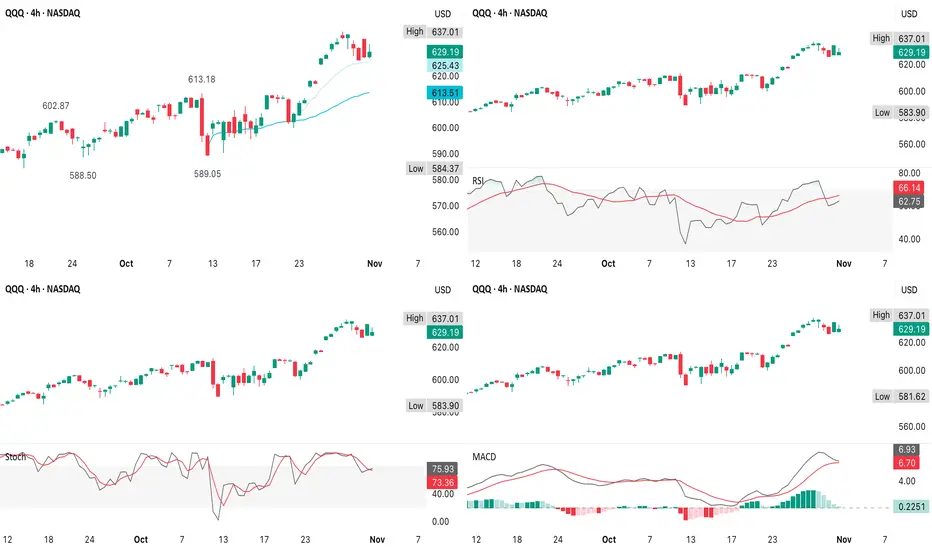
QQQ Generals (AAPL, MSFT & NVDA)Each stock is in a primary uptrend, but with slightly different phases of momentum - you’re seeing a bit of divergence among the “QQQ generals,' which is important
AAPL
Grinding higher, above 50d MA & within upper Bollinger band
Still trending, but upper wicks = supply around $275-$277; likely digestion area
MSFT
Pullback from $555 to ~$520 after new highs
Healthy retrace toward 50d MA so watch for higher low near $510-$515
NVDA
Leading - broke out above prior $195 resistance, holding gains
Most bullish of the 3; small-bodied candle near top = consolidation before next leg
All 3 show small bodies with upper wicks, meaning buyers pushed early, but met resistance - a pause, not yet reversal
No major bearish engulfing or heavy volume sell candle which suggests profit-taking, not panic
RSI
AAPL ~62 - mid-uptrend, not overbought
MSFT ~56 - cooling, but healthy
NVDA ~56 - steady strength
RSI readings between 55-65 indicate trend continuation (no exhaustion yet)
Stochastic
AAPL/NVDA are curling up - supports continuation
MSFT dipped, possibly a near-term bottom forming
Watch for cross-ups below 20 for next entry cues
MACD
AAPL is still positive, slight flattening = momentum pause
MSFT is bearish crossover forming (watch histogram near zero)
NVDA is bullish crossover confirmed - strongest setup technically
Volume Profile
AAPL is slight uptick but not blow-off
MSFT volume surge on red candle - likely earnings reaction fading
NVDA high participation, but stable = institutions still active
AAPL
Above $270 = breakout continuation
Bullish consolidation
Watch for breakout >$277 or retest
~$258 support
MSFT
Needs hold >$515 to avoid deeper pullback
Neutral–Bullish (short-term digestion)
Accumulate on $510 retest if RSI holds >45
NVDA
Above $200 breakout zone; $212 = extension target
Bullish
Buy-the-dip setup above $188-$190 (AVWAP support)
Consolidation phase likely early next week, with NVDA likely to resume leading QQQ higher if $200-$202 holds
QQQ remains in a strong uptrend, trading above the 50d MA & well above the 200d MA
After an earnings rally (AAPL, AMZN, META) it pulled back slightly, but hasn’t broken support - meaning the trend is intact, but stretched
The chart resembles a bullish pennant/flag forming just below the prior high (~$637-$640)
Tight consolidation after a vertical rally = continuation potential
Friday's small real body, upper wick - suggests sellers faded late-day strength, but not heavy distribution
Strong breakout candles with solid volume confirm institutional accumulation
So far, more of a rest bar than reversal bar
Healthy momentum - RSI could cool near 60 without breaking trend
MACD shows momentum slowing, not reversing
Watch for histogram tick-up after 2-3 quiet days (potential signal for next leg higher)
Stochastic curling down from overbought (80-90)
Short-term pause likely, but still bullish mid-term unless it dips below 40
Volume was high during breakout (post-earnings), but tapered during the pullback - classic bullish pattern
No sign of distribution selling yet
Holding above $620 keeps the bull case fully intact & a breakout above $640 opens potential for $655-$665 targets (measured move from flag)
AAPL neutral-bullish = confirming broad tech strength
NVDA leading = risk-on sentiment still strong
MSFT softening = brief digestion phase; not yet dragging the index
VIX near cycle lows, TNX (yields) easing - macro tailwinds for growth stocks
AAPL, AMZN, META, MSFT & TSLA have already reported strong earnings, so now semiconductors & AI names like AMD & PLTR become the next catalysts
With NVDA earnings not until 19 November, AMD’s report Monday night effectively becomes a read-through for the AI/semiconductor complex, which heavily affects QQQ
Best-case for bulls is a strong AMD report = renewed AI momentum - QQQ clears $640 resistance
QQQ QuantSignals V3 0DTE 2025-11-01QQQ QuantSignals V3 0DTE 2025-11-01
QQQ 0DTE Signal | 2025-11-01
• Direction: BUY PUTS | Confidence: 65%
• Expiry: 2025-11-03 (same-day)
• Strike Focus: $626.00
• Entry Range: $4.60
• Target 1: $9.00
• Stop Loss: $2.25
• Gamma Risk: Low
• Flow Intel: Bearish (High P/C Ratio) | PCR 3.95
• Price vs VWAP: -0.16%
• ⚠️ MODERATE RISK WARNING: Consider reducing position size due to moderate confidence level.
⚖️ Compliance: Educational 0DTE commentary for QS Premium. Not financial advice.
🎯 TRADE RECOMMENDATION
Direction: BUY PUTS
Confidence: 65%
Conviction Level: MEDIUM
🧠 ANALYSIS SUMMARY
Katy AI Signal: NEUTRAL with 50% confidence - The AI shows no clear directional bias, making this a cautious play based on secondary indicators rather than strong AI conviction.
Technical Analysis: Price at $629.05 is below VWAP ($630.07, -0.16%), session change down -0.46%, and trading in a tight range ($626.69-$633.75). Low volume (0.0x average) suggests weak participation, potentially unreliable signals. BREAKOUT SETUP detected could lead to explosive move.
News Sentiment: Mixed but leaning positive with Nasdaq 100 rebound, Amazon up 10% on earnings, and Wall Street entering strongest month historically. However, these are background catalysts (27+ hours old) with limited immediate impact.
Options Flow: STRONGLY BEARISH - Put/Call Ratio of 3.95 indicates heavy put buying, unusual activity at $654 put strike. Max pain at $620.00 (-1.4% from spot) suggests downward pressure. Gamma risk low, allowing for cleaner moves.
Risk Level: MODERATE-HIGH - Katy AI neutrality combined with low volume creates uncertainty. Strong put flow provides counterbalance to mildly positive news backdrop.
💰 TRADE SETUP
Expiry Date: 2025-11-03
Recommended Strike: $626.00
Entry Price: $4.50 - $4.70
Target 1: $9.00 (100% gain from entry)
Target 2: $13.50 (200% gain from entry)
Stop Loss: $2.25 (50% loss from entry)
Image
QS Analyst
APP
— Yesterday at 8:47 PM
Position Size: 2% of portfolio
⚡ COMPETITIVE EDGE
Why This Trade: Strong institutional put flow (PCR 3.95) outweighs Katy's neutral signal, providing edge against retail sentiment. Max pain at $620 suggests gravitational pull downward.
Timing Advantage: Afternoon session (1:30-4:00 ET) offers gamma ramp opportunities with tight stops. Current price below VWAP supports bearish momentum continuation.
Risk Mitigation: Conservative delta selection (-0.4 to -0.5 range), tight 50% stop loss, and small position size compensate for Katy AI's lack of directional conviction.
🚨 IMPORTANT NOTES
⚠️ Katy AI shows NEUTRAL 50% confidence - this trade relies heavily on options flow analysis rather than primary AI signal
⚠️ Low volume (0.0x average) may lead to erratic price action and false breakouts
⚠️ Recent positive earnings news (Amazon +10%) could create counter-trend rallies
⚠️ Monitor VIX (17.44, rising) for volatility spikes that could impact option pricing
📊 TRADE DETAILS 📊
🎯 Instrument: QQQ
🔀 Direction: PUT (SHORT)
🎯 Strike: 626.00
💵 Entry Price: 4.60
🎯 Profit Target: 9.00
🛑 Stop Loss: 2.25
📅 Expiry: 2025-11-03
📏 Size: 2.0
📈 Confidence: 65%
⏰ Entry Timing: N/A
🕒 Signal Time: 2025-11-01 23:47:35 EDT
⚠️ MODERATE RISK WARNING: Consider reducing position size due to moderate confidence level.
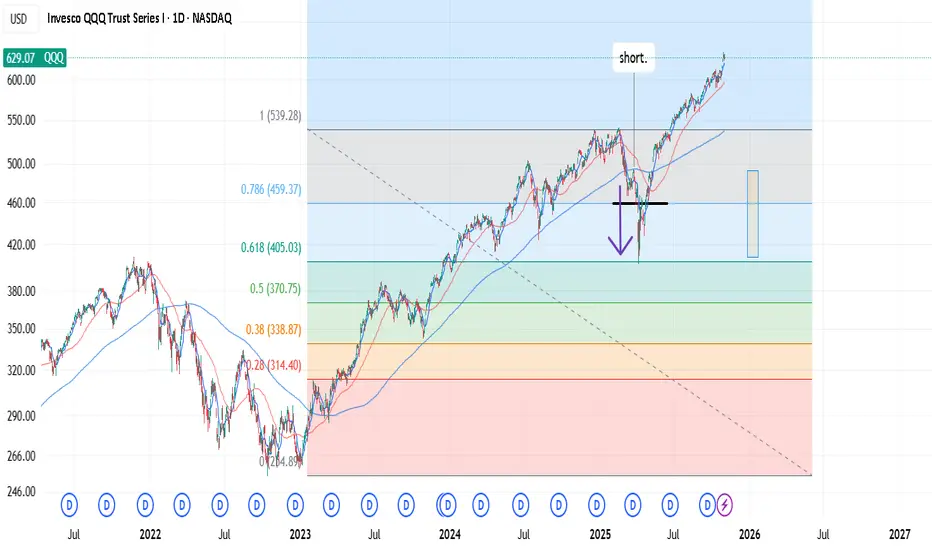
Fibonacci levels. Trading corrections.I saw a Lance B video saying that fibonacci is garbage that people use with a confirmation bias, and it doesn't work. (He says, anything besides the 50% FIB). His thesis is that fibonacci is a phenomenum from nature and at some point traders decide to test and apply it in markets.
I disagree. Using LOG trend, during corrections, prices respect the fib level ratio . It's math, more or less. I only trade tickers, if the moves are in the correlation with whole market (index). I also think, it's practical only on corrections, bear markets. 🤔
-> When the "key" level breaks, it tests the next level . Which isn't practical due to high variance.
-> which means, you build the shorts during last resistance . Where market forces pull over. (50dma death cross as a force).
(Your hedge is the inertia from 50dma DC).
I think this is a cool, powerful setup to keep it mind. 👏
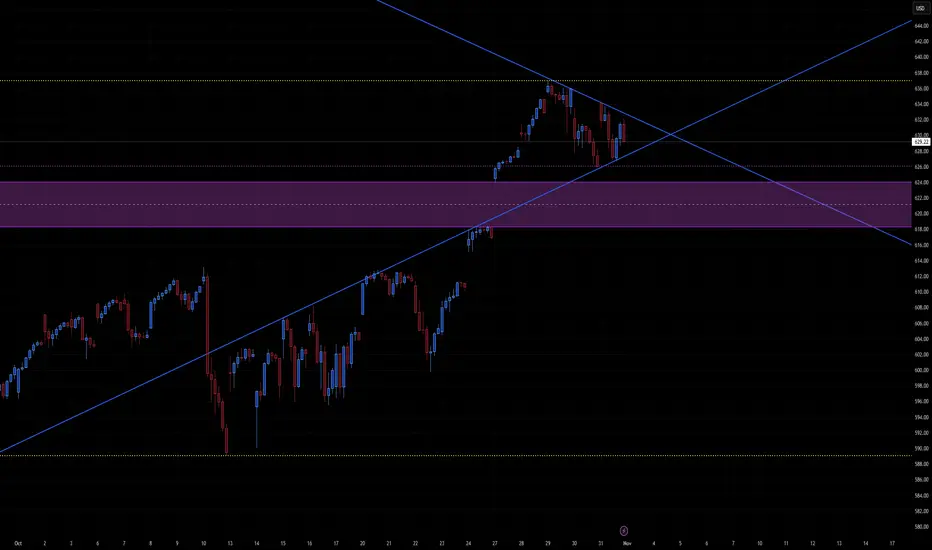
QQQ forming a symmetrical wedge with move coming soonThe chart for QQQ (NASDAQ 100 ETF) shows:
Converging trendlines forming a symmetrical triangle (lower rising trendline from mid-October and upper descending from recent highs).
Primary support zone in 618–626 range (highlighted purple region).
Key horizontal resistances near 629–632 and 638–640.
This structure signals an upcoming volatility squeeze — likely breakout or breakdown soon (within 1–2 weeks).
📈 Bullish Case
Setup:
QQQ is currently near 629, just below the descending resistance line. Bulls will want a clean breakout and hold above it.
Confirmation Triggers:
Break and daily close above 632–634 (above triangle and resistance).
Follow-through volume expansion confirming institutional buying.
Short-term Targets:
638–642 → First resistance zone (top of recent swing highs).
650–654 → Measured move from the triangle (~+3–4%).
660–664 → Extended move if macro tailwinds continue (NVDA/MSFT strength, yields drop, etc.).
Bullish Catalysts:
Softer inflation or dovish Fed signals.
Tech-led earnings beats.
Breadth improvement in NASDAQ components.
Invalidation:
Rejection from 632 with breakdown under 624 (back into purple zone).
📉 Bearish Case
Setup:
Rejection from upper triangle boundary near 630–632, followed by a breakdown through rising trendline support.
Confirmation Triggers:
Break and daily close below 622–620 (support zone and ascending trendline).
Weak rebound attempts with lower highs near 626–628.
Short-term Targets:
610–614 → Initial drop target (bottom of structure).
595–598 → Major prior demand zone (matches yellow dotted horizontal line).
582–585 → Extended bearish target if broader market correction accelerates.
Bearish Catalysts:
Sticky inflation, higher yields, or hawkish Fed tone.
Tech sector profit-taking.
Risk-off sentiment spillover from macro headlines.
Invalidation:
Sustained breakout above 634–636 with heavy volume.
⚖️ Neutral Scenario
Currently, QQQ is consolidating between 620 and 632, forming higher lows but lower highs.
Until one side breaks decisively, expect range trading and false breakouts within this triangle.
The apex of the triangle sits around Nov 5–7, implying a move should materialize within ~1–2 weeks.
🧩 Summary Table
Bias Confirmation Short-Term Target Stop / Invalidation Notes
Bullish Close > 632–634 638 → 650 < 624 Breakout from triangle
Bearish Close < 620–622 610 → 595 > 634 Breakdown from wedge
Neutral Range 620–632 — — Coil ahead of breakout
🕒 2–3 Week Projection
Bullish Path: Consolidate 626–632 → Breakout mid-next week → Rally to 640–650 by mid-Nov.
Bearish Path: Fail at 630 → Breakdown below 620 → Slide toward 600 by mid-Nov.
Stock Market Forecast | TSLA NVDA AAPL AMZN META MSFTStock Market Forecast | CME_MINI:NQ1! CME_MINI:ES1! NASDAQ:NDX SP:SPX
Mag 7 | TSLA NVDA AAPL AMZN META MSFT GOOGL

QQQ (31 October) QQQ’s consistent alignment above the 50d MA since May confirms an established primary uptrend
Each time QQQ has pulled back toward or slightly below the midline, it’s rebounded - a classic envelope rhythm
The current setup favors rotation or sideways digestion rather than reversal, unless price breaks below $600 decisively
QQQ is extended, so a brief pause or small pullback wouldn’t invalidate the uptrend
QQQ is testing the upper +3% boundary - a region that often acts as a momentum area in a healthy uptrend
Sustained trading above that upper band would indicate a very strong bull phase (think “trend expansion”)
A drift sideways or small pullback to the midline (~$610-$615) would be perfectly normal
1. Strong Uptrend, Well-Contained in Channel
The price has been trending cleanly above its midline (50d MA) since May
The shaded envelope shows QQQ hugging the upper band, which typically signals trend strength, not exhaustion; unless, it flattens and price rolls over
2. $629-$637 Resistance Cluster
This is a psychological round number zone & aligns with the measured handle breakout level from the 4H chart
A few consecutive candles stalling just under the top band implies controlled profit-taking, not heavy selling
3. Structure Suggests “Bull Flag on the Daily”
The shallow pullback around $589, $620 to $637 has flag-like proportions
If QQQ holds above $620 into early next week & breaks $637 with volume, it would confirm a bullish continuation pattern
$637 + ($637 – $589) ≈ $685-$690 medium-term
4. Momentum
The trend’s slope has accelerated since early October; often, a late-stage trend characteristic, but there’s no clear topping structure
RSI (4H chart) is near 66, meaning there’s still room before overbought extremes on the daily frame
Bullish Continuation
Break & close >$637
Strong QQQ/tech rally post-FOMC & Trump-Xi
$660–$685
Sideways Hold
$620–$637 range holds
Consolidation before next leg
Neutral to bullish bias
Bearish Pullback
Daily close <$620
Short-term correction to 50d MA (~$612)
$600-$610 support
The daily and 4H trends are aligned bullishly with consolidation just below last week's highs & catalysts (FOMC, Trump–Xi & earnings) is healthy
If macro tone is calm or dovish, odds favor a November breakout leg
QQQ: Weak Market & Bearish Forecast
Balance of buyers and sellers on the QQQ pair, that is best felt when all the timeframes are analyzed properly is shifting in favor of the sellers, therefore is it only natural that we go short on the pair.
Disclosure: I am part of Trade Nation's Influencer program and receive a monthly fee for using their TradingView charts in my analysis.
❤️ Please, support our work with like & comment! ❤️

Qqqback inside channel no reason why it would go up china trade deal was already priced in I think we fill gap 612 before the deal is announced stop loss if it goes above channel again. meta and nflx alone if they cross bearish on the monthly they both weight about 6% on Qqq
How Currency Valuations Impact Exporters and ImportersIntroduction
Currency valuation is one of the most powerful forces shaping global trade dynamics. Every day, trillions of dollars’ worth of goods, services, and investments cross borders, and the exchange rates between currencies determine how much value each participant gains or loses. A small shift in the rupee, dollar, euro, or yen can have a massive impact on exporters’ earnings, importers’ costs, and even a country’s overall trade balance.
For exporters and importers, understanding currency valuation is not just a financial technicality — it is a survival strategy. Whether a company sells machinery to Europe, imports raw materials from China, or outsources services to the U.S., fluctuations in exchange rates directly affect profitability, competitiveness, and strategic planning.
This essay explores how currency valuations influence exporters and importers, the mechanisms behind exchange rate movements, their implications on pricing, profitability, and policy decisions, and how businesses can manage the risks associated with currency fluctuations.
Understanding Currency Valuation
Currency valuation refers to the market-determined worth of one currency relative to another. It is usually expressed as an exchange rate — for example, ₹83 per U.S. dollar means that one dollar can be exchanged for 83 Indian rupees.
Exchange rates fluctuate due to a combination of factors such as:
Inflation differentials
Interest rate variations
Trade balances
Foreign investment flows
Central bank policies
Market speculation
When a currency appreciates, its value rises compared to others, meaning it can buy more foreign currency. When it depreciates, it loses value, meaning more domestic currency is needed to buy the same amount of foreign currency.
These movements, while often subtle on a daily basis, can have profound effects on international trade.
Impact on Exporters
Exporters earn revenue in foreign currencies but often bear costs in their home currency. Therefore, currency depreciation usually benefits exporters, while currency appreciation tends to hurt them. Let’s explore both situations.
1. Currency Depreciation: A Competitive Advantage
When a country’s currency depreciates, its goods and services become cheaper in foreign markets. For example, if the Indian rupee weakens from ₹75 to ₹85 per U.S. dollar, an American buyer can now buy more Indian products for the same amount of dollars.
This creates several benefits for exporters:
Price Competitiveness: Products appear cheaper abroad, boosting demand.
Higher Profits: Exporters earn more in domestic currency when converting foreign sales revenue.
Market Expansion: Depreciation can help penetrate new markets or outcompete suppliers from stronger-currency nations.
For instance, India’s textile and IT service exporters often benefit when the rupee weakens against the dollar. Their revenues in dollars translate into higher rupee earnings, improving margins even if prices remain constant.
2. Currency Appreciation: A Profit Squeeze
When a domestic currency strengthens, exporters face a dual challenge:
Their products become more expensive for foreign buyers, reducing competitiveness.
Their foreign revenues shrink in domestic terms.
For example, if the rupee appreciates from ₹85 to ₹75 per dollar, the same $1 million export sale now converts into ₹75 million instead of ₹85 million — a clear loss in rupee terms.
Unless exporters hedge their exposure or increase prices (which may hurt demand), their profit margins shrink significantly.
Industries that rely heavily on exports — such as automobiles, textiles, or pharmaceuticals — are particularly sensitive to such changes.
3. Long-Term Effects on Export Strategy
Persistent currency appreciation can force exporters to rethink their strategy:
Shift production abroad to reduce currency exposure.
Focus on higher value-added goods where price sensitivity is lower.
Increase use of financial hedging instruments.
On the other hand, a consistently weak currency can encourage export-led growth but might raise inflation due to costlier imports (like energy or components).
Impact on Importers
Importers face the opposite situation. They pay for foreign goods and services in foreign currencies but sell them domestically in their local currency. Hence, currency appreciation generally benefits importers, while currency depreciation hurts them.
1. Currency Appreciation: Lower Import Costs
When the domestic currency strengthens, importers gain purchasing power. They can buy more goods from abroad for the same amount of domestic currency.
For example, if the rupee appreciates from ₹83 to ₹78 per dollar, a $10,000 machine from the U.S. costs ₹7.8 lakh instead of ₹8.3 lakh.
The benefits include:
Reduced Import Costs: Lower costs for raw materials, equipment, or finished goods.
Lower Inflation: Cheaper imports can reduce overall price pressures in the domestic economy.
Improved Margins: Importers or retailers can either lower their selling prices or increase profit margins.
Industries such as electronics, oil, and automobiles — which rely heavily on imports — often welcome currency appreciation.
2. Currency Depreciation: Costly Imports
Depreciation has the opposite effect. The domestic currency buys fewer foreign goods, increasing import costs.
For example, if the rupee depreciates from ₹83 to ₹88 per dollar, that same $10,000 machine now costs ₹8.8 lakh.
This can lead to:
Higher Input Costs: Import-dependent manufacturers face rising costs of raw materials or components.
Inflationary Pressure: Costlier imports can push up consumer prices, especially for fuel or food.
Profit Margin Squeeze: Importers may struggle to pass higher costs to consumers, hurting profitability.
A prolonged depreciation phase can thus make it difficult for import-driven sectors like energy, technology, and healthcare to maintain stable pricing structures.
Exchange Rate Pass-Through: Linking Valuation to Pricing
The concept of exchange rate pass-through (ERPT) explains how much of the currency movement is reflected in the final price of goods.
Full Pass-Through: Exporters/importers adjust prices completely in line with exchange rate changes.
Partial Pass-Through: Companies absorb part of the exchange rate impact to remain competitive.
For example, if the rupee weakens 10% but an exporter only raises prices abroad by 5%, the remaining 5% is absorbed in margins.
The degree of pass-through depends on market conditions, demand elasticity, and brand power. Highly competitive markets (like garments) show low pass-through, while niche products or monopolistic services show higher pass-through.
Case Examples
1. Indian IT and Pharmaceutical Exporters
When the rupee depreciates, these sectors thrive because they earn in dollars but spend in rupees. During 2020–2023, rupee weakness benefited companies like Infosys, TCS, and Sun Pharma, improving operating margins despite global volatility.
2. Oil and Gold Importers
India imports most of its crude oil and gold. When the rupee weakens, import bills rise sharply, widening the current account deficit and creating inflationary pressure. This shows how currency valuation directly influences macroeconomic stability.
3. Japanese Yen and Export Competitiveness
Japan has long relied on a weak yen to maintain export competitiveness in automobiles and electronics. When the yen strengthens sharply, companies like Toyota or Sony face reduced foreign earnings, prompting shifts in production to other regions.
Macroeconomic Implications
1. Trade Balance Effects
Currency depreciation tends to boost exports and reduce imports, improving the trade balance. Conversely, appreciation may widen trade deficits.
However, the J-Curve effect suggests that after depreciation, the trade deficit may initially worsen (as import bills rise before export volumes adjust) before eventually improving.
2. Inflation and Interest Rates
A weaker currency can stoke inflation through higher import costs, prompting central banks to raise interest rates. A stronger currency can have a disinflationary effect, allowing for looser monetary policy.
Hence, exporters and importers must watch not just exchange rates but also central bank reactions.
3. Investment Flows
Stable currency values attract foreign investment, while volatile or overvalued currencies deter it. Export-oriented economies like China and South Korea often manage currency levels strategically to maintain competitiveness.
Risk Management and Hedging Strategies
Given the volatility in currency markets, exporters and importers use various tools to manage risk:
Forward Contracts: Lock in future exchange rates to avoid uncertainty.
Options and Futures: Provide flexibility to benefit from favorable moves while limiting losses.
Natural Hedging: Matching foreign currency revenues and expenses (e.g., using dollar earnings to pay dollar liabilities).
Diversification: Expanding trade across multiple markets to reduce dependency on one currency.
A disciplined hedging strategy protects profit margins and ensures financial stability despite volatile exchange rates.
Policy and Central Bank Interventions
Governments and central banks often intervene in foreign exchange markets to prevent excessive currency swings.
Managed Float Systems: Authorities allow market forces to determine exchange rates but step in during volatility.
Reserve Management: Buying or selling foreign reserves to influence currency supply.
Export Incentives and Import Duties: Used to balance the impact of currency movements on trade sectors.
For example, the Reserve Bank of India (RBI) actively manages rupee liquidity to avoid sharp fluctuations that could harm exporters or spike import costs.
The Balance Between Exporters and Importers
While a weaker currency aids exporters, it hurts importers and raises inflation. Conversely, a stronger currency benefits importers and consumers but reduces export competitiveness.
Thus, an optimal exchange rate — not too strong, not too weak — is crucial. The goal for policymakers is to maintain stability rather than favor one side.
In the long run, productivity, innovation, and diversification are more sustainable sources of competitiveness than currency manipulation.
Conclusion
Currency valuation stands at the crossroads of global trade, linking the fortunes of exporters, importers, investors, and entire economies. A fluctuating exchange rate is more than a number on a financial screen — it is a reflection of economic strength, investor confidence, and trade competitiveness.
For exporters, a weaker domestic currency can mean opportunity; for importers, it can mean challenge — and vice versa. But those who understand the mechanics of currency valuation, hedge their risks, and adapt strategically can turn volatility into advantage.
In a globalized era, exchange rate literacy is as essential as market knowledge. Whether you’re shipping goods overseas or sourcing materials from abroad, managing currency exposure is not merely financial prudence — it’s the foundation of resilient international business.

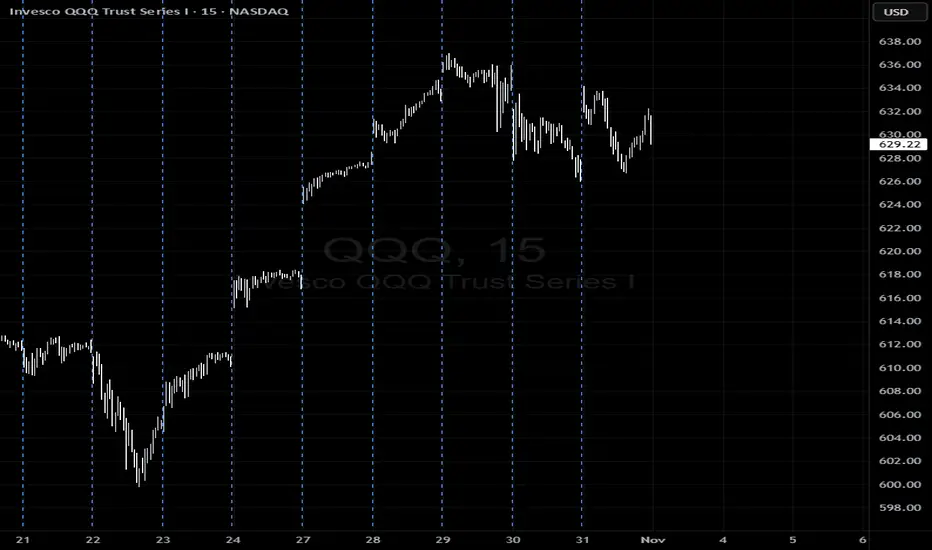
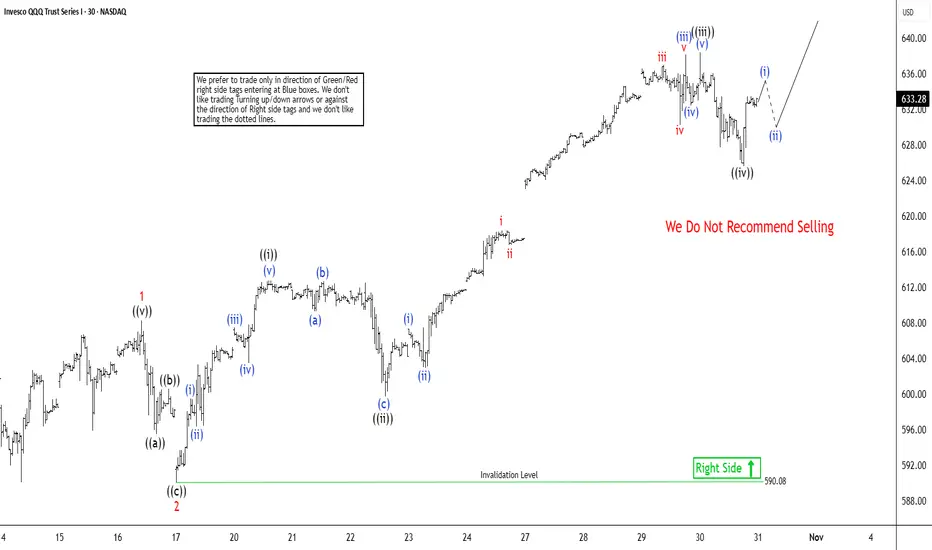
QQQ Bullish Formation Not Yet CompleteThe Invesco QQQ Trust (QQQ) just reached a new all-time high. This milestone highlights an incomplete short-term Elliott Wave structure. A clear five-wave impulse cycle continues to advance from the October 11, 2025 low. Wave 1 completed at 608.31. It gave way to wave 2, which dipped to 590.08. The 30-minute chart clearly shows this correction. From there, the ETF surged higher into wave 3.
Within wave 3, wave ((i)) peaked at 612.80. A brief wave ((ii)) followed and ended at 599.74. Price then accelerated upward in wave ((iii)), reaching 638.18. Wave ((iv)) corrected modestly to 625.61. One final push remains in wave ((v)). It should finish wave 3. After that, wave 4 will pull back. The ETF then resumes its climb in wave 5. This leg completes the full cycle from October 11.
The key pivot at 590.08 stays intact. Any dip should hold support in a 3-, 7-, or 11-swing area. Upside momentum resumes above this level. The upside target derives from the 123.6%–161.8% inverse Fibonacci extension of wave ((iv)). This projects a zone of 640.80–645.50. Once wave 5 tops, a more significant correction follows. For now, price action favors higher levels, so the path of least resistance stays upward as long as 590.08 holds.
QQQ BTD Meets Stellar Megacap EarningsBuyers are stepping right back in on strong fundamentals rather than waiting for a deeper pullback
1. Catalysts
AMZN
Cloud & ad segments both surprised to the upside, margins expanded sharply - that’s the kind of result that revives the “AI + consumer resilience” narrative
AAPL
Solid services growth and upbeat iPhone guidance, plus strong China sales commentary - markets read that as macro-resilient
Together, these two control nearly 18-20% of QQQ’s weighting, so their beats mechanically lift the ETF
2. Technical implication
Futures & post-market prints around +1% (≈$632 to $639) mean QQQ is already testing back above R3 ($630.9)
If that holds into tomorrow’s open, it neutralizes the bearish engulfing from earlier & confirms buyers defending the channel
RSI on the 4H will likely turn up again before it ever reaches 50 - a bullish reset without full mean reversion
3. Key levels overnight into tomorrow
$637-$640
Post-market top/resistance band
If it breaks & holds >$640, then momentum squeeze likely
$630-$632
Prior R3/now potential support
Buyers defending here = bullish continuation
$620-$625
Must-hold range if futures fade
Below $620 would reopen mean-reversion path
If futures fade back to ~$632 at open, that’s normal profit-taking - the key is whether the first dip gets bought quickly
This is classic “buy-the-dip meets stellar megacap earnings” behavior
Given the Fed pause backdrop & strong tech prints, the odds now tilt toward QQQ retesting ~$645-$650 before any new consolidation phase

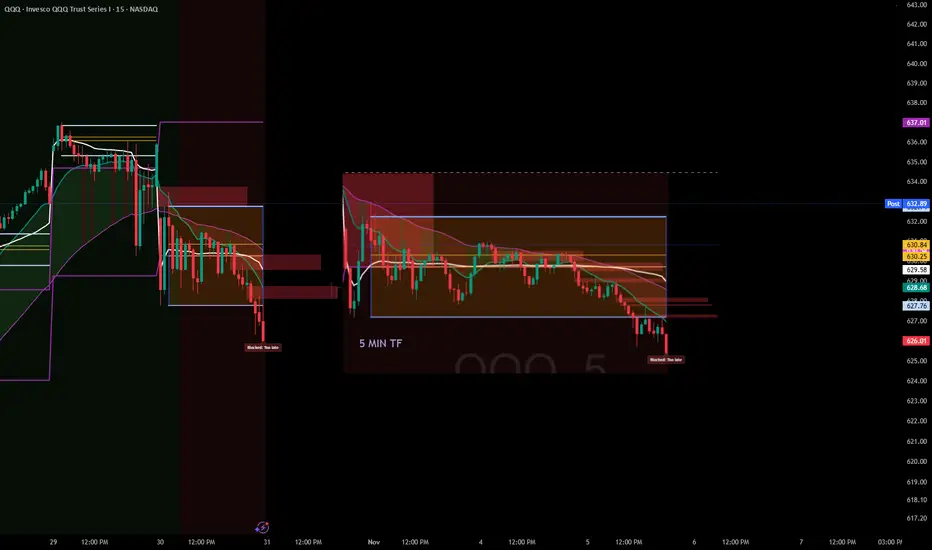
A Lesson in Patience and structure - ORB waited till 2pm todayFellow traders,
Today tested patience more than precision.
The morning was a maze — choppy price action, overlapping candles, and zero conviction. The ORB range between 9:30–9:45 never gave clean confirmation. Buyers held the low, sellers pressed the top, but neither could gain control. Every candle said, “not yet.”
Then came midday compression. From 11 AM to 1:30 PM, QQQ coiled tightly under the EMAs and VWAP. That silence wasn’t random — it was the market loading energy. The moment VWAP was lost for good, the floodgates opened.
Finally, around 2 PM, the breakdown came: a clean retest rejection of the ORB box and an accelerated drop through 629. The move I had been watching all day finally unfolded — only this time, discipline said don’t chase.
And that’s the point of today’s session.
Not every move is yours to catch. Sometimes your biggest win is not forcing a trade that forms too late or breaks your system’s timing window.
Patience is part of the strategy.
The setup played out exactly as it should — I just didn’t have to be in it to learn from it.
Stay disciplined. Stay sharp.
— Trades with B ⚡