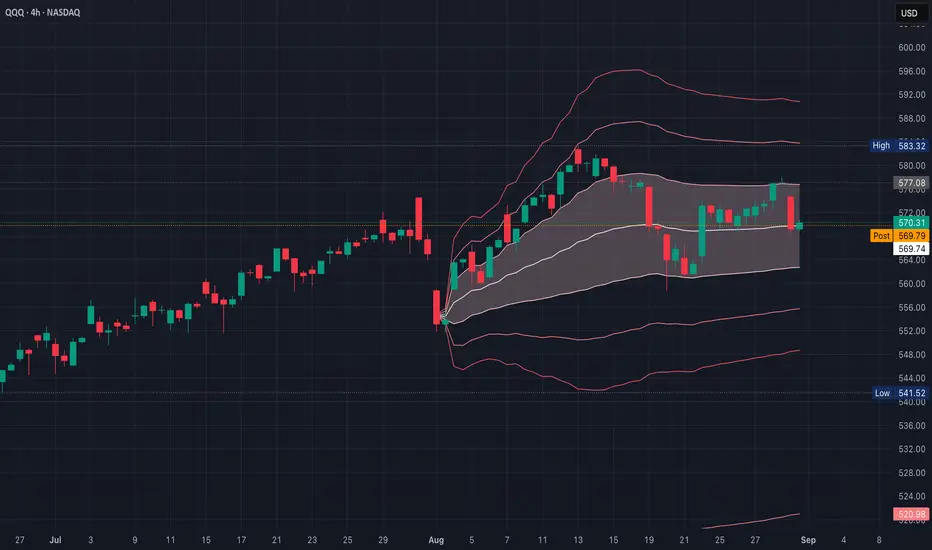
QQQ Potential Inflection PointSymmetrical triangle = compression where buyers keep stepping in higher, but sellers cap at lower levels
Often a continuation pattern, but it can break either way depending on volume + macro drivers
MACD just had a bearish cross earlier, but it’s trying to curl back up which suggests indecision & matches the triangle
RSI is holding mid-zone (~45) - not oversold, not overbought, again, neutral compression
In a proper symmetrical triangle, volume should decline as the pattern compresses
This shows traders waiting, fewer willing to commit inside the chop
That looks normal here (quieter trading into late August)
Volume must expand; otherwise it’s just a fake-out; ideally, RSI also breaks under ~40 & MACD diverges down
If price falls back inside the triangle on weak volume, it’s a false move
If price reclaims the ascending line quickly, it’s a bear trap
If the breakout candle volume is ≥150% of average, that’s confirmation
If price moves but volume stays weak, expect a possible reversal
Watch the first 15–30 min of volume after the break
If it’s a strong surge, odds favor continuation
If volume fades and price chops back inside the triangle, it’s likely a fake-out
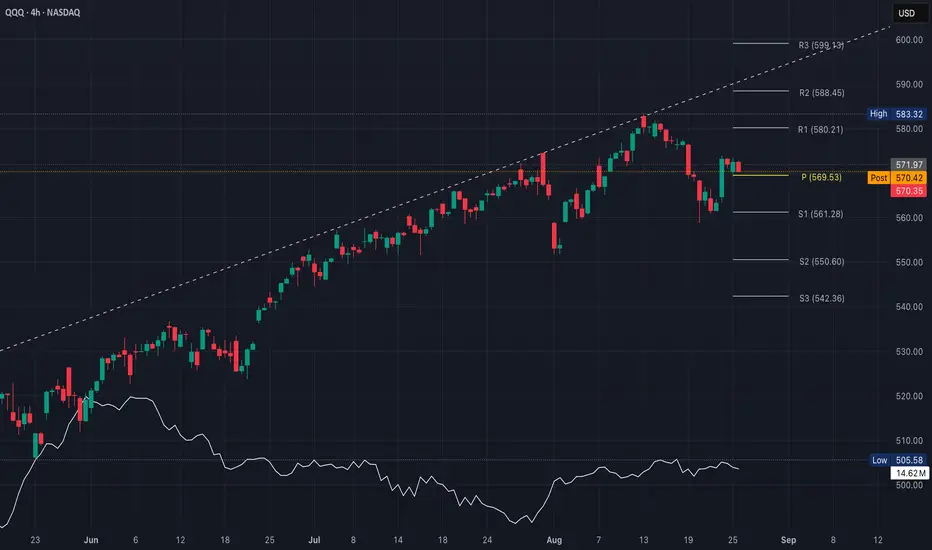
Price broke down through the ascending support trendline around ~$572, currently testing $570
Volume expanded on the breakdown candle which adds credibility to the move
If follow-through comes with continued above-average volume, it confirms the downside break
Triangle height is ~24 points (from ~$583 high to ~$559 low), so $570 – $24 = ~$546 (aligns with prior support from mid-August)
If volume continues to stay above 1.3M baseline & Tuesday closes weak, expect sellers to aim for ~$558 first (previous swing low) & then the measured move (~$546)
Direction = which line breaks (up/down)
Strength = whether volume surges beyond normal
Bulls need a fast reclaim of $572–$573 on strong volume; otherwise, bears keep control
QQQ trade ideas
QQQ Sellers In Panic! BUY!
My dear friends,
QQQ looks like it will make a good move, and here are the details:
The market is trading on 570.30 pivot level.
Bias - Bullish
Technical Indicators: Supper Trend generates a clear long signal while Pivot Point HL is currently determining the overall Bullish trend of the market.
Goal - 572.83
Recommended Stop Loss - 568.90
About Used Indicators:
Pivot points are a great way to identify areas of support and resistance, but they work best when combined with other kinds of technical analysis
Disclosure: I am part of Trade Nation's Influencer program and receive a monthly fee for using their TradingView charts in my analysis.
———————————
WISH YOU ALL LUCK
Is September For the Bears?QQQ CME_MINI:NQ1! CME_MINI:ES1! stock market Forecast
Nvidia Stock NASDAQ:NVDA Forecast
Apple Stock NASDAQ:AAPL Forecast
Microsoft Stock MSFT Forecast
Google Stock GOOGL Forecast
Amazon Stock AMZN Forecast
Meta Forecast Technical Analysis
Tesla Stock TSLA Forecast
Magnificent 7 stocks forecast

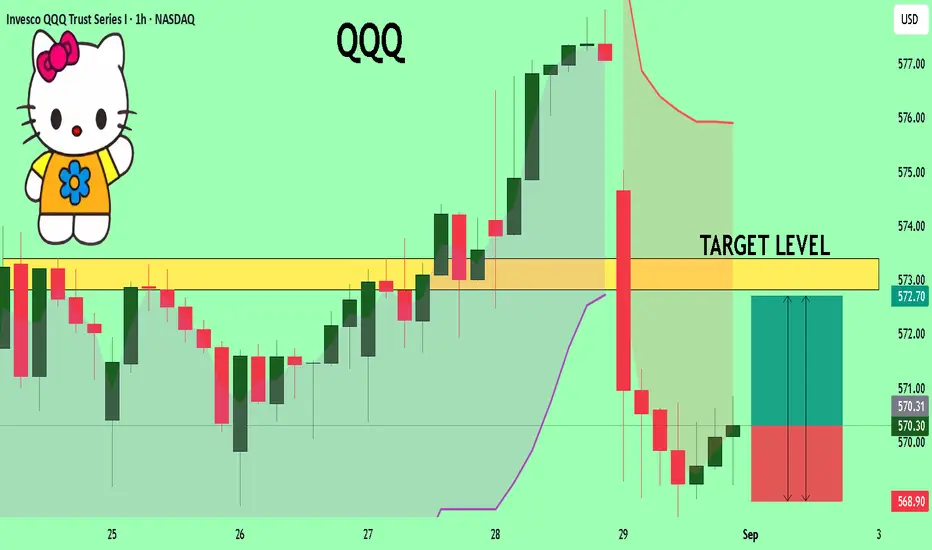
QQQ: Long Signal Explained
QQQ
- Classic bullish formation
- Our team expects pullback
SUGGESTED TRADE:
Swing Trade
Long QQQ
Entry - 570.32
Sl - 568.90
Tp - 572.98
Our Risk - 1%
Start protection of your profits from lower levels
Disclosure: I am part of Trade Nation's Influencer program and receive a monthly fee for using their TradingView charts in my analysis.
❤️ Please, support our work with like & comment! ❤️
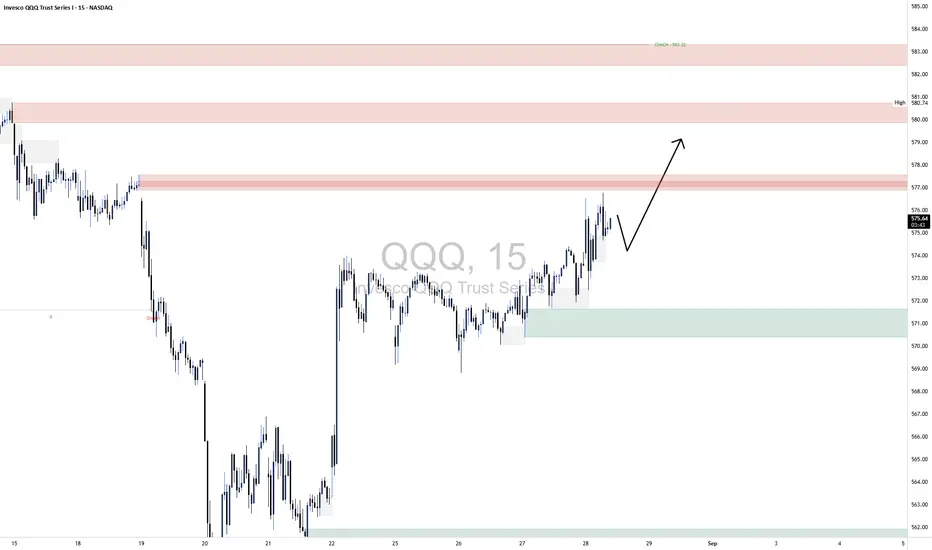
QQQ Read on the CandlesToday’s long red candle shows strong rejection, high conviction selling
Today’s 4H bounce at the center band looks more like technical support hold, not yet bullish reversal
So short-term the market is testing balance at $570
If it loses $570, downside continuation is favored
If it recaptures $576 quickly, squeeze potential kicks in
Trigger to watch is a daily close under $568, or weakness that can’t reclaim $570
QQQ (29 August)A strong red bar, almost full body, closing near its low - that’s a bearish marubozu-type candle (pattern signals a powerful downward price movement & suggests the continuation of a downtrend or a strong potential reversal from an uptrend), which means sellers in control
Prior small-bodied candles with upper wicks around $576–$578 look like stalling candles/spinning tops or indecision near resistance
Earlier in the bounce (21-27 August), a string of green candles climbing steadily - that’s a rising three method-style move (short-term bullish continuation/essentially a "bull flag" formation), but it has now broken with that big red bar
This looks like a bearish engulfing setup where the latest red candle completely wipes out several of the prior green candles’ progress, so it suggests buyers lost control at ~$576–$578 & momentum has shifted back to sellers
Signals 1–2 more red days unless quickly negated
The strong close near the lows suggests sellers want to press further right away (no bounce intraday)
If Tuesday continues below $570, that confirms the short-term breakdown
Near-term = bearish pressure (engulfing + strong close at lows)
Swing = risk of a retest of $564 to $558, unless buyers immediately step back in & reclaim $576
QQQ Pure LottoMomentum indicators (like stoch/RSI) are mid-range, so still room either way
The dominant developing pattern is an ascending triangle under $580
That favors a bullish breakout if buyers hold $574–$575
If ~$580 fails again, it flips into a short-term pullback
What we’ve seen since mid-August looks more like a round bottom recovery than an upside-down “U”
The “handle-like” action under $580 is tight & flat, not sloping down
That aligns more with an ascending triangle (bullish) than an inverted cup & handle (bearish)
If this were a true inverted cup & handle, expect a weak “handle” bounce that fails near resistance before rolling over
However, the bounce off $559 hasn’t been shallow; instead, price has climbed into a rising channel
That channel is more characteristic of a bearish rising wedge than a handle
Rising wedges often resolve lower, but they do climb higher first, sometimes to retest prior resistance ($580–$583)
A close above $583 on volume invalidates the bear case
Negates the “cup” idea & confirms a breakout
A breakdown of the rising wedge (below ~$572 then $568)
Aligns with the inverted cup & handle thesis and target ~$559
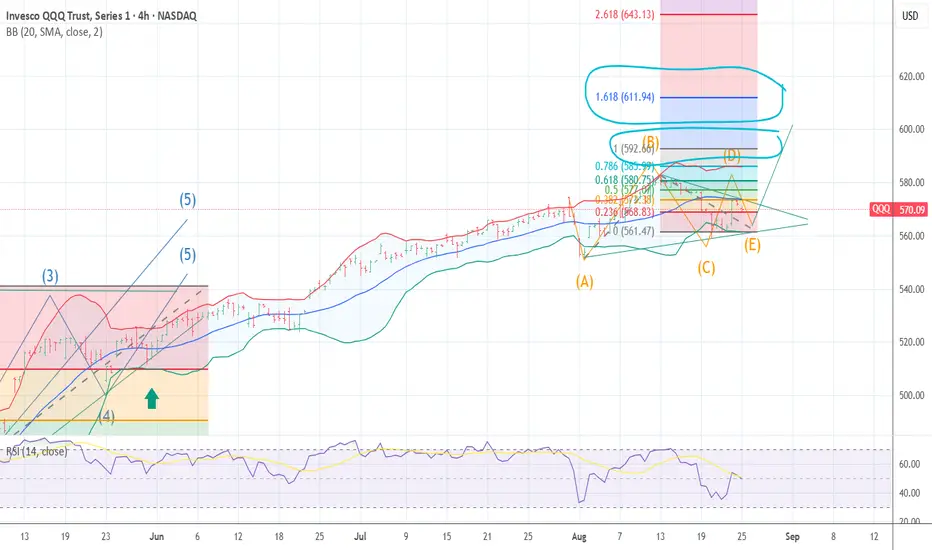
Right now, a bearish wedge inside the potential inverted cup & handle
If it breaks down, it validates the bearish case
If it powers through $583, it flips back to bullish continuation
Trading a bearish setup inside an uptrend context
Inverted cup + wedge is bearish, but bulls still have a chance until $583 is rejected
Think of 583 as the “line in the sand”
1. Bearish Case (~55% probability)
Head & Shoulders + rising wedge
Failure to break/close above $583
Target $568 (neckline)
If sellers press, $550–$555 with a full measured move to ~$532, but may need a macro shock to hit
2. Bullish Case (≈40% probability)
Strong breakout & hold above $583
Squeeze toward $590 (prior resistance)
If momentum + AI narrative revives, $605–$607
Would represent a sentiment shift
3. Neutral/Chop (≈5% probability)
Sideways consolidation $570–$580
Economic data this week comes mixed results in no conviction
$583 is the decision point & $568 is the neckline where bears are in control
NVDA earnings reaction + economic data (jobs, inflation)
If rally is on weak volume, likely a bull trap
The market leans bearish unless bulls can decisively close >$583

QQQ 5th leg down tomorrow?Normally wouldn't want to publish anything this short term, but the rally this afternoon looks like a 3-3-5 flat for wave 4. It stayed within the channel and the close for the day was under the 38% retracement of wave 3 after going over it.

QQQ LongLooking at QQQ on the 15-minute chart, the broader market structure has shifted from bearish to more balanced after a deep selloff earlier in the month. The sharp decline created a series of lower lows until buyers stepped in aggressively around 560, forming a clear Change of Character (CHoCH) as the downtrend stalled. Since then, the structure has transitioned into higher lows, with price now pushing back toward prior supply levels. The most recent rally suggests buyers have regained momentum, though the major Break of Structure (BOS) needed to confirm a full trend reversal would come above 583.32.
The key supply zones sit between 576–578 and higher up at 580–582, both of which previously sent price lower with strong rejections. These are significant resistance areas where sellers showed control, and they remain strong supply zones until decisively broken. On the demand side, the 570–571 region has proven itself as a solid base, where buyers stepped in with strength on multiple retests. Deeper demand sits closer to 561–563, which sparked the strongest bullish reaction, making it the most reliable support zone if tested again.
Within the marked region, price is pressing into the 576 supply, showing a small pause but not yet a full rejection. The price action suggests buyers may allow a shallow pullback toward 572–573 before attempting another push into the 577–580 zone. If demand holds on that pullback, continuation higher into the upper supply looks likely. However, if 570 is lost, that would be a sign of weakness and could shift the short-term bias back toward sellers.
Trade bias: Short-term bullish
Expected direction: A continuation higher into 577–580 supply, possibly after a shallow pullback
Invalidation level: A decisive break below 570 demand would flip the bias bearish
Momentum condition: Buyers currently hold the edge, with clean higher lows and strong candles on impulses
Price behavior: Consolidation under supply, signaling accumulation before the next test higher
QQQ Break or Fail?Bullish Breakout
QQQ breaks and holds above $575
Calls with tight expiry (if momentum is strong) or slightly further out for safer time decay
Needs broad tech confirmation (NVDA, AAPL, MSFT, META & etc)
Bearish Rejection
QQQ fails to push above $575 and stalls
Puts with tight expiry for momentum, or stagger entries to scale in
If NVDA’s earnings fade spreads to semis, this path gains momentum
Current Bias
Momentum is mid-stochastic (not overbought/oversold)
That means the $575 zone is the decision point
The trade will likely set up today/tomorrow - break or fail
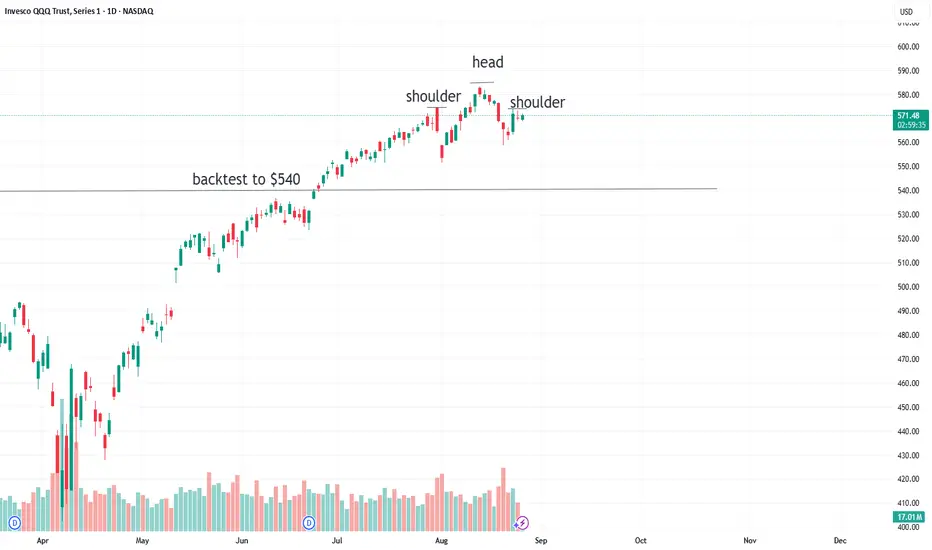
September Collapse in QQQAfter the April Tariff collapse, the index rose significantly off of the bottom and blew right past prior highs. There is a need to back-test to the $540 range. Further, which the government taking fascist equity positions in publicly traded equities and threatening the independence of the federal reserve, there are black swans looming everywhere. Also, tariffs will soon start impacting inflation, just as cracks are forming in the job market. However, can you really rely on the data since the head of BLS was fired for telling the truth about jobs?
QQQ: REVERSION TO 20WK.EMA? 544-542 Zone? Upcoming seasonality is right on-time. Saw a stat which read 25 of 27 times, the market sold after Jackson Hole, Wy event with FED speaker.

QQQ Bearish vs Bullish Continuation A bull flag needs 3 key ingredients
1. Flagpole (strong impulsive move up)
• QQQ ran from ~$563 (5 Aug) to ~$583 (14 Aug)
2. Flag (controlled consolidation)
• The consolidation after 14 Aug hasn’t just been a tight downward drift; instead, QQQ dropped sharply to ~$563 (not shallow, that’s a full retrace)
• Bounced, but then chopped sideways inside a descending channel
• It looks more like a bearish channel than a neat flag that’s hugging the 50% retrace level
3. Volume & structure
• In a bull flag, you want volume drying up during the pullback
• The selling volume stayed heavy at times
• The “flag” portion is wider, choppier & longer in time than a bull flag (which is usually 1/3 the length of the pole)
This pattern is flag-like, but it leans closer to a descending channel/consolidation than a bull flag
• If bulls can break $575 on rising volume, it becomes a flag breakout
• If QQQ slips under $568, then it invalidates the bull flag & resolves bearish (a continuation of the down-channel)
It can be a bull flag, but right now it’s an ambiguous consolidation that will only prove itself with a breakout over $575
• If QQQ breaks $575 with conviction, the projected target = $583 + $20 = ~$603

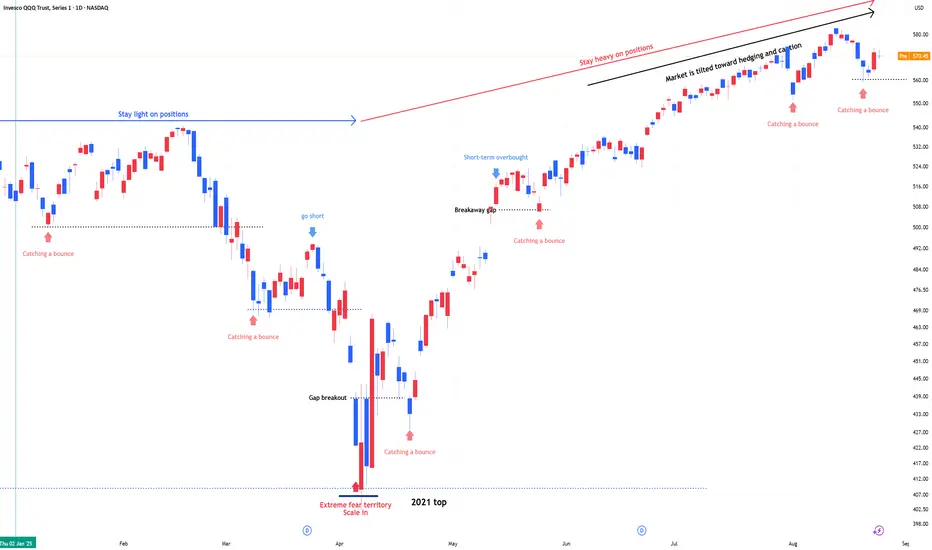
QQQ : Stay heavy on positions.Currently in a short-term bounce signal zone. Maintaining the same outlook as before.
In stay light on positions zones, I hold QQQ and reduce exposure.
In stay heavy on positions zones, I increase allocation using a mix of QLD and TQQQ.
** This analysis is based solely on the quantification of crowd psychology.
It does not incorporate price action, trading volume, or macroeconomic indicators.
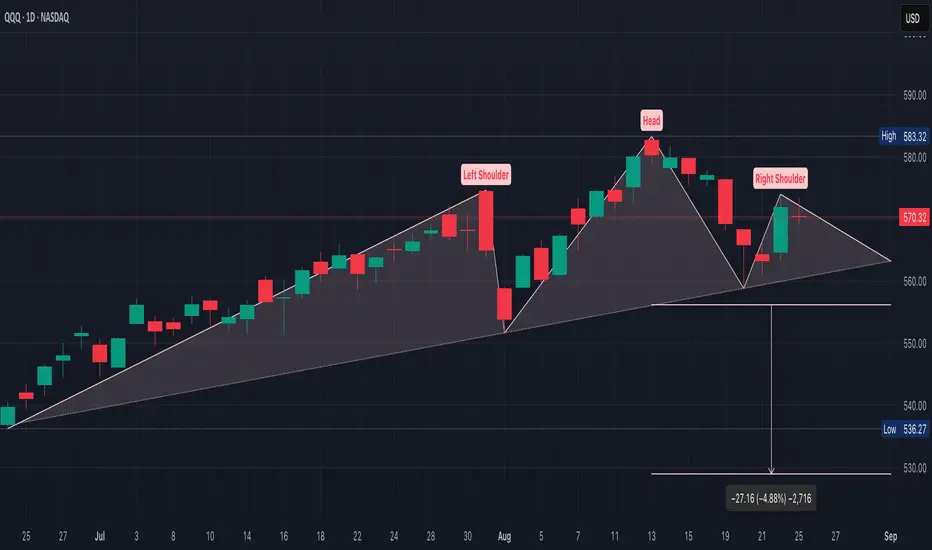
QQQ Volatility Squeeze Ahead?A decisive break & close below $556 would confirm this bearish move,
$532–$529
Head at ~$583
Neckline at ~$556 sloping upward which tends to delay confirmation, but breakdowns can be sharper if they do occur
(Head - Neckline) = ~27 points, so the measured move is ~$556 – $27 = ~$529
If QQQ closes back above $575, the right shoulder fails & we see continuation of the uptrend
QQQ Binary Setup Around PivotBias slightly bullish as long as $570 holds, but QQQ has been fading end of day, so morning strength needs confirmation
If QQQ holds above 5$70 pre-market/first hour, risk/reward favors calls
If QQQ loses $569 pivot with volume, momentum shifts down
Whichever side wins $569/$570 will likely carry the session
QQQ day & hr reviewWatch these new soft lows. Lower Highs.
Hr chart shows a band to band play within the BB... nice.
Day reflects double wicks w/ HL... bullish. The close was a bit of a rejection... makes sense as the BB are right there. Let's see if we pullback Mon/Tues of next week.
*NVDA & BABA earnings next week. Will be watching....
Have a great weekend. What do you see?

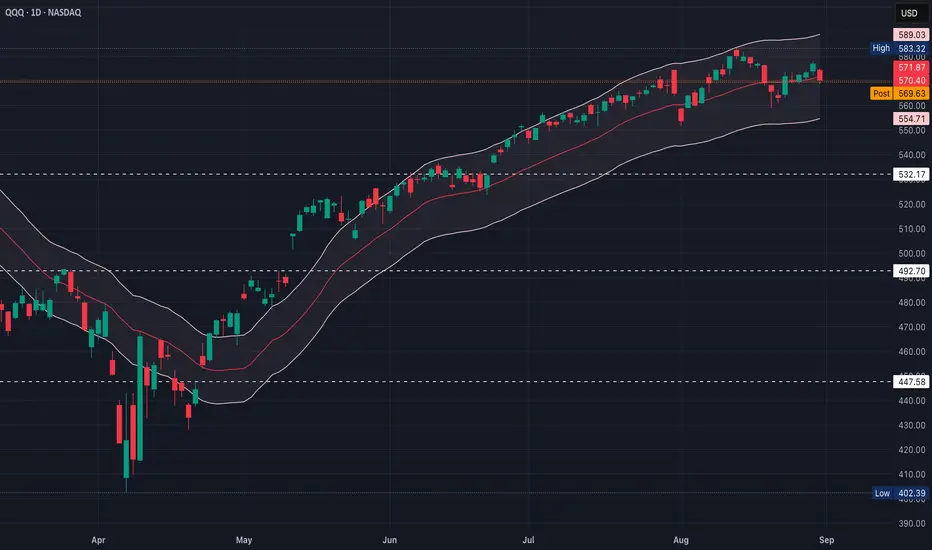
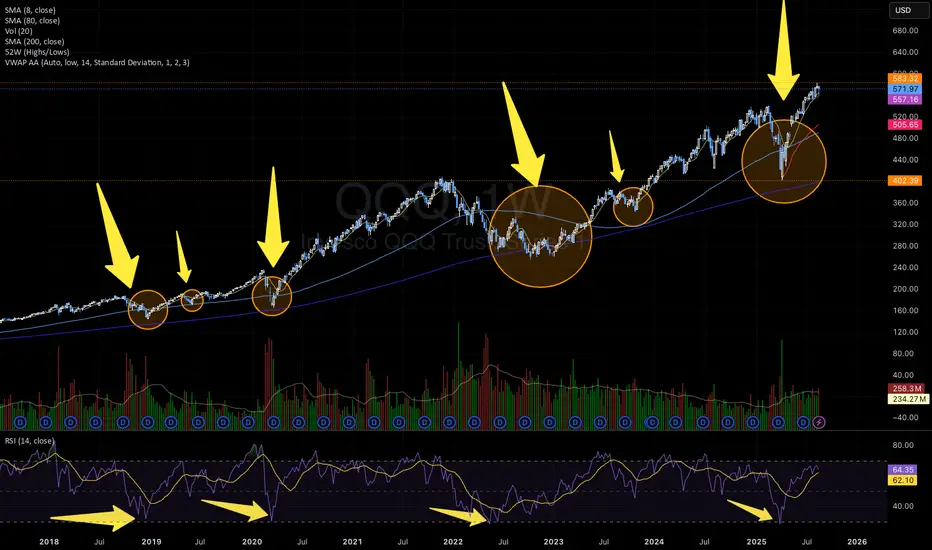
Bullish Pattern: V-Shape + Shakeout with Strong RSI SignalOn the QQQ weekly chart, a recurring bullish pattern has emerged multiple times over the last years:
1) V-shape recoveries followed by Cup & Handle formations and then a shakeout, all of which preceded powerful upside moves (highlighted with arrows and circles).
2) Each time the weekly RSI touched the 30 zone , it triggered a strong bullish rally. This happened three times in the past (2018, 2020, 2022) and just occurred again in March/April 2025.
3) Both times the Cup & Handle pattern formed, the RSI found support around the 45 level.
This suggests that QQQ may be setting up for another bullish leg if history repeats itself.
📊 Key Takeaways:
Weekly RSI bouncing from oversold (30 zone)
Recurrent V-Shape + Cup & Handle + Shakeout bullish pattern
Strong rallies historically followed this setup
⚠️ Not financial advice — purely a technical pattern study.
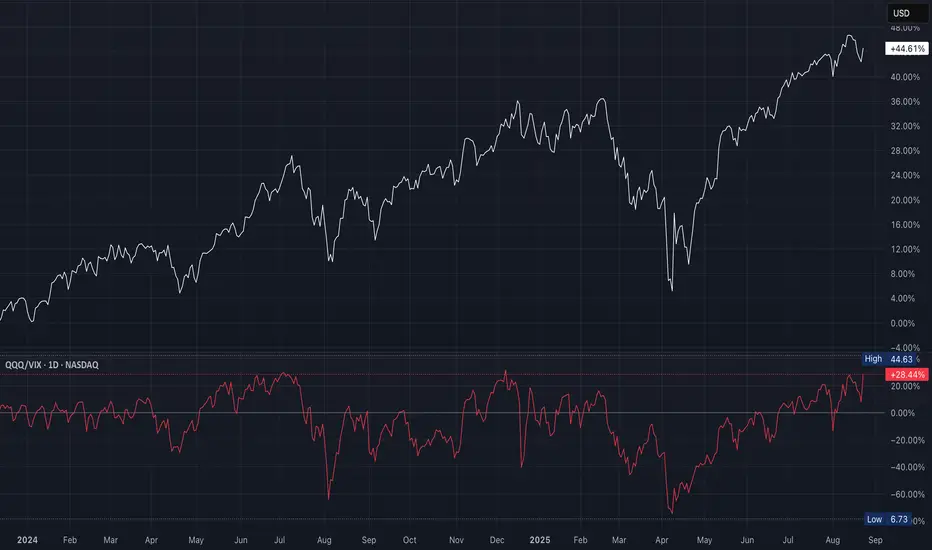
QQQ Fear-Adjusted Momentum GaugeThis is a fear-adjusted momentum gauge
A higher ratio = strong risk appetite (bullish for QQQ)
A lower ratio = stress (bearish for QQQ)
Big rallies in QQQ (January to July 2024 & May to August 2025) coincided with QQQ/VIX trending upward
Price gains were stronger than implied volatility
Whenever QQQ/VIX rolled over (August to October 2024 & January to March 2025), QQQ sold off hard
QQQ price sometimes “lingered flat” at first, but the ratio gave an early risk-off warning
As of late August 2025, the ratio is at +28%, near upper resistance zone where rallies have previously stalled
QQQ price itself is consolidating near highs
If the ratio holds above +20% and pushes higher, this confirms a risk-on continuation
If it rolls back below +20%, this is a warning of correction, even if QQQ is still flat
Ratio rising from neutral (~0%) into +20–40%, which confirms healthy momentum with low fear; however, the ratio is falling while QQQ still up (divergence)
Sharp drops below 0% (volatility leading) indicates strong downside risk
QQQ/VIX is elevated, confirming risk-on, but at a spot where past rallies faded
Suggests short-term cautious bullish bias, but watch for reversal in ratio which would precede a QQQ pullback
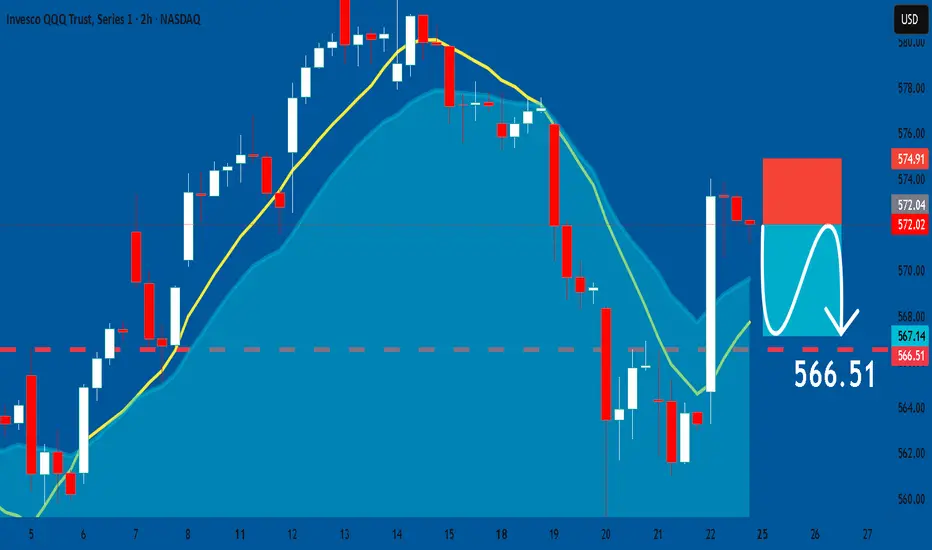
QQQ: Bearish Continuation & Short Signal
QQQ
- Classic bearish setup
- Our team expects bearish continuation
SUGGESTED TRADE:
Swing Trade
Short QQQ
Entry Point - 572.02
Stop Loss - 574.91
Take Profit - 566.51
Our Risk - 1%
Start protection of your profits from lower levels
Disclosure: I am part of Trade Nation's Influencer program and receive a monthly fee for using their TradingView charts in my analysis.
❤️ Please, support our work with like & comment! ❤️
Is Fridays Bounce a Bull Trap?CME_MINI:NQ1! CME_MINI:ES1! stock market Forecast
Nvidia Stock NASDAQ:NVDA Forecast
Apple Stock NASDAQ:AAPL Forecast
Microsoft Stock MSFT Forecast
Google Stock GOOGL Forecast
Amazon Stock AMZN Forecast
Meta Forecast Technical Analysis
Tesla Stock TSLA Forecast
Magnificent 7 stocks forecast

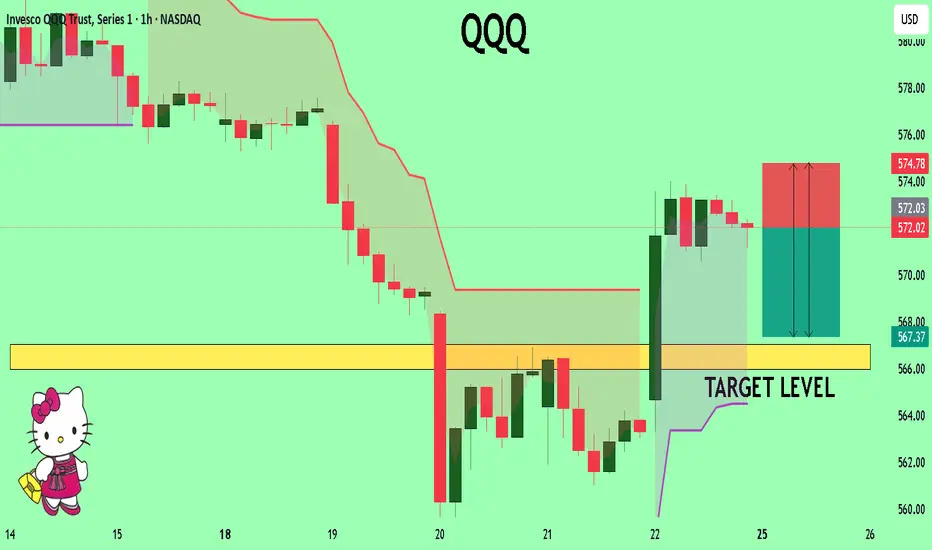
QQQ The Target Is DOWN! SELL!
My dear subscribers,
My technical analysis for QQQ is below:
The price is coiling around a solid key level - 572.02
Bias - Bearish
Technical Indicators: Pivot Points Low anticipates a potential price reversal.
Super trend shows a clear sell, giving a perfect indicators' convergence.
Goal - 567.03
My Stop Loss - 574.78
About Used Indicators:
By the very nature of the supertrend indicator, it offers firm support and resistance levels for traders to enter and exit trades. Additionally, it also provides signals for setting stop losses
Disclosure: I am part of Trade Nation's Influencer program and receive a monthly fee for using their TradingView charts in my analysis.
———————————
WISH YOU ALL LUCK