TSLA Breakdown or Bear Trap? Oct. 13TSLA Breakdown or Bear Trap? Watch This Zone Before the Next Big Move
Tesla just had one of its hardest sessions in weeks — dropping over 5% on Friday and closing near $408, right on the edge of a major technical breakdown.
But here’s the thing: while the chart looks heavy, there are signs that sellers might be losing steam. Let’s unpack what’s happening from both the 15-minute price action and the 1-hour options (GEX) landscape so you know what to expect when the market opens Monday.
15-Minute Intraday Technical View
Friday’s price action was pure capitulation. After losing $430, Tesla slid straight down the channel and found temporary footing near $405–$408.
The 15-minute chart shows a clean descending structure with a trendline connecting lower highs — every bounce so far has been rejected.
But now, for the first time in two days, the MACD histogram is turning light blue, and Stoch RSI is curling up from deep oversold territory near 20. That means momentum is trying to flip, even if price hasn’t confirmed it yet.
The immediate level to watch at Monday’s open is $410–$415. If Tesla reclaims that area with strength, it could start an intraday reversal move toward $420–$425, where the breakdown started.
However, if it rejects there and breaks below $405, the next support isn’t until $395–$390, and that’s where the next flush could hit fast — especially if VIX spikes above 22 again.
The key is to watch volume and confirmation. A weak bounce without strong participation likely fails, but a reclaim above $415 with rising volume could catch shorts off guard and trigger a fast squeeze.
1-Hour GEX Analysis — Options Sentiment
The 1-hour GEX chart paints the bigger picture: this entire drop was dealer-driven.
The HVL (Highest Volatility Line) sits near $417–$420, which means that’s the line separating calm from chaos. Staying below it keeps TSLA in negative gamma territory — where every move feeds volatility instead of containing it.
Below the current price, there’s a massive Put Wall sitting around $395–$390, marking the highest negative GEX zone. That’s the “danger zone” where market makers start shorting more to hedge, which can accelerate a drop.
Above that, there’s heavy Call Resistance stacked around $445–$450, so even if Tesla bounces, it’ll hit resistance hard once it gets near $440+.
IVR sits around 29.4 with IVX at 70, showing that implied volatility is still very high. That means options are expensive — traders are paying up for protection, not confidence.
Right now, GEX positioning suggests Tesla’s price is trapped between $405 and $425, waiting for direction. If price holds and climbs above $420, gamma flips neutral and a short-term rally could unfold fast.
My Thoughts and Trade Ideas
Tesla is stuck in a volatility choke zone — but it’s not dead.
The 15-minute chart shows potential momentum reversal, while the 1-hour GEX confirms that option flows are balanced on a knife’s edge. Bulls need to push above $420 to break the cycle of dealer hedging and start a relief wave toward $430–$440.
If you’re scalping, watch for:
* Long setup above $415–$418 with volume confirmation — target $425–$430.
* Short setup if it fails $410 or breaks $405 — target $395, then $390.
For option traders, the 420C or 425C strike could work for a short-dated bounce play if volatility cools. But if fear continues, the 400P or 390P offers a safer directional hedge.
The real pivot for Tesla isn’t price — it’s sentiment. Once VIX calms below 20 and liquidity returns, Tesla usually leads the rebound. Until then, this remains a day trader’s battlefield.
Final Take
Tesla is coiled inside a descending channel but showing early divergence. Monday will determine if this is just another leg down or the first real reversal from oversold territory.
Above $420 = short-covering bounce.
Below $405 = more pain ahead.
Volatility will decide who wins.
Disclaimer: This analysis is for educational purposes only and not financial advice. Always trade your own plan and manage your risk carefully.
Trade ideas

$TSLA in the buy zoneNASDAQ:TSLA retraced to 38.2% fib in a Wave 4 retracement. Wave 5 of 3 should take out the prior local high. I lightened my position earlier and now am ready to add to my position.

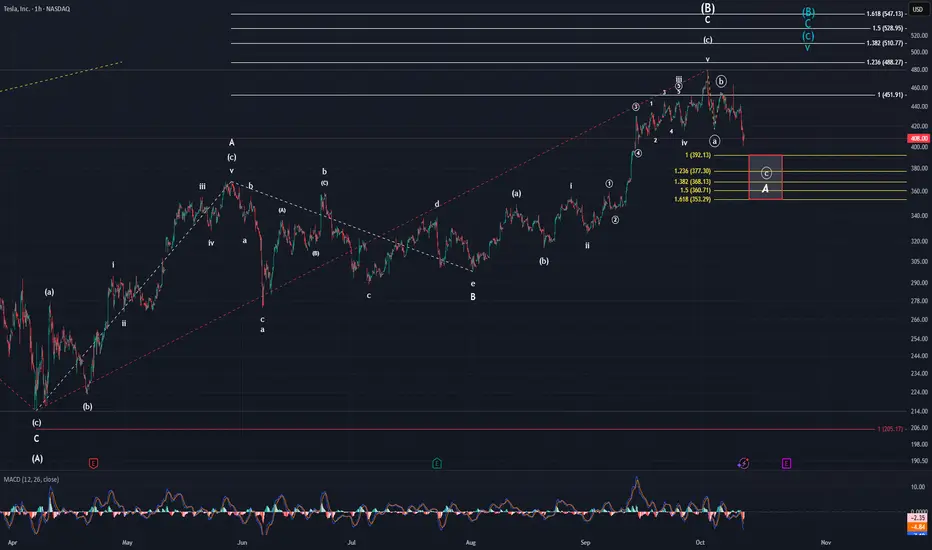
TeslaFriday was a rough day for anyone that was long...pretty much anything lol. There were a few tickers like MP that posted a green day, but they were far and few between. Tesla was no exception to this and closed down over $22. This should not have come as a surprise for anyone though. Maybe the magnitude in which the market turned downwards, but not that it did. I have been saying for 2-3 weeks that the top was near. that being said, although price tanked the way that it did, we technically do not have the confirmation needed for a top. Do I think it likely we have a top in place? Yes, I do. However, one cannot definitively say it is in for a fact. The absolute confirmation doesn't come until we can breach $368.33 unfortunately.
We will get clues and data pointing to a top on the way down though. The first thing I want to point out is that we have officially breached the last TWO wave 4's of a lesser degree. This in itself is a very good sign the top is in. Also, MACD made a new local low. When you look at the yellow fibs tracking the possible abc down, the 1.382 is just below that minor A wave top. This means over half of the standard target area for minute ((c)) of minor A is below the minor A high.
Another thing I want to point out is that in the overnights, Robinhood is showing Tesla trading @ $423 currently, and has raised as high as $425. This could be pointing to a couple things. The first is that the minute ((c)) wave is just subdividing into a smaller 3-wave pattern that will ultimately end within the target box to conclude minor A wave. The other is that Friday's low was the minute ((a)) wave low with ((b)) currently underway. Then lastly, it could be pointing to my ALT turquoise count that suggests another high to the low $500's is needed.
I do not like the turquoise count, but I cannot rule it out with 100% certainty yet, so it stays for now. The count that I favor is the white count, and ((c)) being carved out in three waves. Hopefully we get some clarifying data tomorrow, but if not, we should get some this week. For now, we continue observing. Should you not be able to help yourself and want to enter into a trade...use TIGHT stops. I am not a gambling man, so I will remain on the sidelines. Ultimately, I believe it is only a matter of time until we see price back into the $100's...
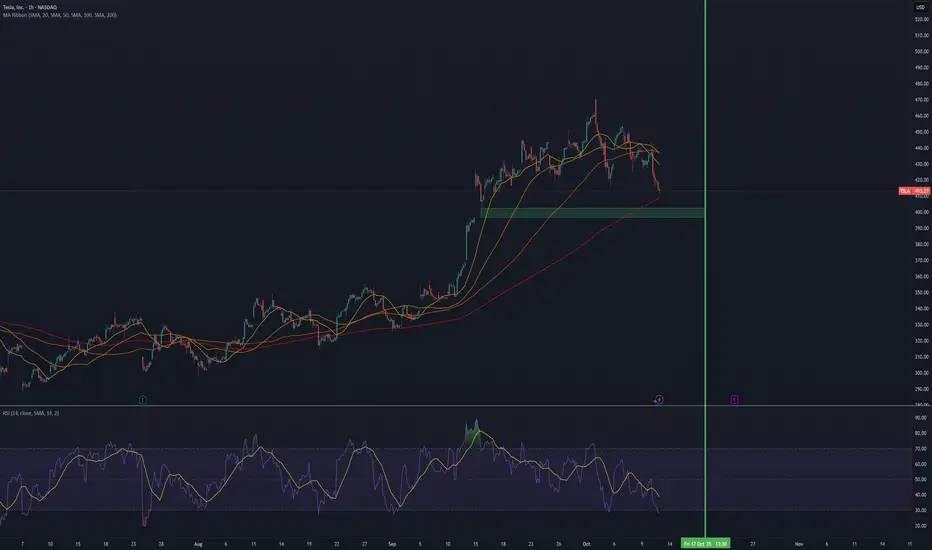
TSLA Week Ahead - ShortTSLA looks like a classic post-rally consolidation after that sharp pop from late September lows around $340. The candlesticks show solid volume on the upside thrusts (those red-to-green hammers mid-September), but we're seeing some profit-taking wicks lately, with the price hugging that rising EMA channel (orange line) around $410 support. That unfilled gap down at $396-$402 (from early October open?) is screaming "magnet" if we get any broader market weakness—gaps like that on high-beta names like TSLA often fill on light-volume Fridays, especially with no major catalysts this week.
The gap is likely to close 70% of the times in 30 day span.
What to Expect by EOD Friday (Oct 17)
No earnings till Oct 22, so this week's all about macro vibes (Fed chatter, CPI print Wed) and TSLA-specific noise like Robotaxi buzz or delivery whispers. Q3 deliveries hit 462k on Oct 2 (beat estimates), so that's baked in—focus shifts to affordable model teases.
Base Case (60% odds): Sideways grind to $415-425. We're in that expected move band of ±6% (~$388-438 from here). Light volume mid-week could keep us coiling in the channel; that gap stays open unless we dump on risk-off. Analysts are meh short-term (avg target $361, but that's 1Y noise), but one shop just hiked to $483. I'd fade any spike above $420 for a quick scalp—RSI's overbought on 1H.
Bull Case (25% odds): Push to $430+. X crowd's frothing—folks calling ATH break by 10/17 on "unstoppable momentum" and 5Y consolidation snap to $500. If CPI undershoots and Elon tweets FSD gold, we tag resistance. One forecast pegs exactly $425 EOW.
Bear Case (15% odds): Gap fill to $400. Volatility spikes if yields rip higher or China EV FUD hits (ZEV credit chatter ending soon). That purple MACD histogram's flattening—watch for divergence.
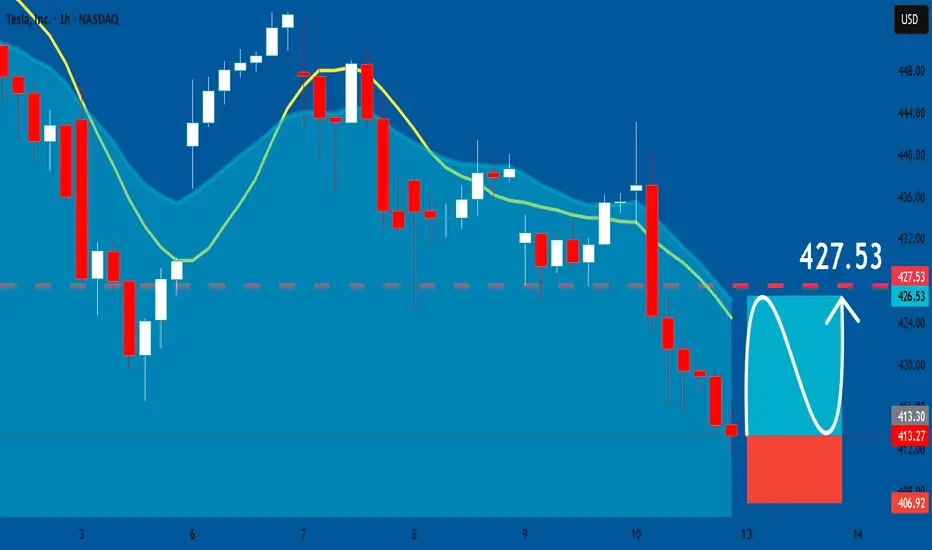
TESLA: Long Signal Explained
TESLA
- Classic bullish formation
- Our team expects pullback
SUGGESTED TRADE:
Swing Trade
Long TESLA
Entry - 413.27
Sl - 406.92
Tp - 427.53
Our Risk - 1%
Start protection of your profits from lower levels
Disclosure: I am part of Trade Nation's Influencer program and receive a monthly fee for using their TradingView charts in my analysis.
❤️ Please, support our work with like & comment! ❤️
Tesla (TSLA) - Weekly Battle Before The BreakoutTicker : NASDAQ:TSLA
Timeframe : Weekly
Bias : Neutral (Awaiting breakout confirmation)
Range : $410 - $470
🧠 MARKET CONTEXT
Tesla is stuck in a wide weekly range as macro uncertainty and earnings expectations collide.
Buyers defend the $410 zone while Sellers keep rejecting $470 - a classic coiling phase before expansion.
🔎 TECHNICAL OVERVIEW
* Structure: Choppy / Distribution phase ( failed breakouts, heavy wicks, indecision )
* Resistance Zone: $465-$475 ( needs clean close above for breakout confirmation )
* Support Zone: $410-$425 ( critical area maintaining bullish structure )
* Major Support Below: $320-$360 ( long term value area where buyers historically stepped in )
📈 SCENARIOS
🟢 Bullish Case:
* Weekly close above $470 with strong volume = breakout signal.
* Targets : $500+ zone, potential retest of 2024 highs.
🔴 Bearish Case:
* Weekly close below $410 = structure break.
* Targets : $360 - $320 zone.
⚪ Neutral / Range Play:
* Between $410 - $470, range strategies work best (fade extremes, tight risk).
🌍 MACRO CONTEXT
* The FED's higher-for-longer stance keeps pressure on growth stocks.
* Q3 deliveries were strong, supporting long term sentiment.
* Competition & margin compression (China & Europe) remain risk factors.
* Tech sector volatility + geopolitical headlines amplify TSLA's swings.
📊 WEEKLY OUTLOOK SUMMARY
* Short Term (2-4 weeks) : range bound between $410-$470 - watch for volume spikes / breakout confirmation.
* Medium Term (1-3 months) : direction depends on Fed & earnings - macro + delivery data key catalysts.
* Long Term (Q1 2026+) : bullish bias intact if fundamentals hold - expect volatility during macro tightening.
💬 FINAL TAKE
Tesla is coiling between $410 and $470. Whichever side breaks first will likely define Q4's direction. Watch weekly closes and volume confirmation - "The Big Move Is Loading"
$TSLA Bearish batReached target (0.886 fib level) after breaking out from B point of the pattern. will wait for price to go down further and consolidate.

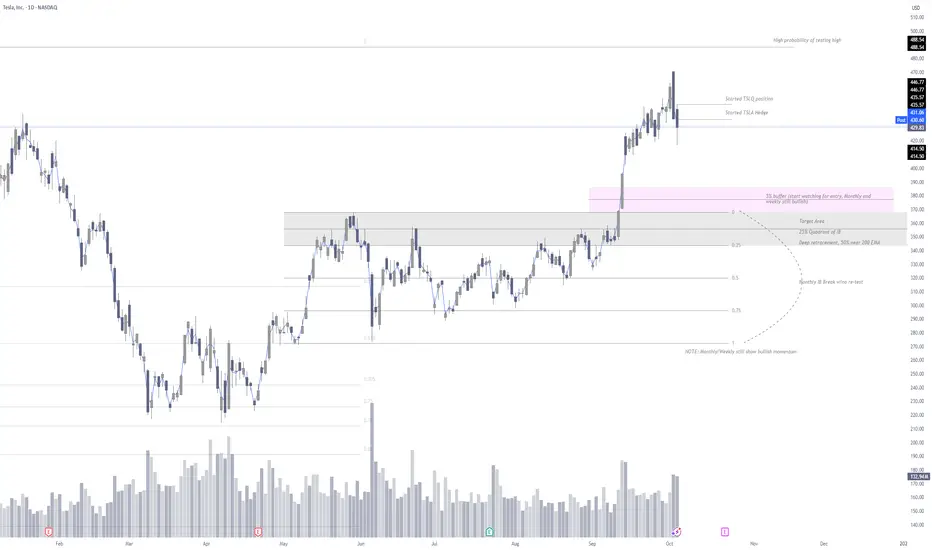
TSLA Short1. May/June Inside Bar: Broke to the upside on September with no re-test of break.
a. Higher timeframes take longer for this to re-test.
b. I have found that 18 days is an average re-test, but this is not 100%.
2. Daily chart shows pullback, but its extremely important to understand that the weekly and monthly show bullish momentum.
3. I have started a TSLQ short position adding slowly, with TSLA shares targeting ATH's.
4. The target is for TSLA to move back into the 5% buffer, where I will start looking for a long position. The inside bar is usually re-tested. If bullish momentum is still there, which the weekly and monthly still show, then the 5% buffer and 25% quadrant are entry zones. However, if something changes, then 50% quadrant should be the target.
Happy trading!
TSLA: ShortNASDAQ:TSLA ⚡ Coiling up in a symmetrical wedge right under equilibrium — a textbook indecision zone before expansion.
Still trading below premium structure → bias remains bearish unless we see a clean breakout and hold above 434.5.
Volume contracting, RSI midline hovering → pressure building for next leg.
🎯 Breakdown targets: 427 → 422 → 416
🚀 Bull case invalidation: Close above 434.5, targeting 444–450
🧠 VolanX DSS Bias: Bearish continuation, awaiting volatility trigger
#TSLA #VolanX #SmartMoney #LiquidityZones #PriceAction #AITrading #WaverVanir
Not Investment Advice

Why Most Prop Traders Fail (Even the Skilled Ones)When speaking with Prop Traders, we have found the issue was not about
bad setups; it’s emotions under pressure that is the problem
Fear after a loss. Greed after a win.
That’s when discipline slips and accounts die.
Here’s what helps:
Before each session, ask ?
“Would I take this trade if I weren’t trying to prove something?”
This one question has saved more accounts than any indicator
I’ve been helping traders stay calm when it matters most.
If you’ve ever blown up knowing exactly what you should’ve done, DM me and I’ll show you what’s been working.
Breakout Incoming!Tesla remains within a well-defined channel range, consolidating near lower channel support on declining volume, which reflects healthy consolidation after prior momentum. The recent action has formed a symmetrical triangle, with price compressing between rising support and descending resistance — a classic setup for a volatility squeeze and potential breakout.
Despite short-term weakness, TSLA has consistently held above prior support levels within the channel. With bullish sentiment building ahead of earnings, it’s unlikely the stock breaks below existing support (~$416–$420).
The key resistance to watch is at $455, aligning with the upper boundary of the current structure. A decisive breakout above this level could trigger a move toward $470, which coincides with the previous high and marks a potential continuation of the bullish trend.
Notably, the price breakout between September 11 and September 22 offers a useful reference; that move demonstrated TSLA’s ability to accelerate rapidly once volume returns and resistance levels are cleared - this stock is a freight train once it gets moving.
Given the technical compression, low-volume consolidation, and improving sentiment, I’d expect a breakout as early as tomorrow or early next week, especially as we lead into earnings.
Key Levels:
• Support: $416–$420
• Resistance: $455 (breakout trigger)
• Target: $470+ (prior high / upper channel objective)
• Future Target: Liftoff?

A Blow Off Top/Double Top on TESLA?Tesla's move since 9/11/25 has characteristics of a Blow Off Top
Parabolic price rise
Extremely high trading volume
Widespread optimism or “fear of missing out”
Sudden reversal and heavy selling
The high appears to match prior highs from last year, making this a double top.
Near the top, there was a period of distribution, as shareholders exited positions, creating new bagholders.

TSLA BULLISH OCT 9 2025There is a lot of bullish momentum in Tesla at current price. Price action is always superior .
If you dont understand a trade then dont enter in it trusting me or any stranger as this is your hard earned money. Missing a trade is not the end of the world.
Its a trade so,
STOP LOSS means Stop my loss
Trade:
Entry- curren price
SL-$416 close
Target-$460 min

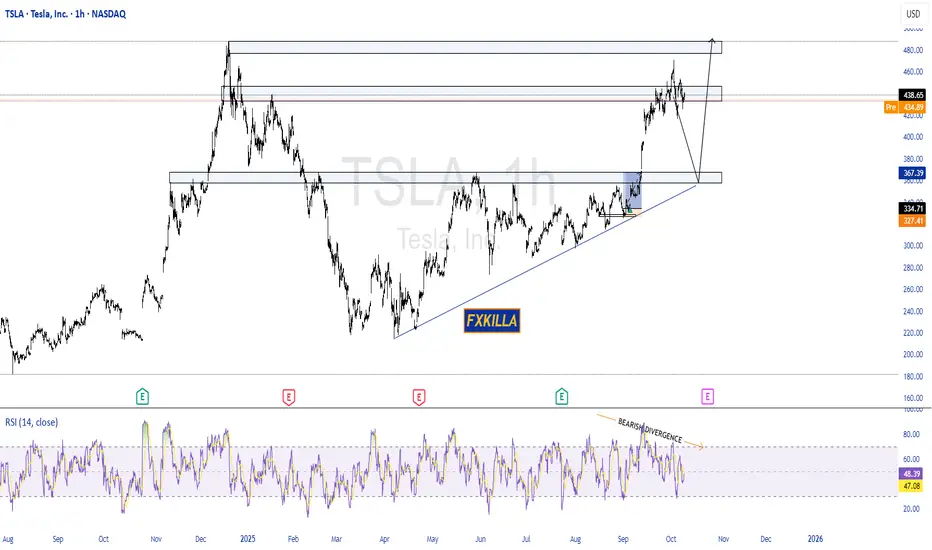
TESLA HIGH PROBABILITY SETUPS SOON!!!🚨 TESLA HIGH PROBABILITY SELL/BUY SETUPS 🚨
* Here We Can See Clearly The Next Potential Move For TSLA Coming Hours/Days.
* Keep Your Eyes Close On Your Trading Positions.
* Happy PIP Hunting Traders.
FXKILLA.
TSLA Oct. 9 — Bulls Defending $430 Zone, Eyeing Break Above $444Tesla (TSLA) has been forming a constructive base near the $430 zone after reclaiming momentum from its recent dip. On the 15-minute chart, structure shows a clean BOS (Break of Structure) followed by a minor CHoCH around $437–$438 — indicating consolidation before a possible continuation move. The ascending intraday trendline remains intact, and price is currently holding above short-term liquidity levels.
MACD is curling upward again with momentum building, while the Stoch RSI has reset near the mid-zone and looks ready to push higher — signs that a bullish continuation could resume if TSLA maintains above $433.
On the 1-hour chart, the key HVL sits around $425, which also aligns with gamma support. Above, there’s a visible stack of gamma resistance layers between $442.5 and $452.5, topped by a major call wall near $457.5–$460. This range defines the next battleground for directional momentum.
Support and Resistance Levels:
* Immediate Resistance: $441.33 → $444.0
* Major Resistance (Gamma Wall): $452.5 → $457.5
* Immediate Support: $433.09 → $430.0
* Key Support Zone: $425 → $422
GEX & Options Sentiment (1H GEX Chart):
* The highest positive Call Gamma lies between $444–$457.5, suggesting an upside magnet if TSLA maintains strength.
* Strong Put Support sits at $425–$420, reinforcing the bullish floor from the recent rebound.
* IVR is low (27) and Calls dominate at 62%, indicating bullish skew but with room for volatility expansion if breakout volume increases.
* Gamma exposure shows positive slope above $440, meaning dealer hedging could amplify upside moves once that zone clears.
Trade Scenarios:
Bullish Setup:
* Entry: Above $441.5 breakout confirmation
* Target 1: $448
* Target 2: $452.5
* Stop-Loss: Below $432
* Rationale: Holding above $433 with bullish MACD and rising GEX bias confirms continuation toward $450 zone.
Bearish Setup:
* Entry: Below $430 breakdown
* Target 1: $425
* Target 2: $420
* Stop-Loss: Above $435
* Rationale: A failed retest at $438–$440 with divergence could trigger a short-term retrace to retest gamma support.
TSLA is in a critical consolidation phase. A break above $441.5 could trigger a bullish leg toward $450+, while losing $430 could open a short-term fade to $425. Bulls are defending key ground — but watch for volume confirmation before entering.
Disclaimer:
This analysis is for educational purposes only and does not constitute financial advice. Always do your own research and manage your risk before trading.
If anyone needs me to TA any stock, PM me.

TSLA: TradeBear flag forming on 15-min — structure looks weak.
Liquidity sweep around 441 done, momentum fading.
If we lose 434, expect acceleration into deeper liquidity zones (possible 418 area).
RSI flattening, volume divergence visible — watch for breakdown confirmation.
No confirmation = short trap possible, but bias remains bearish until >441 reclaims.
#TSLA #Trading #TechnicalAnalysis #BearFlag #SmartMoneyConcepts #Stocks
Not Investment Advice

TESLA LONGSLooking for price to sell off to price low of 152. If price shows bullish price action after liquidating low ( MSS+ retracement into FVG or ICT Breaker) i will be buying in. Alternative setup would be the same if price decides to sell off to the marked 2023 low.
Initial price targets will be Highs marked at 300$.

TESLA LONG JHON SILVERSLong on Tesla at these prices. Can see a retracement to 250$. Overall Bullish on Tesla. Worst case scenario we can see a short into sub-220$ region.
TESLA 190 MERRY CHRISTMAS !!!PIVOT BACK TO 190 CHISTMAS RALLY !!!
PIVOT AND ANLYSIS
Merry christmas to al !!!
stay profitable !!!!

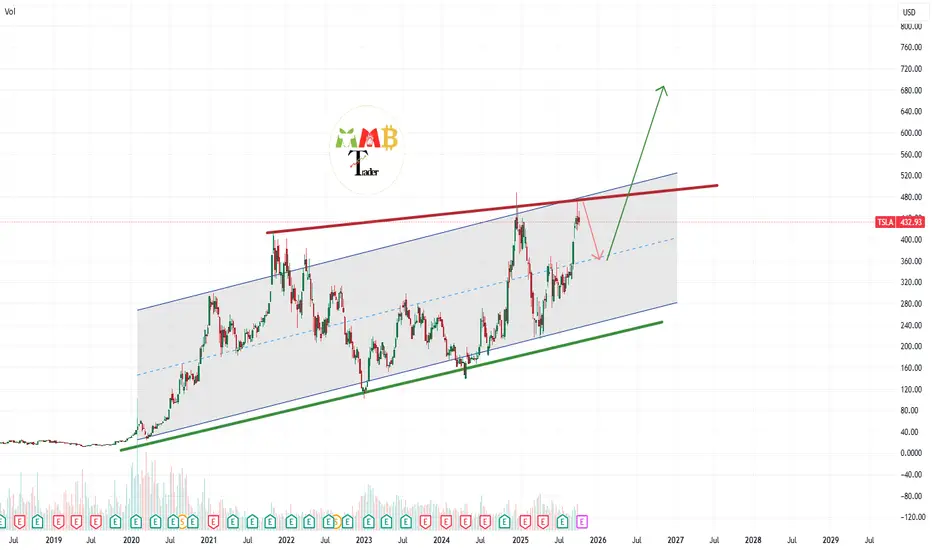
TSLA maybe retest support near 360$ but target is 700$Price is near channel resistance and red trendline sell pressure zone so we can expect short-term fall here like the red arrow but soon after that short-term fall we can expect heavy gain here like the green arrow on chart and targets like 600$ and more also if the red trendline break valid to the upside without that correction target can hit.
DISCLAIMER: ((trade based on your own decision))
<<press like👍 if you enjoy💚
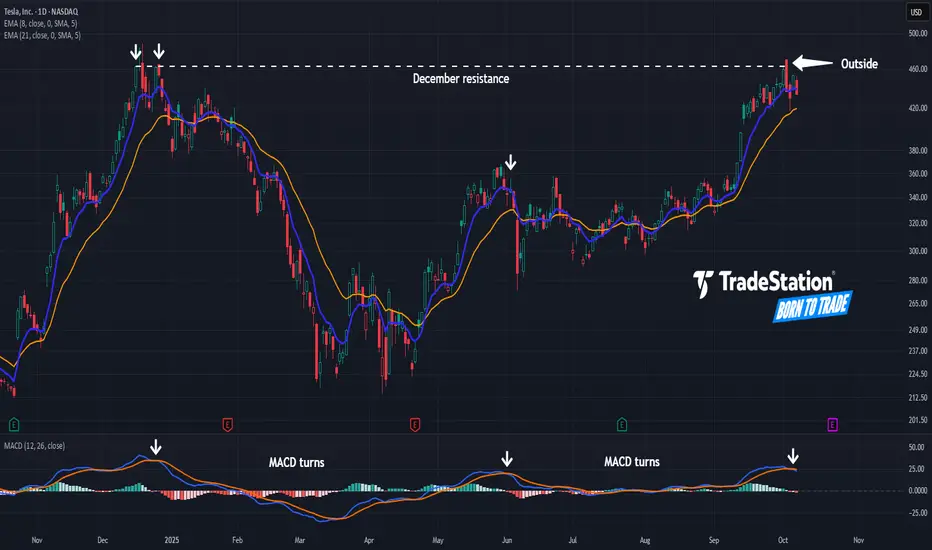
A Top for Tesla?Tesla ended the third quarter on a strong note, but some traders may see risk of the EV maker stalling.
The first pattern on today’s chart is the $463 price area. TSLA peaked at that level twice last December before reversing lower. Sellers appeared around the same level this month, which may confirm resistance is in place.
Second, the rejection day featured a higher high and lower low. That bearish outside candle is a potential reversal pattern.
Next, MACD has turned lower. Notice how previous downward reversals corresponded with deeper price declines. (Marked by white arrows in the lower study.)
Finally, TSLA is an active underlier in the options market. (Its average volume of 2.7 million contracts in the last month ranks first in the S&P 500, according to TradeStation data.) That could help traders take positions with calls and puts.
TradeStation has, for decades, advanced the trading industry, providing access to stocks, options and futures. If you're born to trade, we could be for you. See our Overview for more.
Past performance, whether actual or indicated by historical tests of strategies, is no guarantee of future performance or success. There is a possibility that you may sustain a loss equal to or greater than your entire investment regardless of which asset class you trade (equities, options or futures); therefore, you should not invest or risk money that you cannot afford to lose. Online trading is not suitable for all investors. View the document titled Characteristics and Risks of Standardized Options at www.TradeStation.com . Before trading any asset class, customers must read the relevant risk disclosure statements on www.TradeStation.com . System access and trade placement and execution may be delayed or fail due to market volatility and volume, quote delays, system and software errors, Internet traffic, outages and other factors.
Securities and futures trading is offered to self-directed customers by TradeStation Securities, Inc., a broker-dealer registered with the Securities and Exchange Commission and a futures commission merchant licensed with the Commodity Futures Trading Commission). TradeStation Securities is a member of the Financial Industry Regulatory Authority, the National Futures Association, and a number of exchanges.
Options trading is not suitable for all investors. Your TradeStation Securities’ account application to trade options will be considered and approved or disapproved based on all relevant factors, including your trading experience. See www.TradeStation.com . Visit www.TradeStation.com for full details on the costs and fees associated with options.
Margin trading involves risks, and it is important that you fully understand those risks before trading on margin. The Margin Disclosure Statement outlines many of those risks, including that you can lose more funds than you deposit in your margin account; your brokerage firm can force the sale of securities in your account; your brokerage firm can sell your securities without contacting you; and you are not entitled to an extension of time on a margin call. Review the Margin Disclosure Statement at www.TradeStation.com .
TradeStation Securities, Inc. and TradeStation Technologies, Inc. are each wholly owned subsidiaries of TradeStation Group, Inc., both operating, and providing products and services, under the TradeStation brand and trademark. When applying for, or purchasing, accounts, subscriptions, products and services, it is important that you know which company you will be dealing with. Visit www.TradeStation.com for further important information explaining what this means.
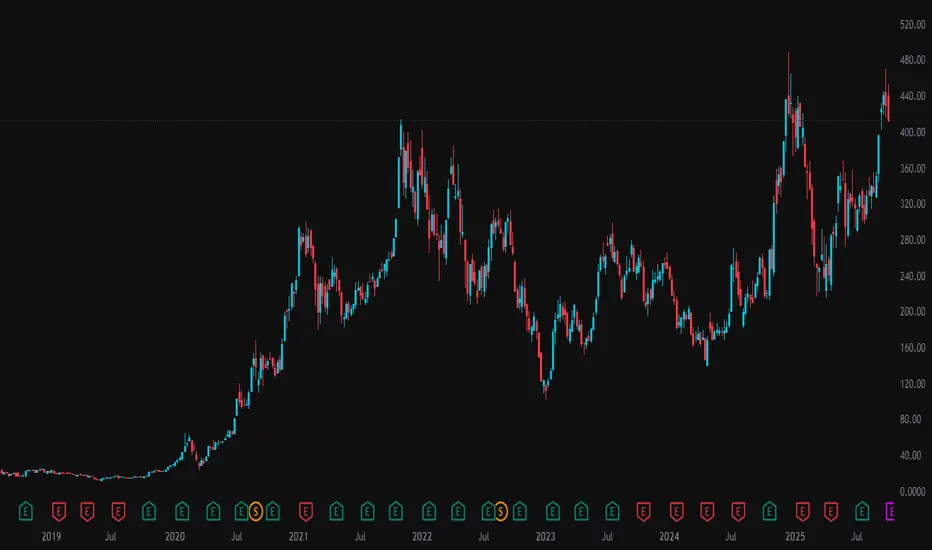
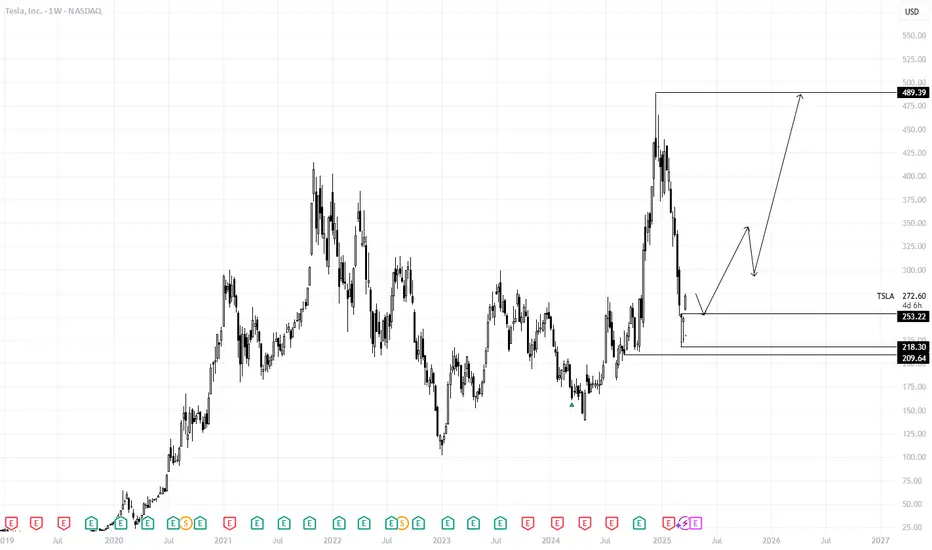
TSLA - Up ChannelAn Up Channel on TSLA
This is on the Weekly timeframe.
I expect another move up towards the top of the channel.
Moves up in the grey rectangles.
Bullish long.

TSLA: A Disciplined MoverHello,
Tesla dances to a disciplined rhythm, and I can't get enough of it.
Target of wave 5 is typically between (570-630)$, and it is a profit-taking zone.
Happy trading.
