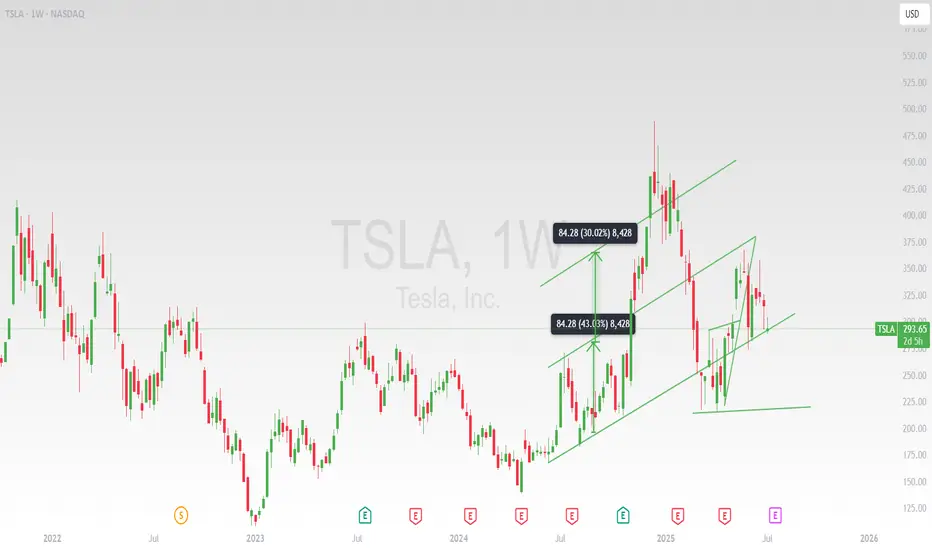
Fresh Daily Tesla ChartSharing my very messy Tesla chart.
Still watching for that $384 and $314 if we push past that daily gap.
The box midpoint(384) of my tesla Macrochart is the decision point to me.
Could still get a look below and fail of the boxes or a gap fill and reversal.
Trade ideas
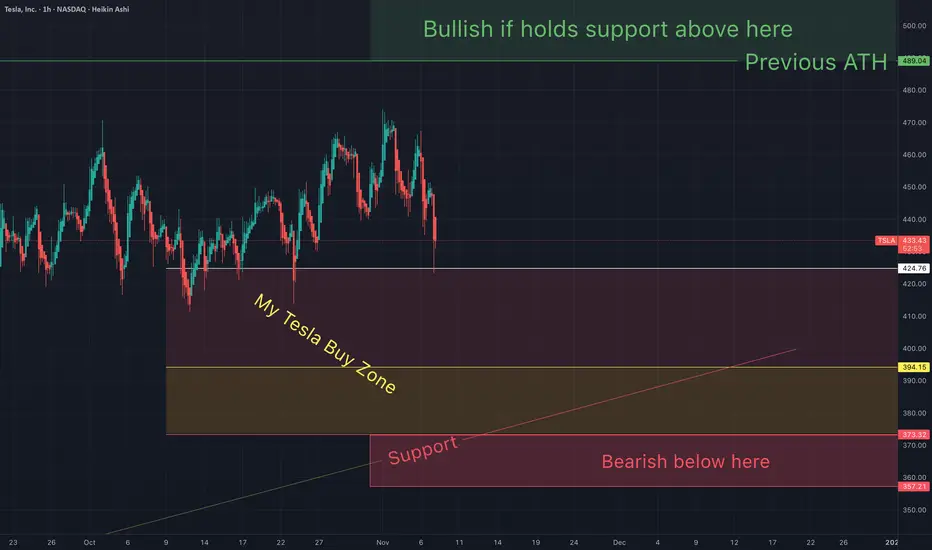
$TSLA could be pulling back right into 𝘀𝘂𝗽𝗽𝗼𝗿𝘁 NASDAQ:TSLA could be pulling back right into a major 𝘀𝘂𝗽𝗽𝗼𝗿𝘁 𝘇𝗼𝗻𝗲 𝗼𝗻 𝘁𝗵𝗲 𝘄𝗲𝗲𝗸𝗹𝘆 𝗰𝗵𝗮𝗿𝘁 𝗮𝗿𝗼𝘂𝗻𝗱 $𝟯𝟴𝟬.
This is the kind of retest that often decides the next chapter. Hold this level, and the structure stays intact with room to rebuild momentum. 𝗟𝗼𝘀𝗲 𝗶𝘁, 𝗮𝗻𝗱 𝘁𝗵𝗲 𝗱𝗼𝗼𝗿 𝗼𝗽𝗲𝗻𝘀 𝘁𝗼𝘄𝗮𝗿𝗱 𝘁𝗵𝗲 𝗹𝗼𝘄𝗲𝗿 𝘀𝘂𝗽𝗽𝗼𝗿𝘁 𝗻𝗲𝗮𝗿 𝟯𝟭𝟱.
tesla is bulish ...Two bullish scenarios are conceivable for Tesla: 1. A return to the broken level and a price pump 2. A move upwards without a return due to the intense buying pressure resulting from hitting the strong demand level.
lets see ....

TSLA: WaverVanir Edge – $TSLA Daily Outlook⚡ WaverVanir Edge – NASDAQ:TSLA Daily Outlook
NASDAQ:TSLA rejected from the 0.382 Fib ($466.9) and is hovering near $445, showing short-term weakness after an extended rally.
Auto-Fib map reveals liquidity clusters:
🟢 Premium Zones: $484 → $501 → $525 (target expansion levels)
🔴 Discount Zone: $411.6 major support
⚖️ Current equilibrium around $445 — consolidation before directional break.
WaverVanir DSS: Bearish divergence (−14% 30-day projection)
Institutional Model: Bullish rebound (+9% target → $485.6)
Edge Consensus: ⚠️ Range compression — volatility pocket between $411 and $466.
🌍 Macro & Catalysts
⚙️ FSD/AI expansion and Energy storage growth remain medium-term bullish
💰 Margins still under pressure amid price cuts & China competition
🏦 Fed tone mildly dovish → liquidity supportive, but yield volatility persists
🔋 Watch raw material cost trends (lithium, nickel) into Q1-2026
Base Path (WaverVanir Scenario):
Pullback → $420–$411 → re-accumulation → breakout >$466 to retest $484
“When volatility converges, conviction breaks. Patience over bias.”
#TSLA #WaverVanir #VolanXDSS #Fibonacci #SmartMoneyConcepts #AITrading #Macro #ElonMusk #StockMarket #RiskOn

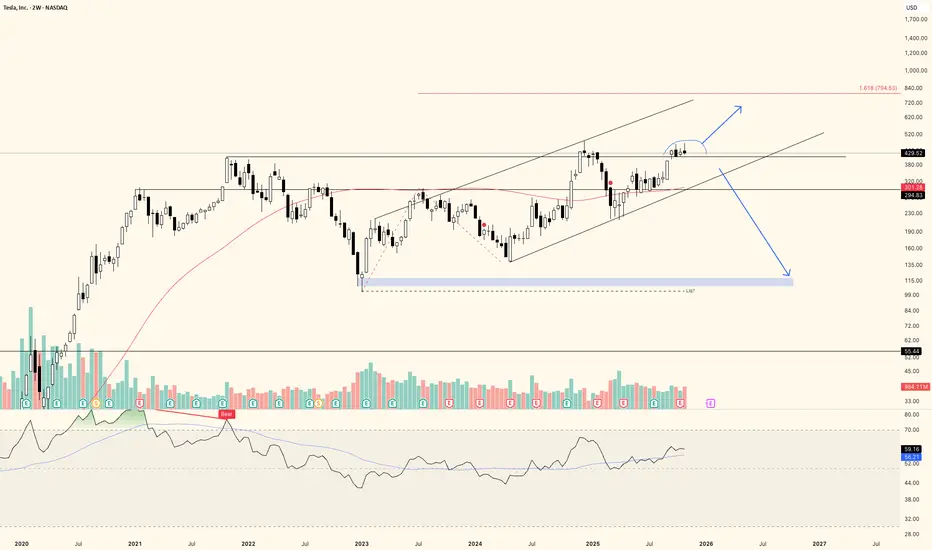
TSLA is giving mixed signals. Range low next move?I must say I have a very dualistic view on TSLA here. I think there is certainly a possibility of this becoming a prolonged consolidation with another move towards the downside of the range. On the other hand, that 1.618 extension to the upside als looks like a very valid target. Needless to say, while most people seem to stare blindly at TESLA great promises, I'm a little more skeptical to say the lest.
- Earnings have been going down over the years
- Revenue has stayed somewhat flat, with high odds of continuing to decline in China
- First their cars were going to change the world, then it was their energy solutions, then FSD became the narrative (Once done, FSD would instantly scale to worldwide usage and work everywhere, but currently their taxi service that would expand rapidly is geofenced), now Optimus is the narrative.
Elon is holding a carrot
- My point is: Elon is holding a carrot in front of us. I'm not saying Tesla is not doing great things. Their progress on FSD is real. But unless they will actually start to deliver real revenue and real profit, it will continue to be hyped up promises.
- For example, the EPS of XETR:VOW is 13x higher than Tesla's. Current Price to Earnings ratio for Tesla is at 300x.
So is it that weird to find that TA is giving mixed signals and possibly pointing towards range low?
Simple outlook
Anyway, this is my plan:
- I'll assume we are going up for 1.618 UNLESS
- We deviate back below previous ATH level. Then I think odds are starting to shift in favor of a bigger downward move.
Last Tesla (Macro) chart before ATHATH NEXT!
If I'm wrong, then I have "strict invalidations" with minimal loses...because of "proper risk management".
If I'm right then I'm taking an extended vacation.
May the trends be with you.
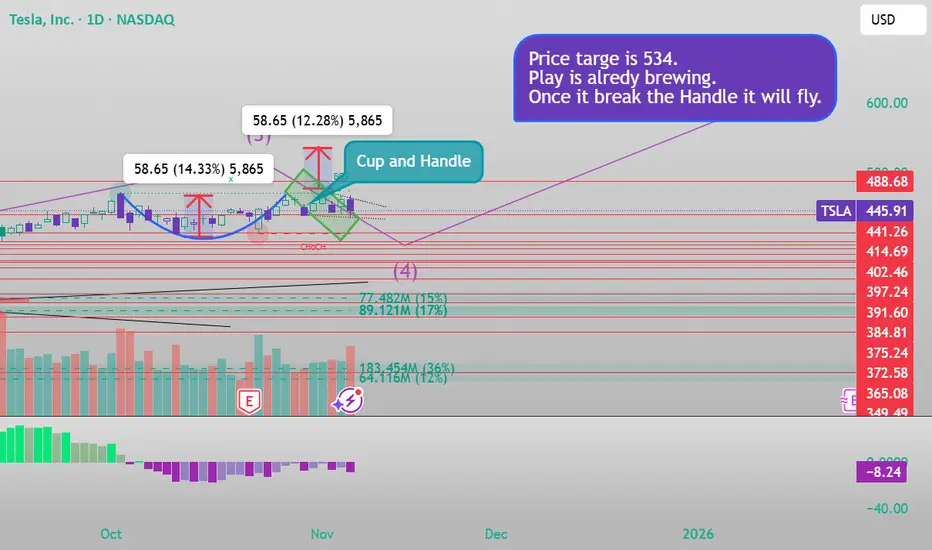
Cup and handleYou can see the cup and Handle in the Daily timeframe. It Will fly soon. My price target is 534 once it break the handle. You see this here at first.
X
@Sandeep194924
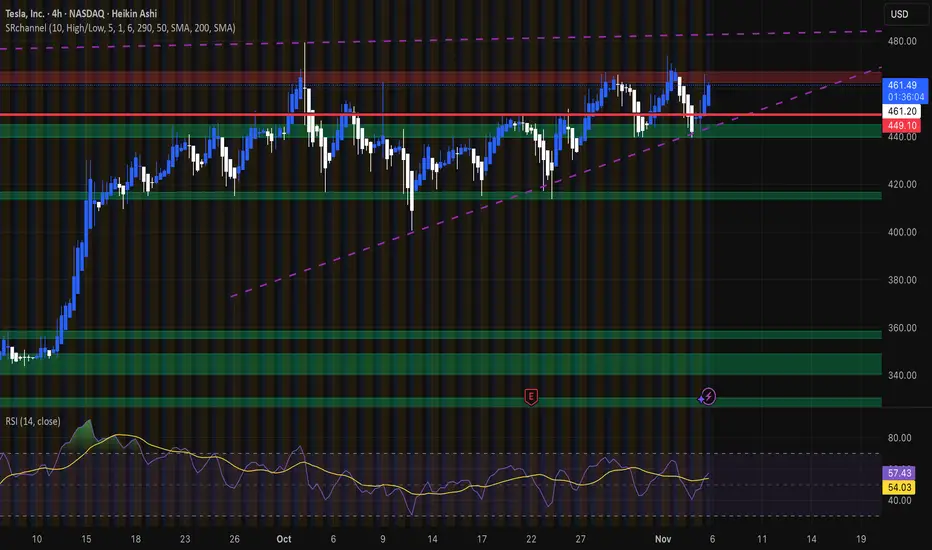
Dip to 449 and revers along with RSI divergenceTSLA can di tomorrow to 449 and reverse. a great swing possible with 449 entry l;eading to 460+
A short-term buy tradeCould this be a short-term buy trade?
Stop loss below $411.
The target profit could be around $670. Exiting in case of a change in conditions midway is also possible.

Emotional Trading AreaBehavior Analysis combined with your price-action trading skills can help tremendously in making your trading decisions. I believe that candlestick wicks (shadow) show us where traders will act emotionally before executing their trades. These wicks indicate earlier price rejection and create and area where emotions take over before execution. Decision time.

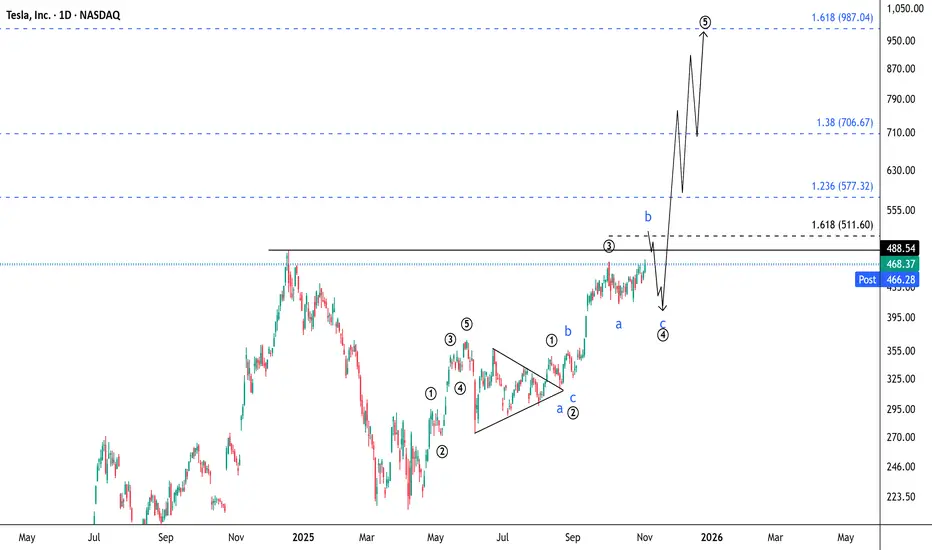
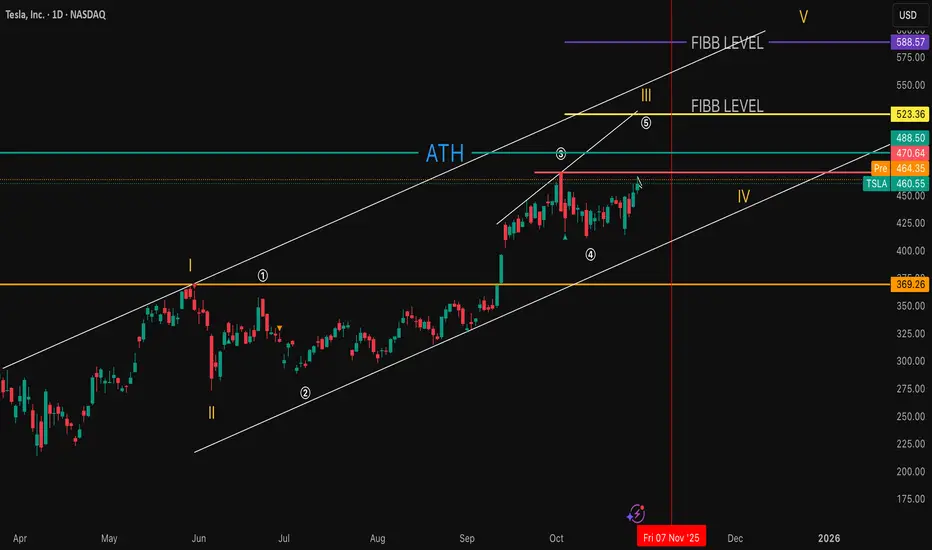
Tesla: A little Bit of Elliott Analysis Hello ,
Currently, Tesla is correcting in a wave (4), which is expected to end around the $(390-430) area.
After that, it will likely start wave (5), with the following possible targets:
1) 1.236 Fibonacci level $(577) .
2) 1.382 Fibonacci level $(706) .
3) It may even extend to the 1.618 Fibonacci level around $(987) .
After completing the fifth wave, the stock is expected to collapse and enter a deep, long correction.
Thank you .
Tesla shows bullish RSI divergence suggesting near-term rise Current Price: $456.56
Direction: LONG
Targets:
- T1 = $472.30
- T2 = $483.10
Stop Levels:
- S1 = $449.00
- S2 = $435.75
**Wisdom of Professional Traders:**
This analysis synthesizes insights from thousands of professional traders and market experts, leveraging Tesla's dynamic profile. The collective intelligence of seasoned traders points toward Tesla's potential upside driven by strong demand metrics for electric vehicles (EVs) and emerging resilience in EV adoption rates even amidst fluctuating macroeconomic conditions. By distilling these perspectives, investors can gain clarity on why Tesla remains a consistent focus of bullish narratives despite sector volatility.
**Key Insights:**
Tesla's stock is showing signs of bullish momentum as key technical indicators signal a potential upside breakout. A notable trend observed by traders is Tesla's consistently strong relative strength index (RSI) readings, currently hovering below overbought territory yet trending upwards. Additionally, robust demand in China and Europe for Tesla vehicles is expected to lift near-term revenues and margins. Tesla has recently diversified its product lineup by ramping production of lower-priced EVs while navigating supply chain challenges efficiently. Analysts also highlight Tesla's strategic lead in battery integration technologies as a critical factor for long-term success.
Tesla's continued expansion into autonomous vehicle software development and its implication for revenue diversity is another boost. Moreover, robust fleet adoption partnerships with commercial companies in North America have energized medium-term growth perspectives. Valuation debates remain heated, but efficacy in delivery records and a growing global EV acceptance validate Tesla's premium price point.
**Recent Performance:**
Recent movements show Tesla slightly recovering from a September correction, with current price consolidating around the $450-$460 band. The stock has gained roughly 3.5% month-to-date, supported by steady institutional buying and improved consumer sentiment as inflation rates moderate compared to earlier 2025. Tesla's 200-day moving average shows healthy support levels, reinforcing the recent bounce-back trend.
**Expert Analysis:**
Experts point to double-digit revenue growth potential for Q4 2025, alongside improving operating margins on the back of increased efficiency in Tesla's Gigafactories. Technical analysts highlight Tesla's recent MACD crossover, indicating bullish sentiment likely to strengthen in the coming weeks. Key resistance levels near $470-$475 could mark the next upward thrust. Economists also view Tesla as positioned to benefit from possible EV subsidies expansion in 2026, further enhancing its competitive positioning.
Tesla's valuation has sparked debate but continues to attract long-term focused investors due to its role in driving cleaner energy adoption globally. Numerous hedge funds have added exposure to Tesla as part of broader sustainability portfolios, suggesting confidence in future returns.
**News Impact:**
Tesla's announcement of expanding its charging partnerships with third-party automakers has garnered positive responses from both competitors and the investment community. This move empowers Tesla to monetize its expansive Supercharger network in 2026, propelling additional revenue streams. Alongside this, Elon Musk's confirmation of enhancing self-driving capabilities through cutting-edge AI technologies reiterates the firm's ambition to dominate the autonomous mobility space, which many experts believe will become instrumental in Tesla's valuation dynamics.
**Trading Recommendation:**
Tesla shows strong technical and fundamental indicators supporting a bullish outlook for the near term. Taking a LONG position at the current price of $456.56, with a stop-loss at $449.00 or $435.75 to limit downside risk, provides a favorable setup for capitalizing on expected price appreciation. Key levels above $470 indicate potential gains, especially if Tesla meets or exceeds expectations in next quarter’s earnings or announces groundbreaking technology advancements. Investors should remain vigilant of broader macroeconomic developments while leveraging Tesla's proven resilience and market-leading vision.
Do you want to save hours every week? Register for the free weekly update in your language!

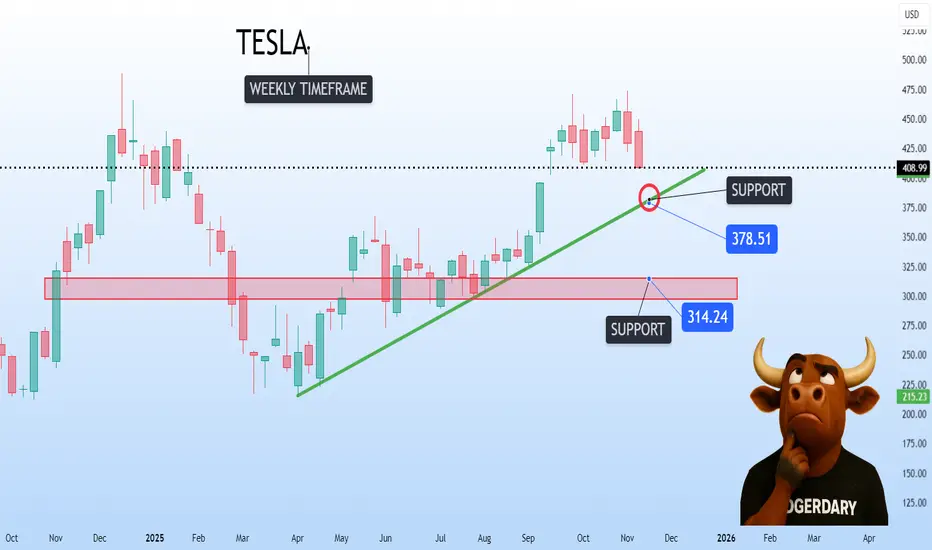
Tesla Share Price at Key Technical LevelTesla’s share price has returned to a well-established upward trendline. The key question now is: will this trendline act as support and trigger a bounce, or will it be breached, attracting further selling pressure and pushing the price lower?
We’d love to hear your thoughts — will the bulls defend this level, or are the bears gaining ground?
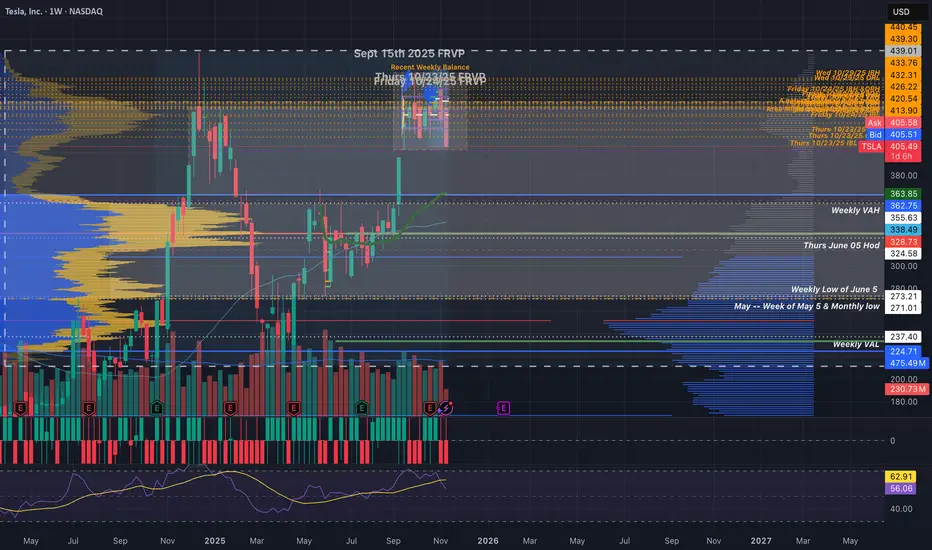
TSLA, consolidation below ATH often leads to a breakout..Tesla sentiment was very negative in April as Trump and Elon argued online causing a lot of whipsaw volatility and scaring out investors. The bottom quickly followed.
Price is ranging below all time high. Price is above the weekly pivot and 200EMA which is bullish and has momentum.
Wave © of C appears to be underway into price discovery with a target of $693 the R2 weekly pivot. This is because it has been printing a series of 3 wave structures. Wave B printed a triangle which is a pattern found before a terminal move reinforcing the Elliot wave count.
🎯 Terminal target for the business cycle could see prices as high as $690 based on weekly pivots
📈 Weekly RSI is just below oversold with no divergence and can remain here for months as price keeps increasing.
👉 Analysis is invalidated if we close back below wave (B), $280

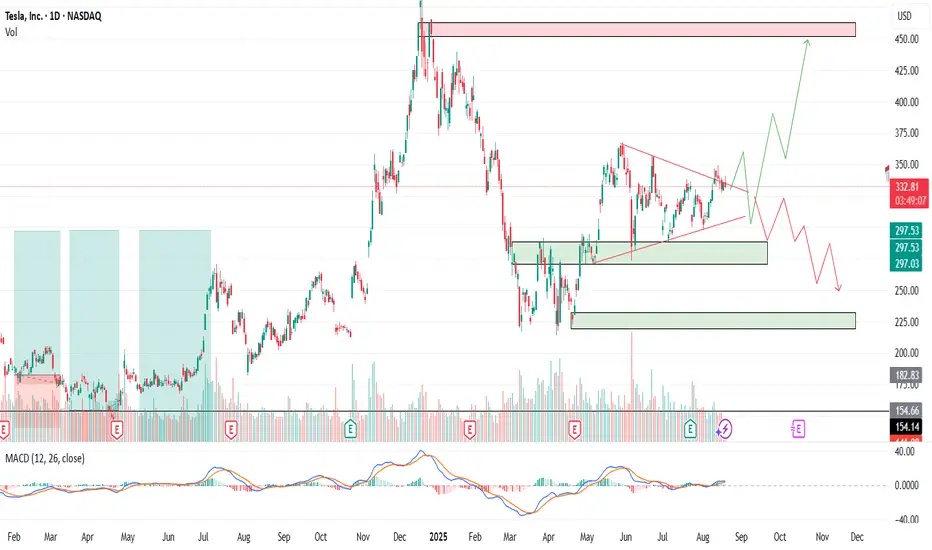
TSLA – Buy the Fear or Wait for the Setup?Tesla (TSLA) is once again in the spotlight. Between robo-taxi hype, new product launches, and ongoing political noise around Elon Musk, the stock has become one of the hottest trading stories on the market. But as always the chart tells us where to act.
Entry Levels
$330 – First line of defense, early buyers may step in here
$295 – Stronger support, better reward-to-risk zone
$255 – Deep pullback level, only triggered on market weakness
🎯 Profit Targets
TP1: ~$345 → ~5% move from $330 entry
TP2: ~$370–$380 → 12–15% move depending on entry
TP3: ~$400–$420 → 18–20% move on a sustained breakout
Tesla remains a trader’s stock: volatile, narrative-driven, and technically reactive. If it holds the $330 zone, momentum traders could see a quick bounce. If we dip to $295 or even $255, that could be the bigger opportunity for those with patience.
No one knows which path the market chooses, but the plan is set. Trade the structure, not the noise.
⚠️ Disclaimer: This is not financial advice. I’m sharing my personal analysis and trade levels. Always do your own research and manage risk responsibly.
Going Short TESLA HereTrading Fam,
I'm taking my first ever short here since implementing my new indicator. It has been killing it on the long side. We've exited our last 17 trades, all for wins, with an average profit of 30% per trade and our portfolio is up over 86% on the year. Now, it's time to test the short signals. We received two here on TSLA. I've taken a small entry since this is my first short, representing around 9% of the portfolio total. I'm going to target $350 but will not take more than a 7% loss, thus my stops are set at $476 bring the rrr on this trade entry to 1:3. Let's see how this goes.
✌️Stew

TSLA Bullish Breakout? Flag Resolution Toward 525–530Hello, traders. TSLA’s 1D chart has been trending higher since the early-September breakout, then cooling into a neat bull flag. Price is holding above the MA20, MA60, and MA120, with the MA20 around ~$440 acting as first dynamic support. Volume expanded on the run-up and faded during the flag—classic continuation behavior—while volatility has eased but remains elevated.
The key battleground is the resistance at $481, the early-October peak and upper boundary of the flag. A daily close above $482 would confirm the breakout and put the psychological $500 on the table, with extension toward the $525–$530 supply zone if momentum and volume expand. If buyers don’t force the break immediately, a dip toward the $430–$440 area (near MA20) is a constructive retest zone before another attempt at the highs.
The idea fails on a decisive daily close below $415. That would break the flag support, flip the short-term structure, and expose downside toward the MA60 region near $390. Until then, the primary path favors continuation: breakout entries on a daily close >$482, with partial profits near $500 and runners into $525–$530; conservative stops live below $415–$417 depending on tolerance.
This is a study, not financial advice. Manage risk and invalidations.

TSLA | Smart Money FlowNASDAQ:TSLA | Smart Money Flow
Tesla’s building pressure right at the distribution zone (460–470) liquidity’s loading up top.
Below sits a clean accumulation block (400–430) stacked with FVGs waiting to get tapped.
A quick sweep → bounce from that zone could send it straight toward $500+.
Structure still clean, bulls still in control.

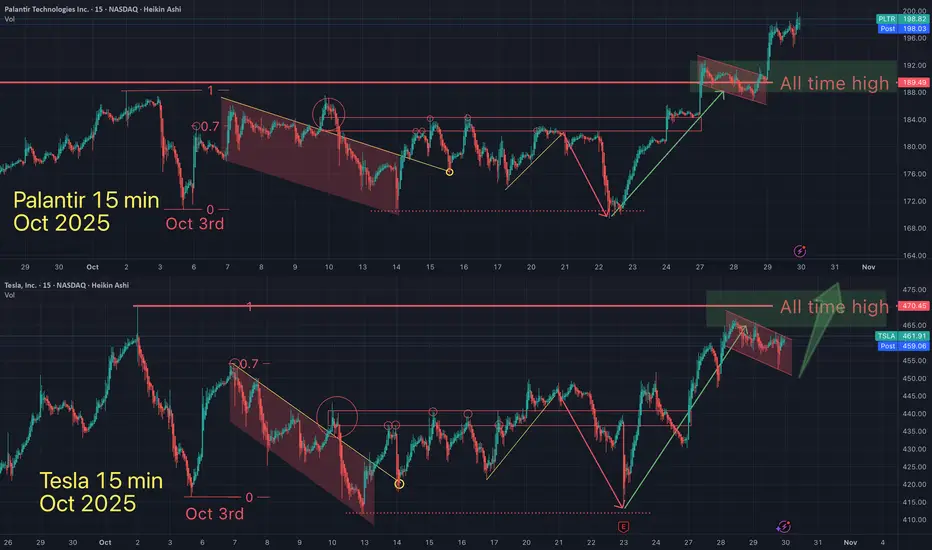
You will ask yourself, "how did he know Palantir would do that"?On Oct 7th I suggested that Palantir & Tesla were in a very bullish long term pattern and were both about to *soon break out into new all time highs (ATH). Palantir just did...is Tesla next?
Blow off top next?
May the trends be with you.
Tesla Consolidates Before Next Bullish BreakoutTesla Consolidates Before Next Bullish Breakout — Eyes on $550, $600, and $650 Targets
Tesla’s price action has formed a series of bullish continuation patterns, each followed by strong upward moves. Currently, the stock is consolidating between $413 and $470, creating a potential accumulation zone before the next breakout.
The repeated triangle breakout patterns suggest a continuation of the bullish trend if Tesla manages to hold above the $413 support level.
Once price breaks above the $470 resistance, Tesla could accelerate toward the next targets at $550, $600, and $650, as indicated on the chart.
In the short term, some sideways movement within the current range is possible before the next strong impulse upward.
You may find more details in the chart!
Thank you and Good Luck!
❤️PS: Please support with a like or comment if you find this analysis useful for your trading day❤️

TSLA is going UP! .. time to buy!Tsla aka Tesla was stuck in-between 2 powerful support and resistance zones (the red and green lines) .. It finally broke to the upside and broke above the resistance level. It is now very likely to head to the next resistance zone which was the previous high (the next resistance zone has been drawn as the white line shown on the chart) - this is where we will be taking profit at. BUY NOW!

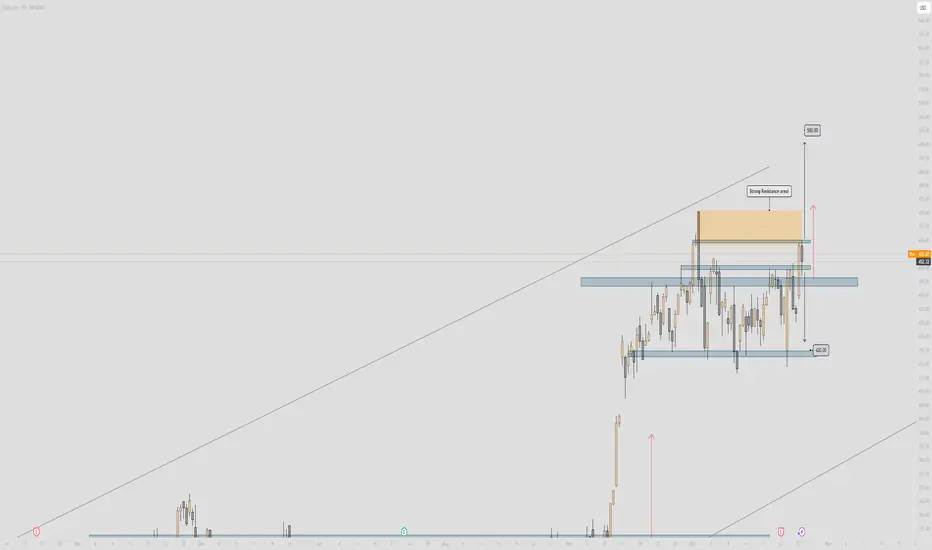
TSLA - Important!🔥 Tesla Analysis (Daily Structure) 🔥
Alright, let’s break this one down 👇
🧱 Structure Overview
Tesla’s price is currently hovering around $452, sitting right below a major resistance zone between $455 – $470 (highlighted in orange). This area has acted as a strong ceiling multiple times — every approach has been met with rejection pressure.
Below, the support floor sits clean around $420 – $425, which has been holding the range low for a while. We’re essentially trapped in a sideways consolidation box — a range between that $420 low and the $470 resistance cap.
🧭 Bias
Current structure = Neutral to Bearish
Price just wicked into resistance, showing signs of rejection. Unless we see strong follow-through above $470 with clean volume, this is likely a reaction zone for shorts.
💡 Key Zones
Resistance (Sell Zone): $455 – $470
Strong supply — expect sellers to defend this area.
Support (Buy Zone): $420 – $425
Range demand base — liquidity resting below.
🎯 Scenarios
Bearish Setup (Higher Probability for Now)
If Tesla fails to break and close above $470, look for a move back down to $420 — possibly a liquidity grab under the range. Confirmation would be bearish engulfing or a strong rejection candle from resistance.
Bullish Setup (Breakout Play)
If price cleanly closes above $470 and retests it as support, we could open the door toward $500 (measured move target). That’d be a breakout from the range and continuation of the larger bullish channel.
⚖️ Risk Management
Bears: Stop above $475 – $480
Bulls: Stop below $445 if entering after breakout retest
Keep R:R ≥ 1:2
🧠 Summary
Tesla’s in a tight range — smart money likely accumulating or distributing near these highs. Watch for rejection signs around $470 for short plays, or confirmation above it for the next leg to $500.
This is the make-or-break zone — the next move will define Tesla’s mid-term direction. ⚡️