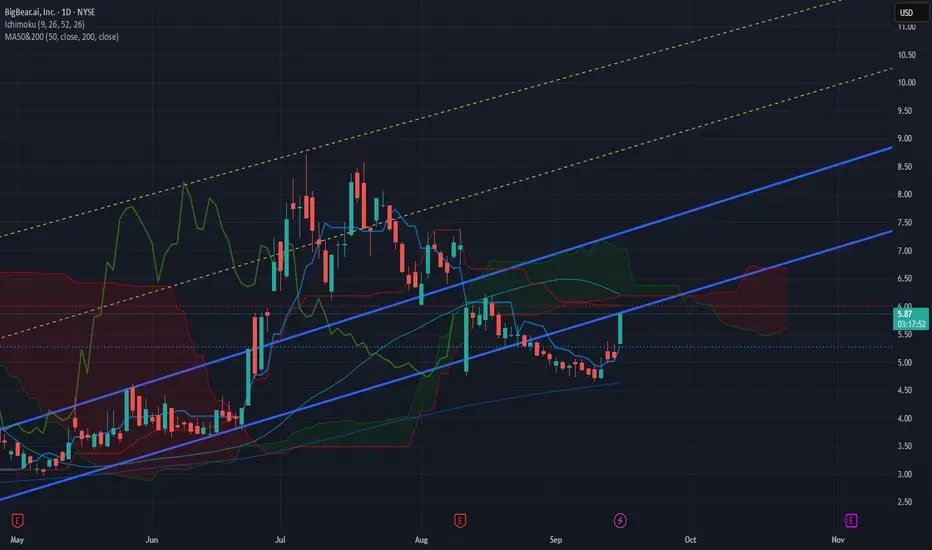
Ichimoku patternlooks like a prime time to scalp. First green is usually the biggest gamble but as long as you close above the cloud watch the next 2 candles very carefully.
if there are 3 green confirmed candles above the cloud then we are ready for a run, hold safely until exit sign shows
If there are no 3 consecutive green candles above the cloud, then scalp the trade as soon as possible
BBAI trade ideas

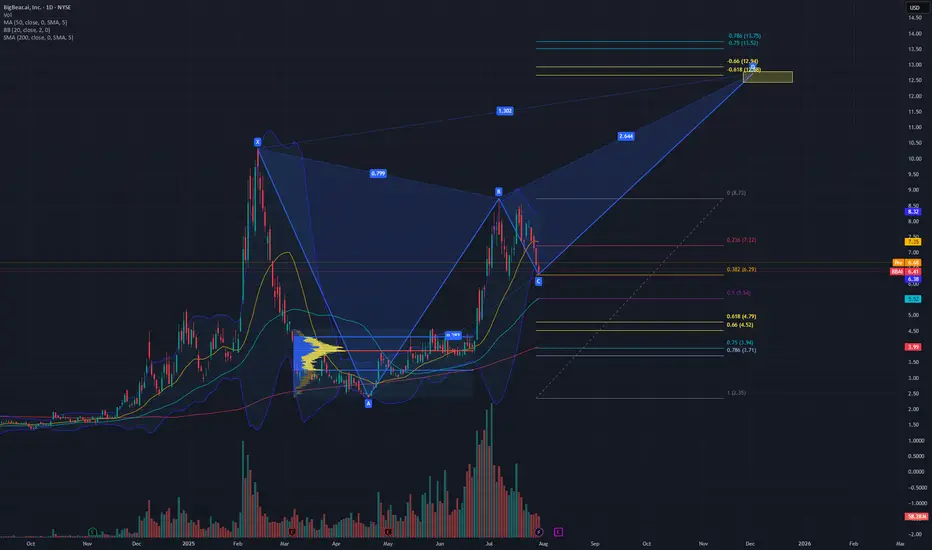
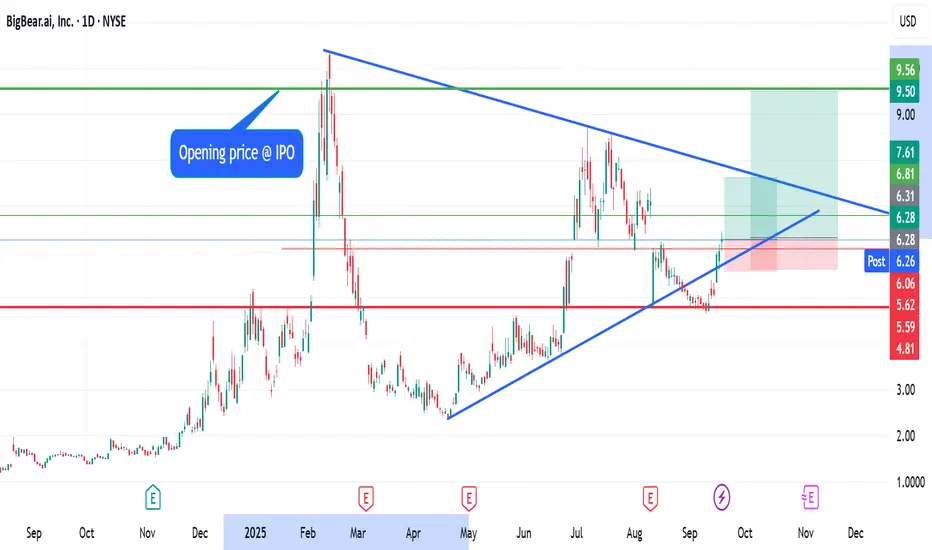
XABCD pattern playing out $12 targetBBAI is looking like it will play out the XABCD butterfly pattern if it continues to rally from the .382 of the pull back from previous $2.35 lows and 8.73 highs.
Breaking down and close below the $6.06 daily candle will potentially expose the previous consolidation POC at $3.87, which is a .75 pull back.
Using Fib time, I am expecting a $12 range around this year in December.
Will look to open a 7/12 bull call spread at Jan 2027 exp.
BBAI - Analyse Update - Soon 8.50?Good Evening Everyone,
For this Weekend last one i would like to share is Analyse Update for BBAI - Big Bear AI
My previous analyse you can find it below:
It got the good support in 4.75 - 4.80 level and then gained approx %40 and get in the Trend channel again. Yellow path is from my previous analysis and red and green ones are new ones.
So First strategy to wait to pull back till 6.00 - 6.10 then from this level buy and sell in 8.50 which is approx %40 gain .
Second one , if it breaks to resistance level which is 7.05 - 7.10 and stay above from this level for 2 days then i would try to buy and target is same 8.50 which is approx %20 gain.
There is a potential to see 10.50 for me and i will watch BBAI tomorrow then i will decide what to do. For a long term i am planning to put some money on it as they are doing good things to provide long term success and next 2 - 3 years we can make good money on BBAI.
For short term you can watch the levels that i shared ;)
This is just my thinking and it is not invesment suggestion , please do not make any decision with my anaylsis.
Have a good start a Weekend to All.

2 green candles after cloud for BBAI = super bullishsomeone asked in one of my earlier posts what's the cloud?
the cloud is the big GREEN or RED function based on ichimoku trading.
I previously stated if there are 3 greens candles after the ticker crosses the cloud, we are in for a very strong positive uptrend that we should follow by increasing our stop losses to the 50MA. (or if you're super conservative the 21MA)
Super bullish outlook for me, if you were buying below the blue as I said, you're golden. but we can also skim short term trades if thats what you desire by buying inside the blue channel and selling at or above yellow. I am quite convinced we will be trading in this zone for the rest of the year into next.
I am ~1000 shares deep

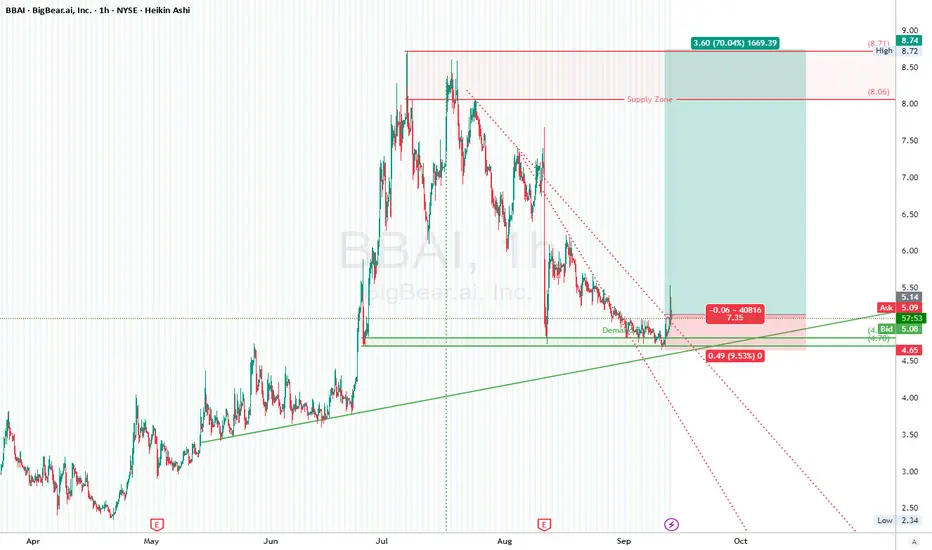
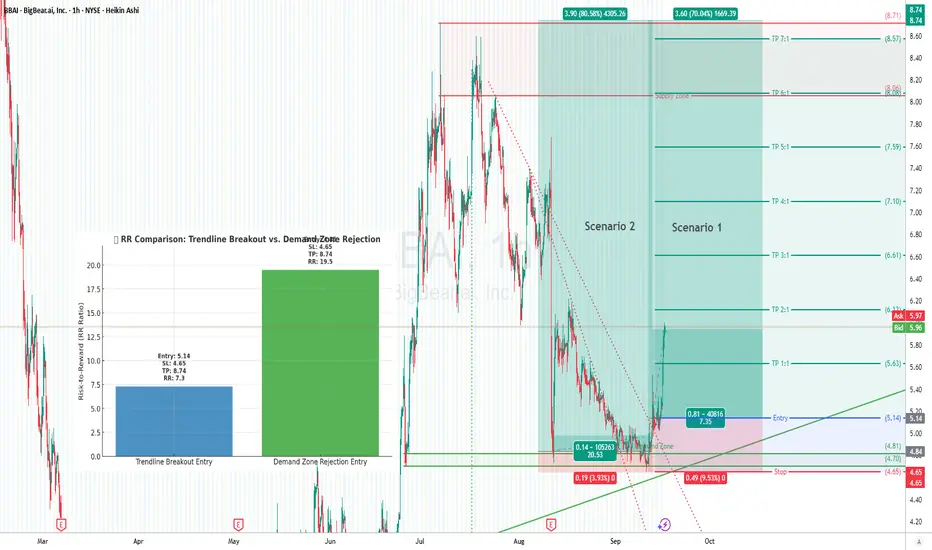
BBAI (BigBear.ai Inc.) 1H TF Long Setup
BBAI printed a strong impulsive move back in June–July, rocketing from the $2.30s to highs of ~$8.70. This parabolic leg showed heavy momentum and FOMO-driven inflows. Since topping out in early July, the stock retraced deeply into a corrective descending channel, printing lower highs and lower lows, respecting a key downtrend resistance (dotted red).
Now, price just tagged a confluence demand zone:
Rising long-term trendline from April lows
A bullish engulfing candle just printed at demand, indicating smart money reaction and potential trend reversal. Price broke out of the falling wedge, hinting at the end of the correction.
BBAI is often grouped in with AI sympathy plays (alongside PLTR, C3.ai)
Any defense contracts or AI policy headlines can spark aggressive upside moves
Trend & Breakout Analysis
Downtrend broken (falling wedge breakout)
Currently retesting the breakout level
Bounce from the demand zone aligns with trendline and horizontal support
Key Zones
Demand Zone: $4.60–$4.80 (tested + bounce confirmed)
Supply Zone: $8.00–$8.70 (profit-taking zone / target)
📈 Trade Setup
Entry $5.13 (current breakout retest)
Stop Loss $4.65 (below demand zone + trendline)
Take Profit $8.70 (previous high + supply zone)
Risk/Reward 1:7.35
Capital Risk % Max 1–3% per trade
Trade Management Move SL to break-even at 1:1 RR (~$5.60)
Scale in on confirmation candles above $5.30 (to avoid fakeouts)
Scale out 50% near $7.00, rest near $8.50–$8.70
"The market is a device for transferring money from the impatient to the patient." – Warren Buffett
⚠️ Disclaimer
This is not financial advice. Trade at your own risk. Do your own research and only risk what you can afford to lose.
#BBAI #AIstocks #TechnicalAnalysis #BreakoutTrade #ElliottWave #SupplyAndDemand #TrendlineBounce #RiskManagement
BBAII to the Moon 🚀 BigBear.ai (BBAI) is heating up the charts! 📈 Dive into this gem from "thecryptoleo" (Sep 23, 2025, 08:58 UTC)! From a gritty $1.20 low in mid-2025, it’s soared to $6.05 today (+3.81%, 134M vol! 💥). The 4 EMAs (5.69, 5.35, 6.16, 4.72) and Madrid Ribbon flipping green 📊 scream bullish momentum! That upward trendline from the bottom? It’s eyeing $10+ by 2027—dream big! 🤞 The "buying more options" dip is a savvy play 🎯. AI hype and Fed rate cuts have juiced 275% YTD gains 🎉, but hold tight—Q2 revenue slipped 18% to $32.5M with widening losses 😬. High risk, high reward vibes—perfect for wave-riding traders! 🌊 Watch for resistance at $7.20-7.30! #BBAI #TradingView #AIStocks

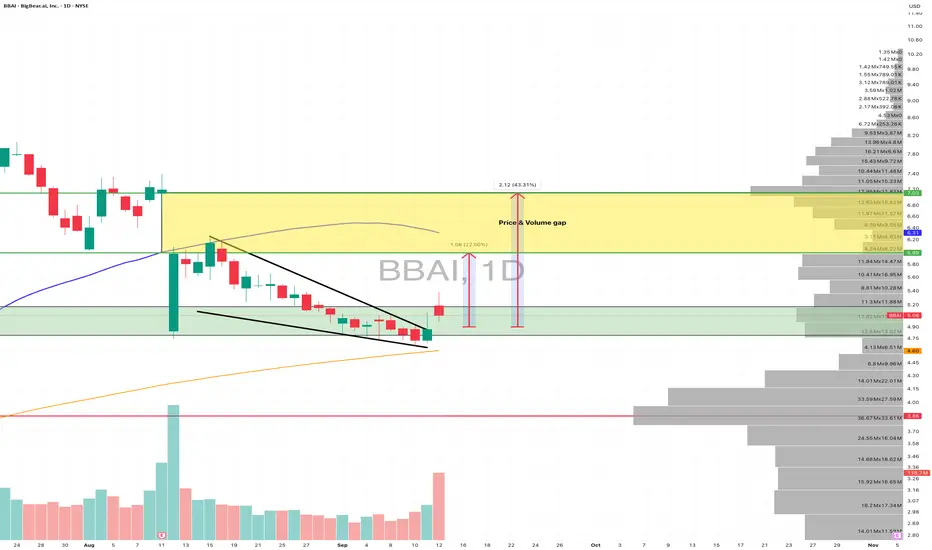
$BBAI Weekend analysis - 21st September, 2025Textbook move last week - price broke out of the falling wedge, filled the gap between 5.99 - 7.03 (missed the top by just 9 cents), and kept momentum strong. I still expect upside to continue, though we might see some consolidation along the way.
Next resistance levels/targets I’m watching are 7.33 and 7.9–8.3 (previous S/R zone). For those eyeing a re-entry, a pullback into the 6.17–6.3 area looks solid - that’s where the daily 50 SMA and 4H 9 EMA line up.
BBAI - Time to add after a strong reboundNYSE:BBAI is coming back strong and is likely to see strong rally ahead after rebounding at US$5.00 psychological level. Stochastic has crossover near the oversold region and 23-period ROC has just turned positive. Ichimoku shows two out of three bullish crossover. Given the momentum, BBAI is likely to break through the gap resistance between 6.20-6.82. Target over the long-term is at 16.00

My long buy for BigBear AIMy long buy for BigBear AI.
BigBear.ai (BBAI) rose today largely due to a mix of speculative and fundamental factors.
Investors are also reacting positively to the company’s deployment of biometric passenger processing technology at major ports and its positioning to benefit from rising government and defense spending on AI solutions.
Although BigBear.ai’s recent financial results showed revenue declines and reduced guidance, today’s surge reflects strong market optimism about its future opportunities rather than immediate earnings strength.
My Buy View:
Entry: $6.3
Target TP: $9.5
Expected return: approx 50%
Mid to long-term holding: 3 months or more
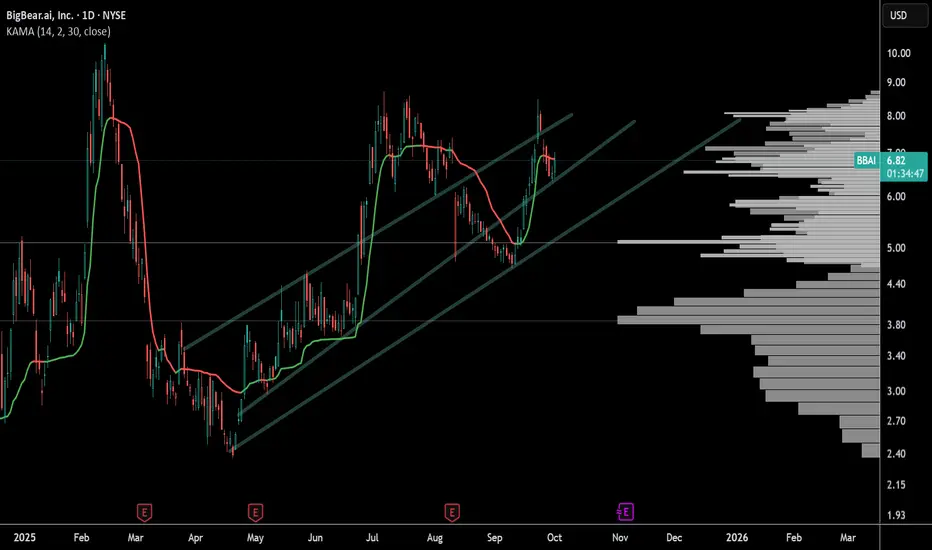
BBAI seems to have support on intermediate trendlineBigBearAI seems to have found support on the rising intermediate trendline, and the price is moving upward from there. However, the Kaufman Moving Average above is the key level to clear. If the price breaks through and closes above it today or tomorrow, we can expect the upward move to continue.
$BBAINYSE:BBAI had a very stong move so far. these levels are to watch not to trade. If we have any close above 8.62 levels with some risk management we can target previous ATH at 10.25 and next fibo level at and 12.47

BigBear.ai, Inc. (BBAI) Expands AI Defense SolutionsBigBear.ai, Inc. (BBAI) provides artificial intelligence-driven decision support solutions for government, defense, and commercial markets. Its technology helps organizations process complex data, improve forecasting, and optimize operations in real time. BigBear’s growth is fueled by rising demand for AI in national security, partnerships with U.S. defense agencies, and expanding applications of its platforms in commercial industries seeking smarter, data-driven insights.
On the chart, a confirmation bar with rising volume highlights bullish sentiment. The price has tested the corrective zone after moving off of the .618 Fibonacci level. A trailing stop can be placed just below this Fibonacci line using the Fibonacci snap tool, helping traders secure profits while leaving room for more upside potential.

Demand Zone Rejection vs. Trendline Breakout📚 Trading Education:
Demand Zone Rejection vs. Trendline Breakout Entries
In trading, where you enter makes a massive difference in your Risk-to-Reward (RR) ratio. Two common approaches:
🔹 Scenario 1: Entry at the Trendline Breakout
Wait for confirmation → price breaks the downtrend line.
Entry: $5.14
Stop Loss: $4.65 (below demand)
Risk: 0.49
Target: $8.74
Reward: 3.60
RR = ~1:7.3
✅ Higher probability (confirmation from breakout).
❌ Smaller RR because you’re entering later.
🔹 Scenario 2: Entry at the Demand Zone Rejection
Enter aggressively on the first demand zone bounce.
Entry: $4.85
Stop Loss: $4.65
Risk: 0.20
Target: $3.90 upside → $8.74
Reward: 3.90
RR = ~1:19.5
✅ Insane RR potential.
❌ Higher risk of fakeouts (price might pierce deeper before breakout).
The Takeaway
Breakout Entry = safer, confirmed, good RR (~1:7).
Demand Rejection Entry = aggressive, riskier, but monster RR (~1:19).
👉 The best traders scale in: small position at demand, add on breakout. That way you capture the high RR edge while also waiting for confirmation.
⚖️ Risk Management Rule
Always risk just 1–3% of account equity.
Huge RR setups don’t mean overleveraging — stick to risk discipline.
"Opportunities come infrequently. When it rains gold, put out the bucket, not the thimble." – Warren Buffett
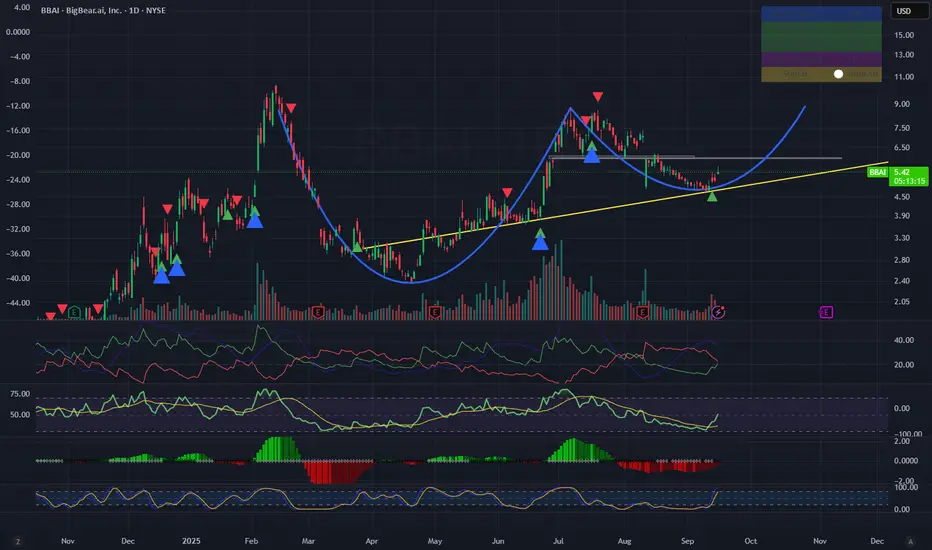
follow up to older BBAI postlook at that, we hit the bottom of the blue channel like i mentioned.
Like i said before thats that Cash Secured Puts line. Buy below or within the blue and sell in the yellow.
Not sure what else to tell yall. the proof is in the pudding
BBAI – Cup & Handle Breakout Potential | Watching the $6 Level
BigBear.ai (BBAI) is developing a **classic Cup & Handle formation** after months of consolidation and accumulation.
The stock is currently trading around **$5.3–5.4**, sitting right above its long-term ascending trendline, and approaching a critical resistance zone.
---
## 🔹 Technical Setup
- **Pattern:** Well-defined Cup & Handle, historically a bullish continuation pattern.
- **Support:** Trendline around **$5.0** has been tested multiple times and held.
- **Resistance / Breakout Zone:** **$5.8–6.0** → key level to watch.
- **Upside Targets:**
- 🎯 First target: **$6.8–7.0**
- 🎯 Secondary: **$7.5–8.0**
- 🎯 Extension: **$8.5–9.0** if momentum continues
- **Invalidation:** Breakdown below **$4.9** negates the setup.
---
## 🔹 Fundamental & Sentiment Context
- 💰 **Cash Position:** ~$390M cash on hand.
- 📦 **Backlog:** ~$380M in contracted revenue.
- 📉 **Challenge:** Q2 showed an **18% YoY revenue decline** and lowered FY2025 guidance ($125–140M vs. $160–180M). Profitability remains an issue.
- 📊 **Market Sentiment:** High short interest (~70M shares) → potential for a **short squeeze** if breakout confirms.
- 🛡️ **Competitive Landscape:** Palantir secured large contracts, but BBAI still has niche opportunities in AI/defense.
---
## 🔹 Trading Thesis
The setup is clear: **Cup & Handle nearing breakout**.
If BBAI **closes above $6.0 with strong volume**, probability for a continuation move toward **$7.5+** increases significantly.
Risk/reward looks attractive for swing traders, but discipline and risk management are critical.
---
## 📈 Conclusion
BBAI is approaching a **technical inflection point**.
A confirmed breakout could unlock strong upside momentum, fueled by technical structure, liquidity, and short interest dynamics.
However, fundamentals remain mixed → this is primarily a **technical swing setup** rather than a long-term investment thesis.
---
⚠️ **Disclaimer:** This idea is for educational purposes only and does not constitute financial advice.
Always conduct your own due diligence and manage risk accordingly.
BBAI falling wedge breakoutI usually dont like trading low priced stocks - barrier to entry is too low and weak hands cause noise. Technicals look good: falling wedge breakout with a dragonfly Doji candle (if youre a nerd), MACD trying to cross over, RSI and Williams lower indicators curling off lows. I would not go nuts deep to start. Target 5.90ish and gap fills at 6.74...
Overall, im cautious the market at these levels.
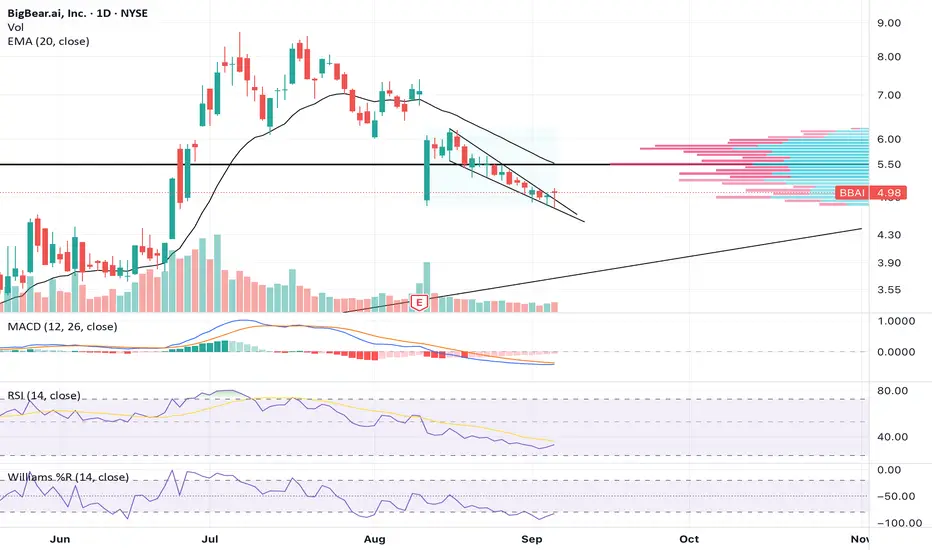
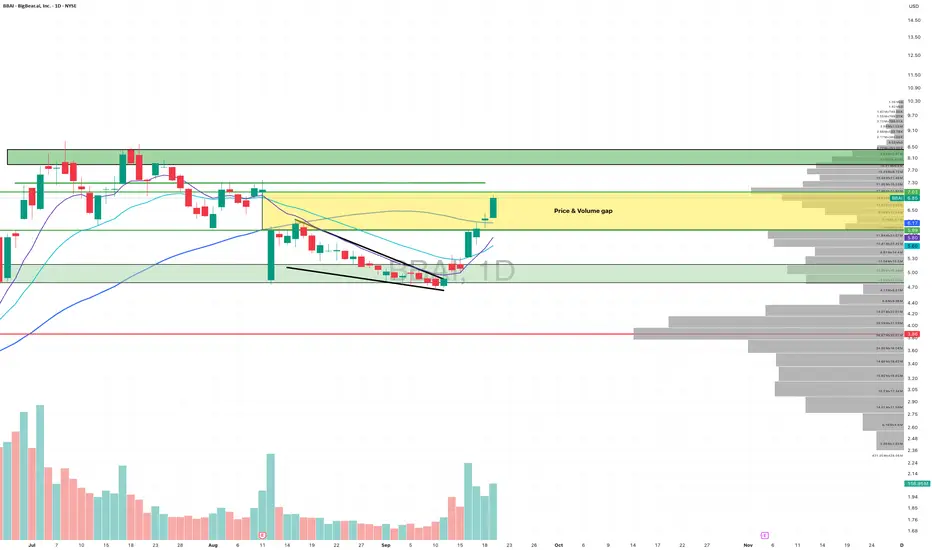
$BBAI Weekend analysis - September 14th, 2025Tried to break out of that falling wedge on Thursday’s news, but the move didn’t quite have the juice yet. Still, the chart looks like a bottom might be in, and if that’s true, we could be setting up for a strong push higher.
First targets I’m watching: $5.43 (4H 50DMA), then $5.99 (wedge breakout calculated target). If we can get a solid close above $5.99, that opens the door toward $7 thanks to the big price/volume gap (yellow zone) that usually acts like a vacuum.
I’m already in this trade - but if we close under $4.6 - 4.65, I’ll admit the setup is broken.
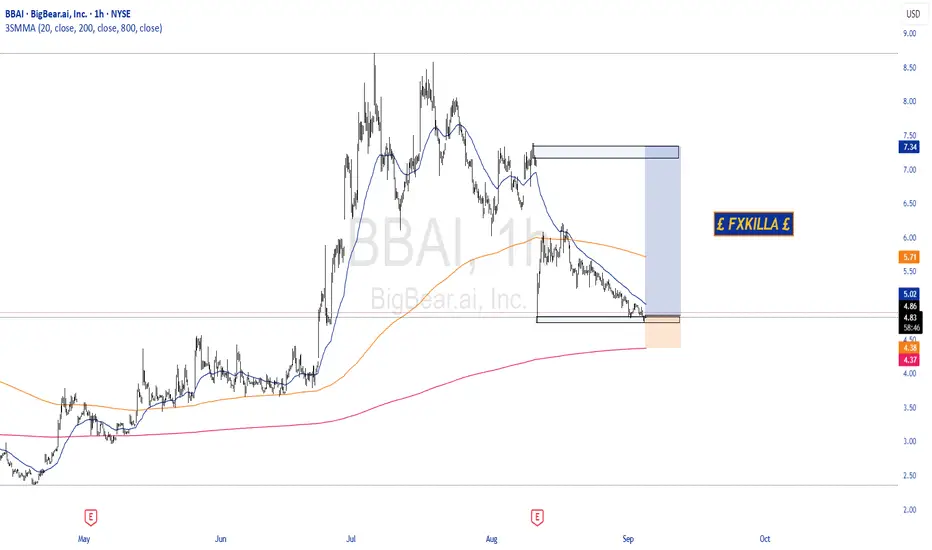
BBAI HIGH PROBABILITY SETUP SOON!!🚨 BBAI HIGH PROBABILITY BUY SETUP 🚨
* Here We Can See Clearly The Next Potential Move For BBAI Coming Hours/Days.
* Keep Your Eyes Close On Your Trading Positions.
* Happy PIP Hunting Traders.
FXKILLA
BBAI short term trade cyclesthis ticker is just gonna pump up and down like a kangaroo.
im earning percentages by buyin in blue channel and selling in yellow
conversely you can cash secured puts at the bottom blue line in accordance with the time frame, own shares and sell at yellow channel.
or if you want to close your eyes wait 2 years and itll pump to 30

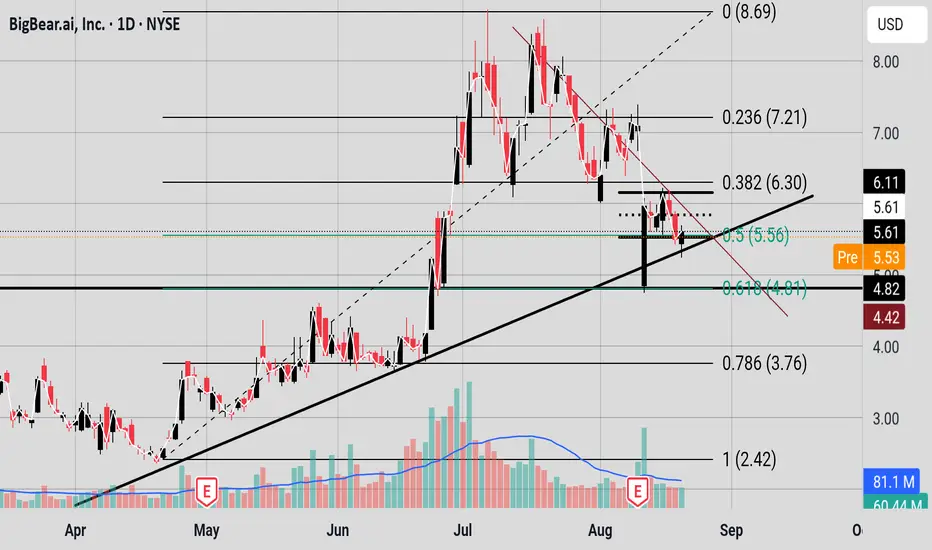
Bulls vs the BearsBulls need price to make HHs and HLs from the 6.30 price area and bears need LL and LHs from the 5.56 area.
BBAI - BigBear what is next?Hello Everyone,
I have published my analysis before BBAI publish its Q2 Financial Report. You can access it here:
So as all of you know that there is a big miss on EPS therefore it dipped almost %35 after Publishement.
I am still optimistic about BBAI and i think last dipped price provided really good opportunity to make a quick gains.
Now , next Week i will watch the folloeing levels:
5.30 - UP Trend support level
5.00 - Previous Resistance new Support level.
If it breaks the 5.00 then this confirmed the end of UP Trend then there is a possibility to reach 3.50 - 3.60 which is approx %40 down from today's price level.
If it achives to stay above 5.90 - 6.00 (50 EMA Level - Green Line in Chart) next week then this is a confirmation for me contunious of UP Trend and it can reach the 7.00 - 7.30 which is approx %20 up from today's price level.
So i draw 2 possible pattern as well -Red one and Yellow one.
I tried to analyze possible scenarios and possible entry points to watch.
Hope it helps you to make a decision in BBAI.
This is just my thinking and it is not invesment suggestion , please do not make any decision with my anaylsis.
Have a good start a Weekend to All.

BBAI: Just a reasonable shakeoutBBAI:
Just a reasonable shakeout.
Big demand zone will obsord the supply soon at the expected priced.
.
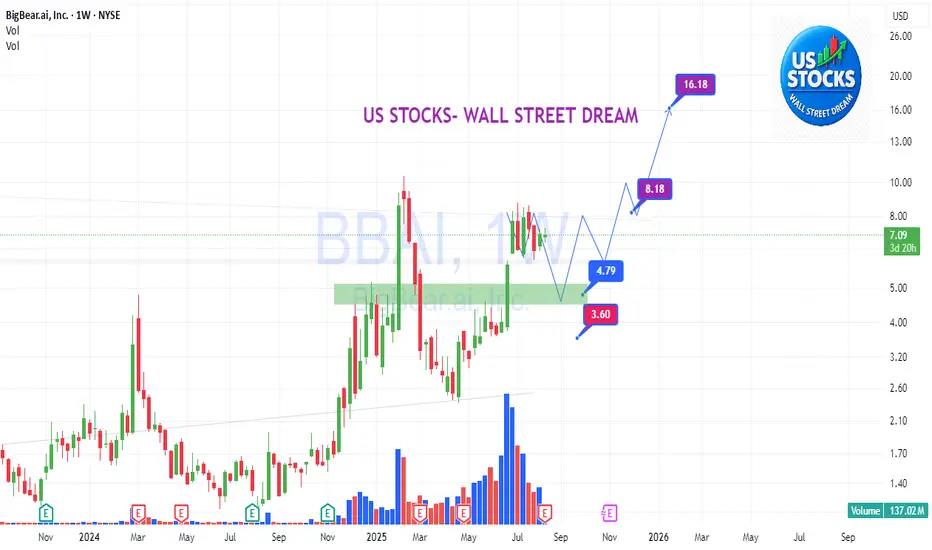
US STOCKS- WALL STREET DREAM- LET'S THE MARKET SPEAK!
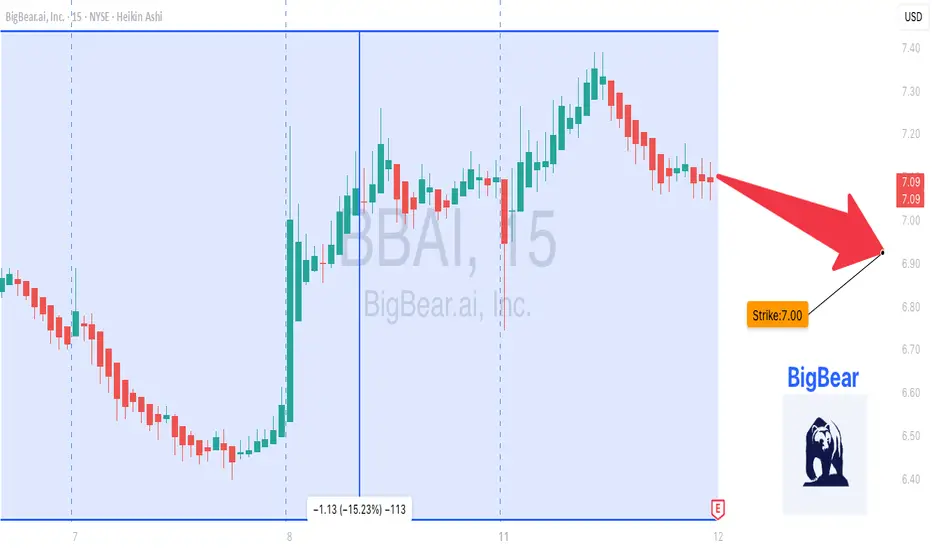
BBAI Earnings & Options Snapshot (2025-08-11)🤖 BBAI Earnings & Options Snapshot (2025-08-11)
### BigBear.ai \ NYSE:BBAI — **Moderate Bearish Setup**
---
### ⚡ Quick Highlights:
* **Revenue:** +4.9% TTM growth — modest but stable.
* **Margins:** Profit margin -143.7%, operating margin -56.1% — deep losses despite 28.5% gross margin.
* **Guidance History:** Weak — only 38% beat rate, avg surprise -182%. Forward EPS estimate -\$0.20.
* **Analyst Sentiment:** Bearish, target \$5.83 vs current \$7.14 — downside risk looming.
### 🔍 Options Market Intel:
* Mixed flow, but **puts lead at \$7 strike** (18,763 OI) vs calls (16,792 OI).
* Defensive positioning by institutions suggests caution ahead.
* Options Flow Score: 5/10 — neutral but bearish lean.
### 📈 Technicals:
* Price up 8% pre-earnings but volume low (0.53x avg), signaling weak buyer conviction.
* Support at \$6.50, resistance at \$7.50.
* RSI neutral; momentum mixed.
### 🌎 Macro & Sector Context:
* AI growth tailwind, but inflation & regulations cloud outlook.
* Low VIX (\~15.15) limits extreme volatility but allows strategic plays.
---
### 🎯 Trade Setup:
**Buy \$7 Put — Exp 08/15**
* Entry: \$0.70
* Stop Loss: \$0.35 (50%)
* Profit Target: \$1.40 (100%)
* Position Size: Max 2% portfolio risk
* Timing: Enter pre-earnings close, exit quickly post-earnings to avoid IV crush
---
### ⚠️ Risk / Reward:
| Metric | Value |
| ------------- | -------------- |
| Entry Price | \$0.70 |
| Profit Target | \$1.40 (+100%) |
| Stop Loss | \$0.35 (-50%) |
| Confidence | 68% |
---
### 📊 JSON Trade Signal for API / Bots:
```json
{
"instrument": "BBAI",
"direction": "put",
"strike": 7.00,
"expiry": "2025-08-15",
"confidence": 68,
"profit_target": 1.40,
"stop_loss": 0.35,
"size": 1,
"entry_price": 0.70,
"entry_timing": "pre_earnings_close",
"earnings_date": "2025-08-11",
"earnings_time": "AMC",
"signal_publish_time": "2025-08-11T14:44:49-04:00"
}
```
---
# 🚨 **BBAI ALERT: MIXED TECH MOMENTUM BUT BEARISH OPTIONS FLOW SIGNALS DOWNSIDE RISK — TRADE CAUTIOUSLY!** 🚨