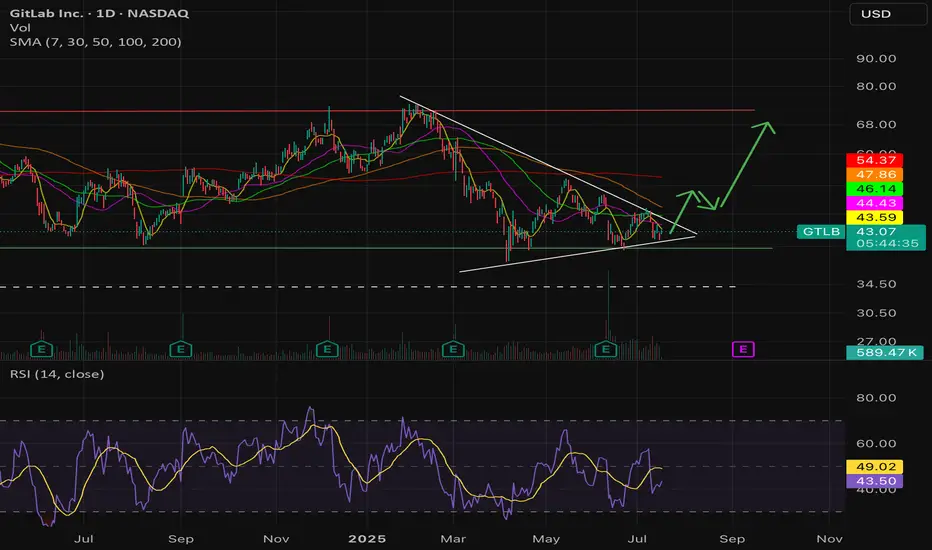
GTLB Long Setup — Swing to $56GTLB has been building a solid base and is now showing signs of a breakout. Price has pushed above the key R1 pivot level around $50.68 and is holding above both the Ichimoku cloud and the 200-day moving average, which confirms a shift in momentum toward the bulls.
The chart structure shows a series of higher lows since early summer, signaling accumulation and improving demand. Immediate resistance sits at $54.85, followed by R2 at $56.30, which lines up as the first target zone. On the downside, support around $49.20–$48.50 has held multiple times and provides a clear level to place stops.
The risk/reward on this setup is favorable at roughly 4.5:1, with only about 2% downside against 8–9% potential upside. If the price closes below $49.20, this setup is invalidated, but as long as buyers defend that zone, the path of least resistance remains higher. A clean breakout and close above $54.85 would confirm continuation, with $56+ as the next logical upside target.
GTLB trade ideas

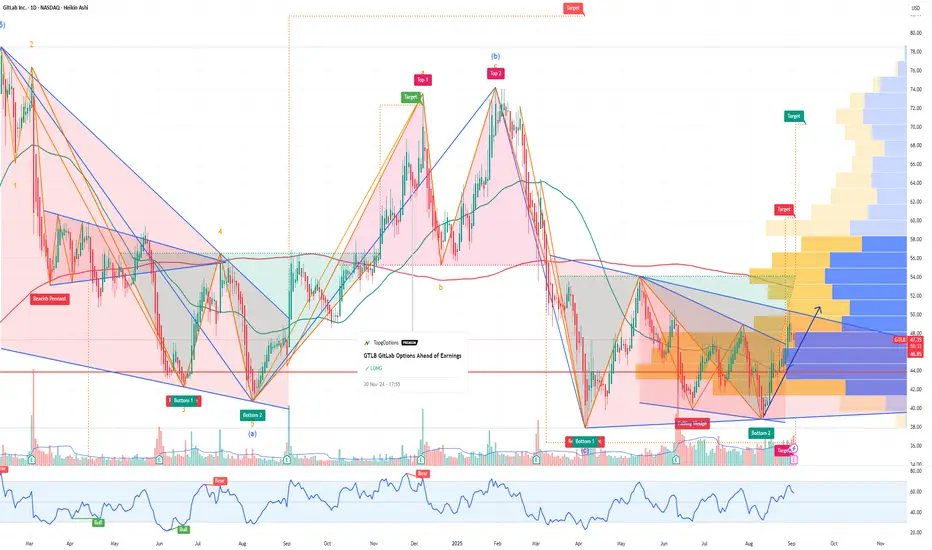
GTLB GitLab Options Ahead of EarningsAnalyzing the options chain and the chart patterns of GTLB GitLab prior to the earnings report this week,
I would consider purchasing the 50usd strike price Calls with
an expiration date of 2026-3-20,
for a premium of approximately $7.80.
If these options prove to be profitable prior to the earnings release, I would sell at least half of them.
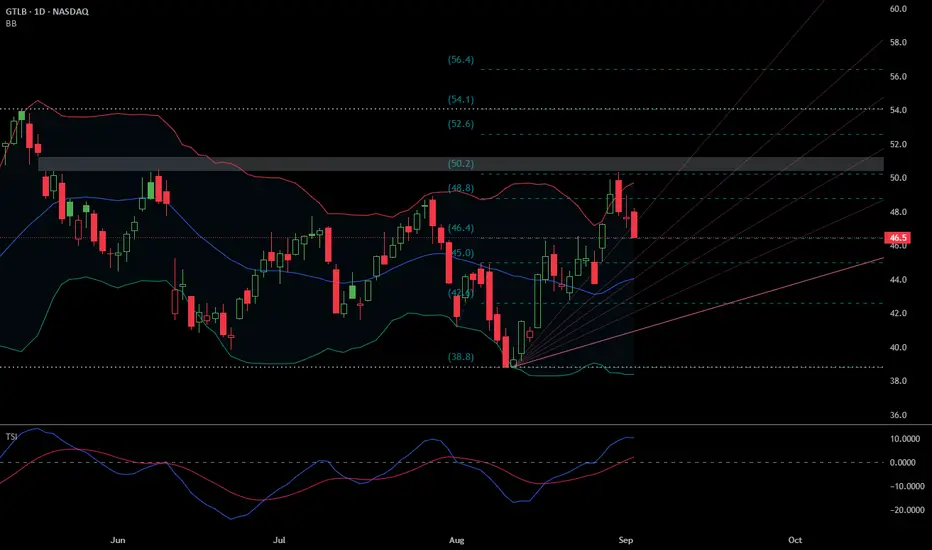
Levels to manage GTLB between now and Thanksgiving 2025If the today's earnings report meets or exceeds expectations, GTLB could confirm the recent analyst optimism and trigger a bullish trend. Conversely, a miss on the earnings could lead to a short-term price decline, potentially testing the support level.
Given the positive analyst sentiment and upcoming earnings catalyst, a likely scenario for the next six weeks is a continuation of the short-term upward trend, with the stock price potentially moving toward the lower end of the analyst price targets.
How Does One Platform Navigate Eight Global Disruptions at Once?GitLab has emerged as a dominant force in the DevSecOps landscape during 2025, achieving a remarkable 29% year-over-year revenue growth to reach $759 million annually in fiscal Q4 2025. The platform's success stems from its ability to address multiple converging global challenges simultaneously, from geopolitical tensions and cybersecurity threats to economic volatility and technological transformation. Key milestones include GitLab Dedicated for Government earning FedRAMP Moderate authorization, enabling accelerated public sector adoption, and strategic partnerships like Sigma Defense's implementation that reduced U.S. Navy software deployment times from months to days.
The convergence of geopolitical and geostrategic factors has created unprecedented demand for GitLab's solutions. Rising data sovereignty requirements and U.S.-China tech rivalries have driven nations to enforce strict data residency laws, making GitLab's single-tenant SaaS architecture particularly attractive for compliance. Defense contractors and government agencies increasingly rely on GitLab's integrated DevSecOps capabilities to strengthen national security positions, with organizations like Sigma Defense achieving 90% cost reductions while dramatically accelerating vulnerability fixes and software deployment cycles.
Economic pressures and technological evolution have further accelerated GitLab's adoption across sectors. The platform delivers a compelling ROI of 483% within three years for large organizations, while the broader DevOps market grows at a 19.1% CAGR. GitLab's integrated approach addresses critical pain points, including toolchain consolidation, embedded security, and AI-powered automation, positioning it as essential infrastructure for cloud-native development. The company's strategic focus on eliminating silos through unified workflows from code to cloud has resonated particularly well with enterprises seeking to reduce complexity and operational costs.
Looking ahead, GitLab's intellectual property strategy and continued innovation in AI integration, exemplified by GitLab Duo's capabilities in code generation and vulnerability detection, suggest sustained competitive advantages. The platform's ability to serve diverse sectors-from federally-funded research centers requiring secure collaboration to high-tech firms demanding cutting-edge automation-demonstrates its versatility in addressing the complex, interconnected challenges defining the modern technology landscape.
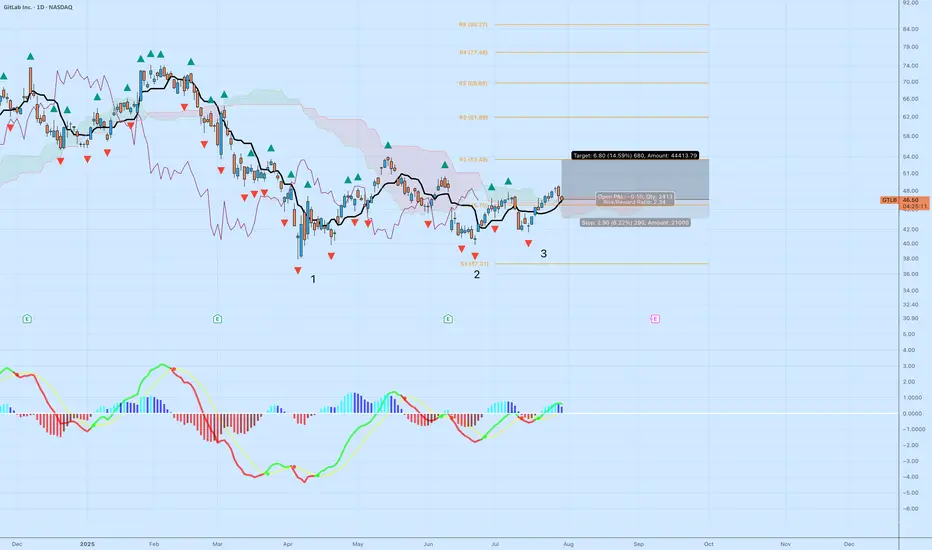
GTLB | Triple Bottom ReversalGitLab (GTLB) is setting up for a potential trend reversal following a textbook triple bottom pattern and a clean breakout above the cloud. Here's the technical breakdown:
Why This Setup Matters
Triple Bottom Pattern: Reversal structure is clear with three defined lows at ~$38, ~$40, and ~$41. The most recent leg up confirms buyers defending that zone.
Ichimoku Cloud: Price has broken above the Kumo with bullish Tenkan-Kijun cross. The leading span A is pointing up, and the cloud ahead is flat and thin — ideal conditions for continuation.
MACD Momentum: Histogram flipped positive again with green signal line crossover — a momentum shift from accumulation to breakout phase.
Trade Parameters
Entry: $46.53
Stop: $43.63 (below Tenkan and the neckline zone)
Target: $53.33
Risk:Reward Ratio: 2.34
Projected Move: +14.59%
Additional Confluence
Daily closes above cloud show growing strength from buyers.
Each bottom was followed by increasing MACD strength — a bullish divergence over time.
Pivot zone at R1 ($53.49) aligns with the price target, adding structure to the exit plan.
Risk Notes
Failure to hold $46 with volume could invalidate the breakout — watch for a retest.
If price closes below Tenkan, reevaluate the setup for weakness.
Volume confirmation needed on the next daily candle for strong conviction.
This is a technical breakout aligned with pattern recognition and trend metrics. Ideal for swing setups with controlled downside.
Worst Behind GTLB. Do you think the worst is behind for GTLB?
With news of senior management selling stock share and the downgrade, we see a clear test of low since April this year. Since the news always come out the latest, the decline during the last 3 months is likely the explaination to the selling pressure we have seen.
However, the bottom is well defended structural-wise, supported by a slow and steady increase in company revenue.
My expectation is that at least we should see a retest around the 200MA.
I am adding GLTB to my portfolio at a 3% position size.
$GTLB undervalued, Potential 2X, AI assisted coding tailwind- NASDAQ:GTLB is likely one of the play for Agentic AI. When other companies like Windsurf, Codium, Cursor are in a goldrush. NASDAQ:GTLB is selling shovels.
- AI assisted coding is now a theme and is happening at a fast pace. I'm certain NASDAQ:GTLB will be a beneficiary of this trend.
- NASDAQ:GTLB has launched various AI based features on its platform which will get adoption and it will be easier for the company to upsell these features.
- P/S for NASDAQ:GTLB is depressed. If they even execute on their fiscal goals, re-rating should lift the stock up.
- NASDAQ:GTLB should be a 2X in less than 3 years in my opinion given secular shift and macro as a tailwind.
Fair value for NASDAQ:GTLB as of now is $68-72
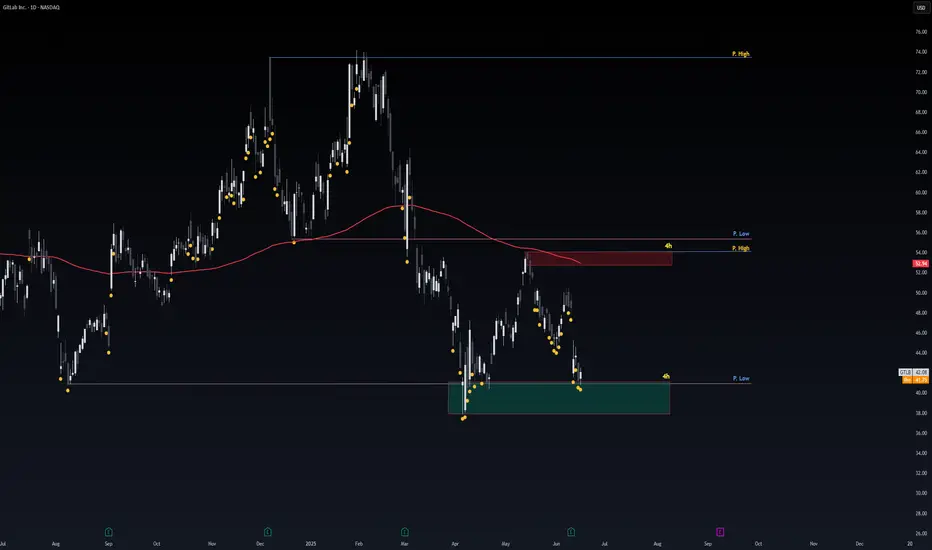
Safe Entry Zone GTLBStock in Ranging Movement.
Stock current at SIGNIFICANT Support Level.
My Beloved Gathie Wood's Best investor ever just bought the stock too.
P.High's & P.Lows(Previous Highs & Previous Lows) acts as good Support and resistances levels.
4h Green Zone Is Buying Zone.
4h Red Zone is Selling Zone.
In case Break Throught red Zone stock will change to UP-Movement and Vice Versa.
Note: 1- Potentional of Strong Buying Zone:
We have two scenarios must happen at The Mentioned Zone:
Scenarios One: strong buying volume with reversal Candle.
Scenarios Two: Fake Break-Out of The Buying Zone.
Both indicate buyers stepping in strongly. NEVER Join in unless one showed up.
2- How to Buy Stock:
On 15M TF when Marubozu Candle show up which indicate strong buyers stepping-in.
Buy on 0.5 Fibo Level of the Marubozu Candle, because price will always and always re-test the imbalance.
GTLB reverses to increaseBased on wave analysis, the main support line and RSI indicator when the price is oversold below 40, it shows a very high possibility of GTLB reversing to increase.
The price now (Closed on 06.16.2025): $42.08.
Price target: $47.76/ $50.50.
Stop loss: $39.
!!! Important note for stoploss as price can return to fill gap $35.68 at any time.
IMO, amateur trader.

$GTLB: AI SaaS Software stock for tactical and long-term tradeIn this blog space we focus a lot on the AI trade. Be it semiconductors, AI powered Cybersecurity, AI Powered Fintech or just the industry itself, but we have not quietly focused on the AI Software stocks. The second and third derivatives of the AI trade will be more on the software space than Semiconductors where most of the future value will be accrued. Now within the AI Software space we have discussed NASDAQ:CRWD strike as one of our favorites, but can there be other names which can give us a lot of Alpha in the near and long term?
In my opinion NASDAQ:GTLB is one such stock. Gitlab provides software developers productivity tools to develop software faster, better and securely. Coming back to the technical below we can see that lately the stock is stuck within the upward sloping channel on the weekly chart since the bear market lows of 2023. If we plot the Fib retracement level from the all-time highs to the all-time lows, we can see that on the weekly chart it is stuck below the 0.236 Fib level with an oversold RSI. But the recent price action indicates that even if we touched the lower bound of the price we saw after April 4 Lib Day lows, we are still holding an RSI of 41 indicating seller exhaustion. So, the next levels in the chart are 52 $ then 67 $ and then 80 $ in the medium term, which is well within the parallel channel.
Verdict: NASDAQ:GTLB target prices are 52 $ then 67 $ and then 80 $. Can be held for long term returns.

# GitLab's Code Surge #GitLab Inc. (GTLB) is demonstrating potential bullish momentum, with a significant weekly gap around the $50 level. A breakout above the $55.26 level could indicate further strength, positioning the stock to target the $69.47 resistance. This trade setup offers an attractive risk-to-reward ratio, with a stop-loss set at $48.40 to manage downside risk.
The Relative Strength Index (RSI) for GTLB was extremely oversold at 31 on March 10th, signaling a potential for a bounce. As of March 14, 2025, the RSI had exited the oversold zone, suggesting improving momentum.
Analyst sentiment remains positive, with a consensus rating of "Moderate Buy" among 24 analysts. The average 12-month price target is $75.52, indicating a potential upside of approximately 42.15% from the current price of $53.13. Price targets range from a low of $58.00 to a high of $90.00, reflecting confidence in the company's growth prospects.
Recent institutional interest further supports this bullish outlook. Summit Global Investments acquired 5,242 shares of GitLab in the fourth quarter, valued at approximately $295,000.
This combination of technical indicators, positive analyst sentiment, and institutional investment supports a bullish outlook for GTLB, with a potential move toward the $69.47 resistance level.

$GTLB - Bad timingNASDAQ:GTLB turned out I couldn't have timed it worse. 😂 During the bear market stocks always backfill their bullish gaps that they left behind. The first gap has been filled. The next gap is around $46 area.
There is a reason why technicians wait for patterns validation. Most wait for 2 to 3 session close above validation point. But what's the fun in that. 🤣
I will just have to endure this ride.

$GTLB - I reenteredNASDAQ:GTLB I reentered with a starter position. MACD just did a bearish crossing, so we could see further weakness or consolidation in price action. Translation: there might be an opportunity for a better entry.

$GTLB is brewing ... Recent earnings estimate revisions for GitLab Inc. have been positive, indicating that analysts are optimistic about the company's near-term performance, which could be influencing the stock's potential upward trend. Plus the weekly chart showing a cup and handle pattern, which add another positive indication.

$GTLB - Cup and handle?NASDAQ:GTLB is forming a cup and handle while also forming an inverse head and shoulders pattern in a longer time frame.
If we can break above the $73 neckline area, we could see this run to the $90 area.
See support and target areas.
As always, I share my opinions and trades. I'm not suggesting anyone follow my trades. You do you.

GTLB Swing Trade Setup Buy signal triggered yesterday when I added a small position. I increased it today after seeing confirmation. It's moving okay with volatility contraction. I am betting we will see a volume spike that will bring price up faster.
It's not a high risk trade and the back tests stats are good, so why not? Plus, I like the company :)
GTLB also seems to be undervalued.
I will probably get out before the "average days in trade" from the back tests.

Pushing Code, Pushing GainsGitLab is demonstrating strong bullish momentum, with a gap forming around the $50.00 level. A breakout above the $73.60 daily resistance would confirm continued strength, positioning the stock to target the $78.42 resistance. This setup offers an excellent risk-to-reward ratio, with a stop-loss set at $50.86 to manage downside risk.
As a leader in DevOps and software development solutions, GitLab is positioned to benefit from the increasing adoption of cloud-based collaborative tools. The company’s commitment to innovation, expanding customer base, and focus on driving operational efficiency enhance its long-term growth potential.
For a deeper dive into this setup, check out my YouTube breakdown, where I cover the technical analysis and the fundamentals driving this trade idea.
With its technical momentum and strong market fundamentals, GTLB presents an exciting opportunity for traders and investors aiming for $78.42.
NASDAQ:GTLB


Gtlb could be a good buy before earningEARNINGS TODAY... always risky. But i like GTLB at this spot, on top of the bollinger bands, good support below, i'm playing this with commons with the hope that 70-72 is hit. Above $72 this could go much much higher, that could take more time to play out.

$GTLB Would you bet on it?NASDAQ:GTLB is forming a potential inverse head and shoulders pattern with a measured move to $90.
The earnings report (ER) is after hours today. There is a risk that it could drop to $50.
Knowing that, would you bet on it?
As always, I share my opinions and trades. I'm not suggesting anyone follow my trades. You do you.

Gap held on daily time frameGood company with growing revenue. Stock respected gap on daily timeframe. Can go higher. Position started today.

Gap held on daily time frameGood company with growing revenue. Stock respected gap on daily timeframe. Can go higher. Position started today.
