Labor Market vs. Inflation Risks: What Traders Should WatchCME_MINI:NQ1! CME_MINI:ES1! CME_MINI:MNQ1! CME_MINI:MES1! CBOT_MINI:YM1! CBOT:ZN1! CBOT:ZB1! ECONOMICS:USNFP
The stock market is currently holding near all-time highs. Today, the BLS (Bureau of Labor Statistics) report, which includes the NFP (non-farm payrolls), will be released at 7:30 am CT.
Market participants are closely watching the non-farm payrolls, with the forecast at 75K, as well as any prior revisions to earlier NFP numbers. The unemployment rate is expected at 4.3%, a slight increase of 0.1%.
Looking ahead, upcoming key events include inflation data and the September FOMC rate decision:
• Aug PPI (Sep 10): A gauge of upstream price pressures. Hot numbers would signal renewed inflation risks.
• Aug CPI & Core CPI (Sep 11): Critical headline data. A softer print would support the dovish case.
• Fed Decision (Sep 17): This meeting comes after the Aug NFP data release (Sep 5).
While there is broad optimism and euphoria in the market, we remain cautious based on our analysis of major futures indexes. Traders should be mindful of signals that could point to a pullback.
Our reasoning:
Markets are currently pricing in two 25 bps cuts for the September and October FOMC meetings, which would bring the target rate down to 3.75%–4.00%.
Additionally, markets are now pricing in four 25 bps cuts in 2026. Prior to the Jackson Hole meeting and recent Fed-related developments, expectations were for three cuts in 2025 and two cuts in 2026.
Does this imply that the effective tariff rate is benign? Is inflation expected to fall, or does this suggest that the Fed is willing to tolerate average inflation in the 2.5%–3.0% range?
The upcoming Fed meeting is likely to emphasize risks to the labor market, while downplaying inflation risks, highlighting the tradeoff within the Fed’s dual mandate.
Other considerations:
Seasonal and cyclical flows also suggest that equity indexes tend to underperform in September and October on average.
Risk-Monitoring Framework: Signs of a Pullback
Given the deteriorating macro backdrop, further steepening of the yield curve, persistently high long-end yields, and the heavy concentration of stock market capitalization in the Mag 9 stocks, it is critical to monitor:
1. Rates & Yield Curve
• 2s10s & 5s30s steepening: Excess steepening with long-end yields above 4.5% would tighten financial conditions.
• SOFR futures spreads: Divergence vs. FOMC guidance can signal rate-path misalignment.
2. Labor Market Signals
• NFP revisions: Downward revisions of >50K would reinforce labor weakness.
• Unemployment rate: Sustained above 4.3% could mark a turning point for the Fed’s labor mandate.
3. Inflation Data
• PPI upside surprises: A risk that supply-side shocks re-ignite inflationary pressures.
• CPI/Core CPI stickiness: Core >3.1% YoY would challenge the market’s dovish pricing.
4. Equity Market Internals
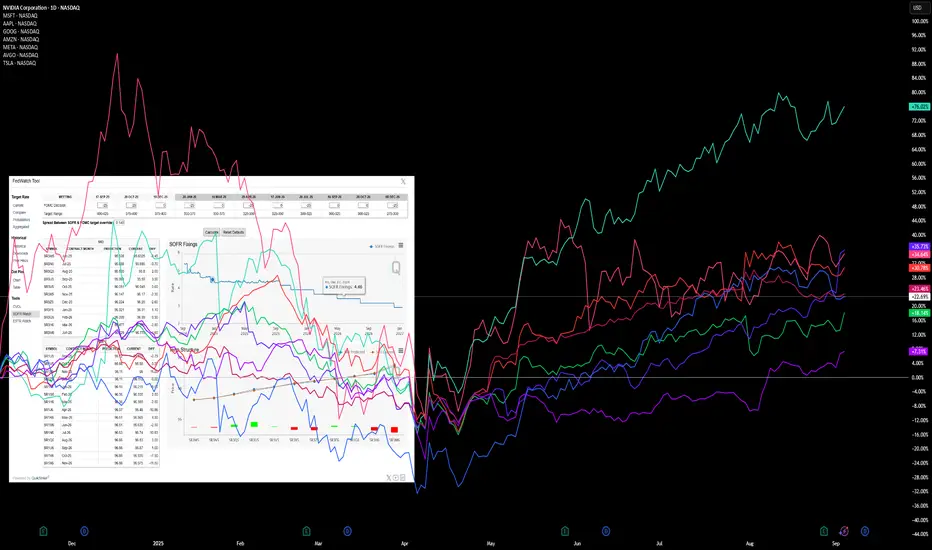
• Mag 9 leadership: Watch for relative weakness in NVDA, AAPL, MSFT, AMZN, META, TSLA, GOOG, AVGO, and BRK.A.
• Breadth indicators: Advance/decline line and % of S&P 500 above 200-day MA. Narrowing breadth = fragility.
• Volatility (VIX): A spike above 20 would indicate stress returning to equity risk sentiment.
5. Cross-Asset Indicators
• Credit spreads (IG & HY): Widening signals stress in funding markets.
• USD & Commodities: Rising USD and higher energy prices would tighten global liquidity.
Conclusion
While optimism remains strong, we caution that macro deterioration, yield curve dynamics, and concentrated equity leadership create fragility. Pullback risks rise if:
• NFP disappoints sharply,
• inflation re-accelerates, or
• outperformance in the Mag 9 begins to roll over.
Traders should monitor these risk indicators closely, as they often precede market drawdowns in September–October.
NVDA trade ideas
NVIDIA About to face some distressNVDA stock which has been on a long promising trend for a while in gthe past years seems to be on that plummet verge, would it really tap or the market is just fertching more buyers?
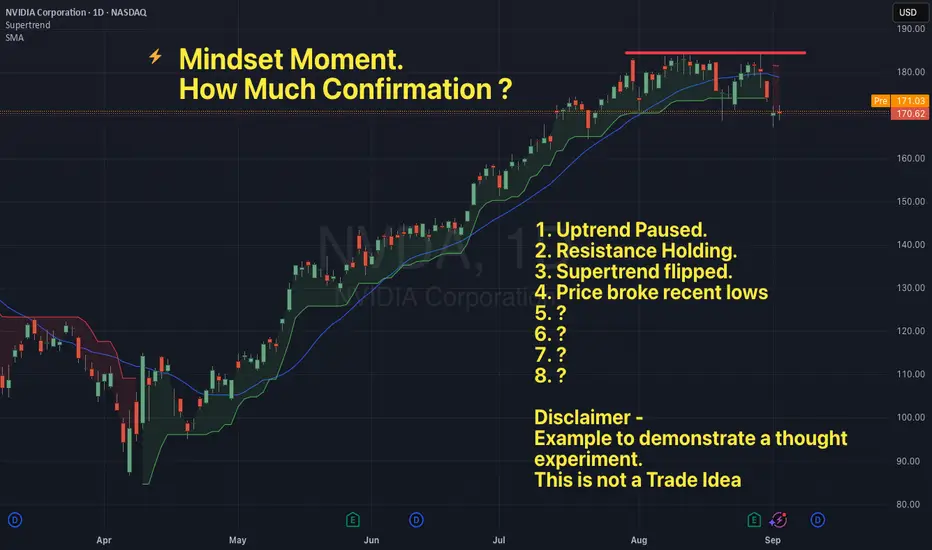
Certainly Uncertain - How Much Confirmation Do You Need?So ... you have what looks like a set up.
"Just one more bar"
"Just wait for the close"
"Wait for this indicator to align"
"Watch for the next to align"
"Ensure this filter shows ‘green lights go’"
But by the time everything lines up
The move has gone.
The horse has bolted
You fumble to enter - all fingers and thumbs
You ‘feel’ like you’re chasing
Perhaps the moment has passed.
Flummoxed - you wonder - what the heck happened here?
Feel familiar?
The search for absolute certainty shows up in subtle ways:
Emotions:
Anxiety builds. A conflict between wanting to act and restraining the impulse. Applying self control with will … but the body and mind unsettled.
Thoughts:
Endless “what if” scenarios.
What if I miss it.
What if it goes without me
What if I just try and get ahead of this at a better price
Physical Cues:
Tension rises in the body showing up as a hand hovering over the mouse, heart rate climbing - eyes fixated on the screens, backside glued to the seat (for fear of missing it).
If you’ve ever experienced this, you may recognise it as feeling cautious or disciplined.
In the pursuit of being disciplined and true to your rules you feel out of alignment and hesitant.
Markets are uncertain by nature.
If we choose to engage with uncertainty, then surely the job is to create a sense of certainty within ourselves.
The question is how do you do this currently?
A coping mechanism that might help:
Breathe.
Centering your breath is one of the most under rated and effective ways to calm ones nervous system.
Reframe your entry as a probability, not a verdict.
Before you click, remind yourself: This trade doesn’t have to be certain, it just has to meet my criteria. Then execute and let the outcome be data - not proof of your worth. Adopt the mantra… ‘ This is one trade in a 1000’
Cultivate the state of certainty in uncertain environments one trade at a time.
Checking for support near 171.26
Hello, traders!
Follow me to get the latest information quickly.
Have a great day!
-------------------------------------
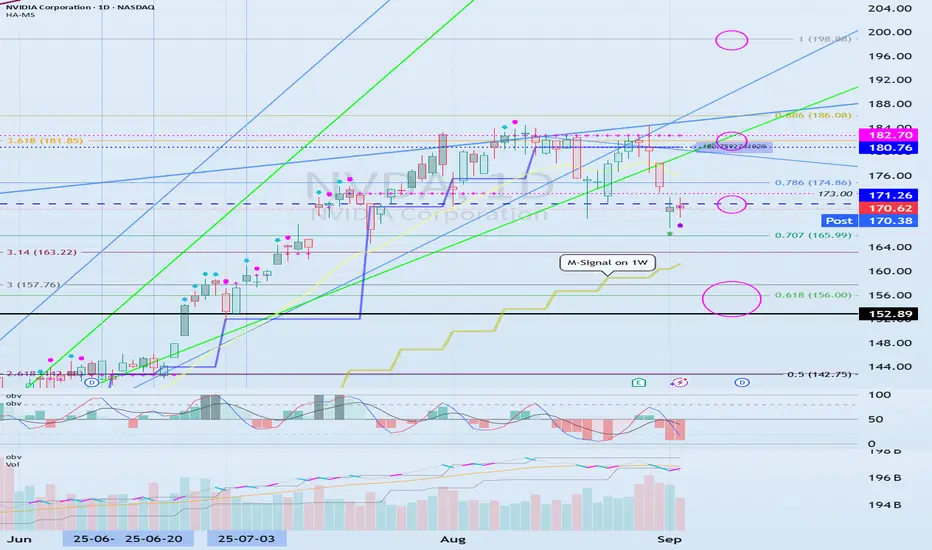
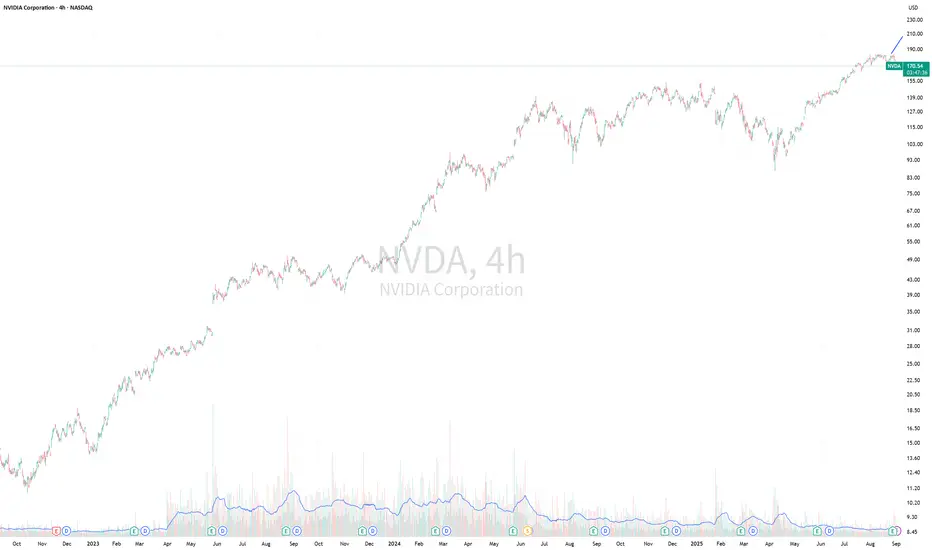
(NVDA 1M chart)
The basic trading strategy is to buy in the DOM(-60) ~ HA-Low range and sell in the HA-High ~ DOM(60) range.
However, if the price rises from the HA-High to DOM(60) range, a step-like uptrend is likely, while if it falls from the DOM(-60) to HA-Low range, a step-like downtrend is likely.
Therefore, the basic trading strategy should be a segmented trading strategy.
-
Looking at the current 1M chart, the HA-High to DOM(60) range is 121.80-138.23.
Therefore, if the price holds above 121.80-138.23, the step-like uptrend is likely to continue.
The left Fibonacci ratio was drawn in the first wave, and the key is whether the price can rise above 3.618 (181.85) and hold.
The right Fibonacci ratio was drawn in the second wave, and the key is whether the price can rise above 1 (198.88).
Therefore, the key question is whether the price can break above the 181.85-198.88 range.
If the price fails to rise,
1st: 152.89
2nd: 121.80-138.23
We need to check for support near the 1st and 2nd levels above.
-
(1D chart)
The HA-High ~ DOM(60) range on the 1D chart is 180.76-182.70.
Therefore, for a stepwise uptrend to begin, the price must rise above 180.76-182.70 and maintain its position.
The 171.26 level is the HA-High indicator level on the 1W chart.
Therefore, the key question is whether support is found near 171.26.
If it falls below 171.26, it is likely to decline until it meets the M-Signal indicator on the 1W chart.
At this point, the key is whether it can find support near 152.89, the Fibonacci 3 level (157.76) to the left.
If it falls below the M-Signal indicator on the 1W chart, there is a possibility of a downtrend, so you should consider a response plan.
------------------------------------------------
If this is your first time hearing this explanation, you may not understand what I'm talking about.
The important thing is that the DOM(-60) and HA-Low indicators indicate lows, while the DOM(60) and HA-High indicators indicate highs.
Therefore, buys should be made near the DOM(-60) and HA-Low indicators, and sells should be made near the DOM(60) and HA-High indicators.
To interpret charts from a long-term perspective, you need to check the positions of the DOM(-60), HA-Low, HA-High, and DOM(60) indicators on the 1M chart.
The 1W chart is interpreted from a medium- to long-term perspective, while the 1D chart is interpreted from a short-term perspective.
In the stock market, price fluctuations are often driven by issues other than the chart itself, so it's important to always be aware of volatility.
Even so, since volatility ultimately occurs after the chart is created, it's best to analyze the chart first and then examine other issues.
Otherwise, you'll likely end up creating a trading strategy that heavily reflects your own subjective opinions.
-
Thank you for reading to the end.
I wish you successful trading.
--------------------------------------------------
Nvidia at a Crossroads – Support or Steeper Decline?Nvidia shares have fallen by about 6% since the company reported results on 27 August. The stock has now reached an important inflection point, trading in a range between $165 and $170, which is a major area of technical support. If this support is broken, it could see the shares slip towards $150 — a further decline of around 12% from their price of roughly $171 on 2 September.
The zone between $165 and $170 has acted as a support region on a few occasions since the gap higher on 15 July. That gap, however, was filled on 22 July, and it is possible that support at $165 has now been exhausted. This would mean that a retest of $165 could lead to the shares falling to their next support level, which is at the previous highs of $150.
We have also seen a change in trend for Nvidia, with the stock now trading below a trend line that has been in place since early May. It is also trading below its 20-day moving average, which has started to turn lower. The relative strength index (RSI) confirms this change in trend, as it has also been trending lower. The RSI formed a bearish divergence in late July after climbing above 70, a point at which the RSI began making lower highs while the share price continued to make higher highs.
If the stock is able to maintain support between $165 and $170, climb back above the 20-day moving average, and, more importantly, break the downtrend in the RSI, then it is possible that Nvidia could withstand this move lower and contain its losses, with an attempt to make another push towards all-time highs.
Outside of that, the road ahead for Nvidia looks challenging.
Written by Michael J. Kramer, founder of Mott Capital Management.
Disclaimer: CMC Markets is an execution-only service provider. The material (whether or not it states any opinions) is for general information purposes only and does not take into account your personal circumstances or objectives. Nothing in this material is (or should be considered to be) financial, investment or other advice on which reliance should be placed.
No opinion given in the material constitutes a recommendation by CMC Markets or the author that any particular investment, security, transaction, or investment strategy is suitable for any specific person. The material has not been prepared in accordance with legal requirements designed to promote the independence of investment research. Although we are not specifically prevented from dealing before providing this material, we do not seek to take advantage of the material prior to its dissemination.

NVDA $182 Weekly CALL Setup – Cheap Premium, Big Upside?
# 🚀 NVDA Weekly Options Trade Idea (2025-09-03)
### 📊 Multi-Model Recap
* **Daily RSI**: 📉 34.3 (weak)
* **Weekly RSI**: 🔻 73.2 (falling)
* **Volume**: +1.3x → institutional distribution signs
* **Options Flow**: 🔥 C/P = 1.96 (bullish skew)
* **Gamma/Theta**: ⚡ High risk (2 DTE)
👉 Models Split:
* 🐻 Bearish: Claude, Gemini → favor \$165 PUT
* 🐂 Bullish: Llama, Grok → favor \$175 CALL
* 😶 Neutral/No Trade: Claude (low confidence)
---
### 🧭 Consensus Read
* Price & volume = bearish ⚠️
* Options flow & VIX = bullish 📈
* Net: **Mixed bias → tactical bullish bounce possible**
---
### ✅ Trade Setup (Viral Play)
```json
{
"instrument": "NVDA",
"direction": "CALL",
"strike": 175,
"expiry": "2025-09-05",
"entry_price": 0.68,
"profit_target": 1.36,
"stop_loss": 0.34,
"size": 1,
"confidence": 0.65,
"entry_timing": "market open"
}
```
---
### 🎯 Trade Details
* 📌 **Strike**: \$182 CALL
* 💵 **Entry**: 0.68 (ask, open)
* 🎯 **Target**: 1.36 (+100%)
* 🛑 **Stop**: 0.34 (-50%)
* 📅 **Expiry**: Sep 5 (2 DTE)
* 📈 **Confidence**: 65%
* ⏰ **Hold Policy**: Close by Thu EOD (don’t ride Friday gamma bomb)
---
⚠️ **Risks**:
* 2 DTE = 🔥 high gamma / fast theta decay
* Divergent signals → whipsaws possible
* Tight stop discipline required 🚨

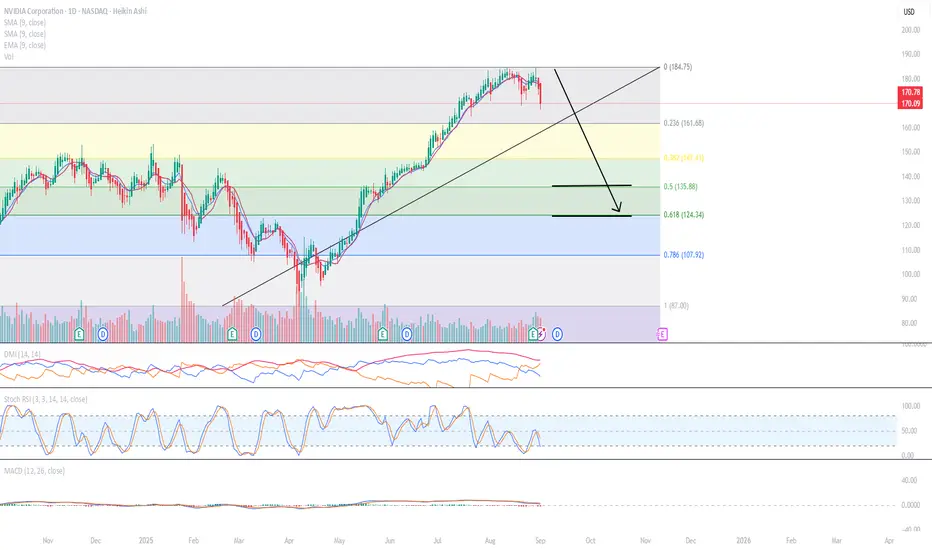
NVDA is going down for a while ...NVDA is continuing downward. I have the target as being around middle of October or later.
I used the Heikin Ashi candles:
1: They show more of a directional movement.
2: They tend to filter out the market noise, so you can see the direction better.
3: it reduces false signals, allowing you to stay in the trade longer.
4: And it also gives a smoother appearance making it easier to see the trends and reversals.
My stops are:
1) the high of the previous Heikin Ashi candlestick,
2) 2 green Heikin Ashi candlesticks,
3) a specific dollar amount for a total loss for my trade or
4) a specific dollar amount per contract.
If it hits one of those stops, I am out of my trade.
Typically, I would wait until there are 2 red daily Heikin Ashi candlesticks before entering which it has shown as of today.
I use the MacD, the Stock RSI and the DMI to assist me with the direction of the market. I am not perfect at them.
I personally find:
* the 5 minute indicators typically represents what will happen in the next half and hour.
* the 10 minute indicators typically represents what will happen in the next hour.
* the 30 minute indicators typically represents what will happen in the daily.
* and, the hour indicators typically represents what will happen in the next week.
If you look at the weekly indicators, they are bearish already which shows a longer term directional movement.
Trade at your own risk, make sure you have stops in place and only use 10% of your trading account, so that if you are wrong, you will not blow up your account.
Happy trading!
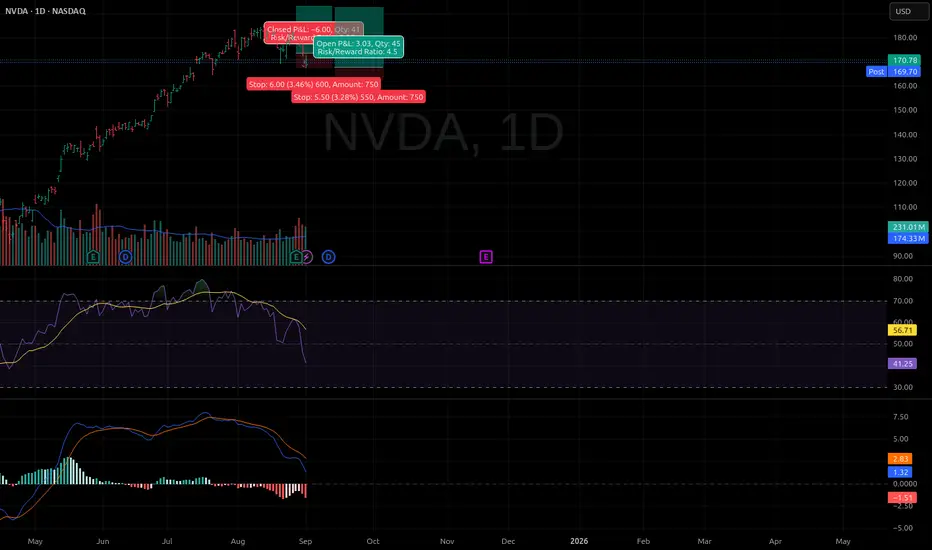
The Trader's Mind: Stoic Balance and The 5 TruthsHello, fellow seekers.
Today, let's set aside the charts for a moment and talk about the single most important tool in our arsenal: our mind. A winning strategy is useless if the mind operating it is in a state of chaos. The key to consistency is not a secret indicator, but a balanced internal state.
Two of the most powerful frameworks for achieving this balance are the modern wisdom of trader Mark Douglas and the ancient philosophy of Stoicism. They are two different paths leading to the same truth.
Mark Douglas's 5 Fundamental Truths of Trading
Anything can happen.
You don't need to know what is going to happen next to make money.
There is a random distribution between wins and losses for any given set of variables that define an edge.
An edge is nothing more than an indication of a higher probability of one thing happening over another.
Every moment in the market is unique.
The Echo of Stoicism
These truths echo the teachings of Stoic philosophers like Marcus Aurelius. They teach us to accept what is outside our control (market movements) and focus only on what is within our control (our process, our risk, our mindset). This is the path to emotional flow, not suppression. It is watching the river of fear and greed flow by without being swept away by the current.
From Theory to Practice
This isn't just theory; it's the practical foundation for how we navigate the markets. In my next posts on NASDAQ:NVDA and NASDAQ:OPEN , you'll see exactly how these principles are applied in real-time to manage both a losing trade and a winning one.
Just shine.
Disclaimer: This is not financial advice. It is for educational and informational purposes only. Please conduct your own research and manage your risk accordingly.
$NVDA The Vanguard Coils-Gathers Fuel for its Next AscentTraders, when the General pauses, we look to the Vanguard for clues. NASDAQ:NVDA has been a quintessential market leader, a rocket ship charting a course through clear skies. Its current price action is a critical piece of the puzzle for where the entire market may be headed next.
The Technical Landscape
The strength in this chart is undeniable. It is the definition of a stock in a powerful uptrend.
Relative Strength: NASDAQ:NVDA has consistently outperformed the broader market, making it a key barometer of risk appetite.
Current Pattern: The rocket ship is refueling. Price is consolidating in an exceptionally tight and orderly pattern right below the $182 resistance level. Critically, volume has been declining during this coil—a classic sign that sellers are scarce and the next move is likely to be upward.
Key Support: The launchpad for this consolidation is the support level around $170 . This area must hold for the immediate bullish structure to remain intact.
The Philosophy
Strength begets strength. In the market, this is a fundamental truth. To bet against an asset displaying such clear and persistent power is a low-probability endeavor. The current coil is not a topping pattern; it's a continuation pattern in waiting. It's the moment of calm before the engines reignite.
While the broader market takes a breath, leaders like NASDAQ:NVDA often complete their rest cycle first. How this pattern resolves will provide a powerful clue about the market's true intentions. We do not predict; we observe and align ourselves with demonstrated power.
An Illustrative Setup
The trade thesis is born from this powerful consolidation:
The Bullish Trigger: A confirmed breakout above $182 on increased volume is the signal that the refueling is complete and the next leg of the ascent has begun.
The Warning Signal: A failure to hold the $170 support would indicate a temporary mechanical issue, suggesting a deeper pullback is required before the journey can continue.
Watch the leader. It will often show the way.
Remember to just shine!
Disclaimer: This is not financial advice. It is for educational and informational purposes only. Please conduct your own research and manage your risk accordingly.

NVDIA SHORT TRADING PLANSWhy:
Weekly Divergence
Field BOS in 4H
Focus on Daily
My Entry is only discounted Price : FIB Values
if you want to enter you can entry after the BOS and SL will be the

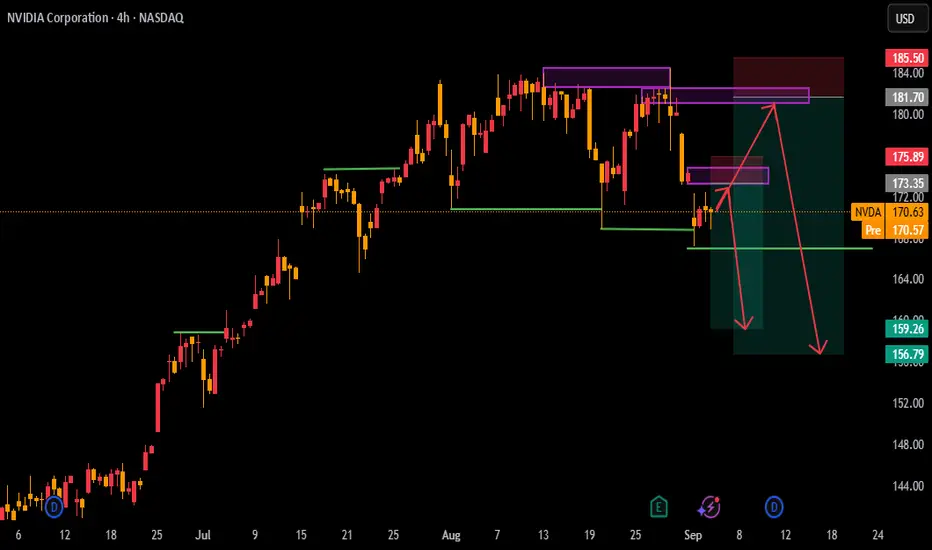
9/2/2025 NVDAPotential downside and seasonal weakness to show in the coming weeks. Look for resistance $170-175 range. Target downwards moves into $165 - 155 - 150 - 147 and potentially a move into $135 before expiration for maximum opportunity.

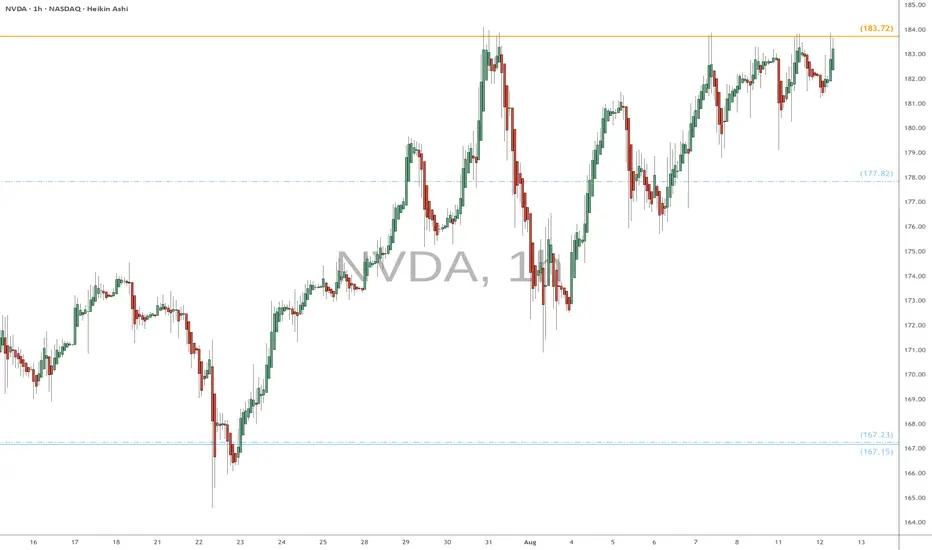
NVDA eyes on $183.72 again: Golden Genesis Fib about to Break? NVDA looks ready for a break out to new highs.
Beating against the Golden Genesis at $183.72
Looking for a Break-n-Run, maybe no retest even.
$195.01 is first target and should be quick.
$201.51 is next target maybe after a dip.
$177.82 is high support for bulls to hold.
.
Previous analysis that gave EXACT Shorts from this Fib:
Hit BOOST and FOLLOW for more such PRECISE and TIMELY charts.
=========================================================
.
NVDA TRADE AFTER LONG WEEKENDI am looking at NVDA and took Call option expiring sep 5, strike price $170 @$3.40.

NVIDIA to $900? That’s what an AI debate tool just told meSo I stumbled on this AI tool named "AI Debate" that analyzes stocks.
At first, I tried Apple and Microsoft — the results were solid, very thorough, but nothing shocking.
Then I plugged in NVIDIA.
And the “AI experts” came back saying that at current levels, there’s still a 4–5x upside. From around $180 to a target above $900.
My jaw dropped. Honestly, it feels unbelievable.
But here’s the thing: I kinda trust this more than random human “gurus” with agendas. At least the AI is pulling fundamentals, technicals, sentiment, and laying it out objectively — no one is pumping their own bags.
Can I try buying some NVDA?
Or can you break down where the AI analysis might be flawed?
Below is the evidence:
Analysis log:
AI Warren Buffett:
NVIDIA is a remarkable company with outstanding profitability and growth—its return on equity is over 115%, net margins exceed 50%, and revenue is growing at a blistering pace. The business is financially sound, with a strong balance sheet and ample free cash flow. If you look at the numbers alone, it’s easy to see why so many investors are excited. However, as I’ve often said, 'Price is what you pay, value is what you get.' At a P/E of 58 and a price-to-book over 50, you’re paying a very steep price for future growth. This is a classic case where the business is excellent, but the stock may be ahead of itself. If growth slows even a little, the stock could face a sharp correction. I generally avoid technology companies outside my circle of competence, but NVIDIA’s dominance in AI chips gives it a real, though possibly temporary, moat. For investors with a high risk tolerance and a long-term horizon, it may be worth a small position, but I would insist on a significant margin of safety. My target price is based on a discounted cash flow approach, assuming continued strong growth but building in a 25% margin of safety. The 12-month target price range is $650 (conservative) to $800 (reasonable), with $900 as an optimistic scenario if growth persists. At current prices, caution is warranted—sometimes the best thing to do is wait for a better pitch.
AI Peter Lynch:
When you look at NVIDIA, you’re staring at a company that’s firing on all cylinders—profitability, growth, and financial health are all top-notch. I mean, a 115% ROE and net margins over 50%? That’s the kind of stuff you dream about as an investor. Revenue is up nearly 70% year-over-year, and earnings are still growing at a healthy clip. The balance sheet is rock solid, with a current ratio of 3.46 and manageable debt. If you’re looking for a company with a great story, just look around: AI, gaming, data centers—NVIDIA’s chips are everywhere, and if my kids are talking about it, you know it’s mainstream. But here’s the rub: the valuation is sky-high. A P/E of 58, P/B over 50, and P/S close to 30? That’s a lot of future growth baked into the price. The PEG ratio is well above 1, so you’re not getting a bargain here. This isn’t the kind of stock you buy for a quick double; you’re betting on NVIDIA becoming even more dominant in the years ahead. The technicals are still bullish, but momentum is cooling off, and the social buzz is pretty quiet—maybe folks are waiting to see if the next earnings report justifies the price. So, is this a ten-bagger from here? Probably not, given the current valuation. But if you’re a growth investor with a strong stomach for volatility, NVIDIA’s fundamentals make it a compelling long-term hold. Just don’t expect a smooth ride, and be ready for some bumps if the market decides the price is too rich. Target Price Logic: With a forward EPS estimate of around $20 and a more reasonable growth-adjusted P/E of 40 (still a premium, but justified by leadership in AI and data centers), the 12-month target price comes to about $800. That’s factoring in continued strong growth, but not assuming another explosive year like the last one. If growth slows or the market re-rates tech stocks, downside risk is real.
AI Cathie Wood:
NVIDIA is the quintessential example of a company at the forefront of disruptive innovation, driving the AI revolution and transforming industries from data centers to autonomous vehicles. Its GPU and AI accelerator technologies are not only powering exponential growth in cloud computing and generative AI, but also expanding the total addressable market (TAM) into trillion-dollar territory as enterprises and governments race to adopt AI infrastructure. The company's fundamentals are outstanding: ROE at 115.5%, net margin at 51.7%, and revenue growth of 69.2% YoY signal a rare combination of profitability and hypergrowth. NVIDIA's R&D intensity and relentless innovation pipeline have created a technological moat that is widening as AI adoption accelerates globally. Over a 5-10 year horizon, we see NVIDIA capturing a disproportionate share of the expanding AI and accelerated computing markets, with potential for TAM expansion as new applications emerge. However, the current valuation is extremely rich (P/E 58, P/S 29.5), reflecting high expectations and introducing volatility risk if growth decelerates. While short-term technicals and muted sentiment suggest caution, the long-term exponential growth trajectory remains intact. Our 12-month target price is derived from a forward EV/Revenue multiple of 30x on projected FY2026 revenues, reflecting continued AI adoption and market leadership, but we emphasize the need for risk management given the premium pricing.
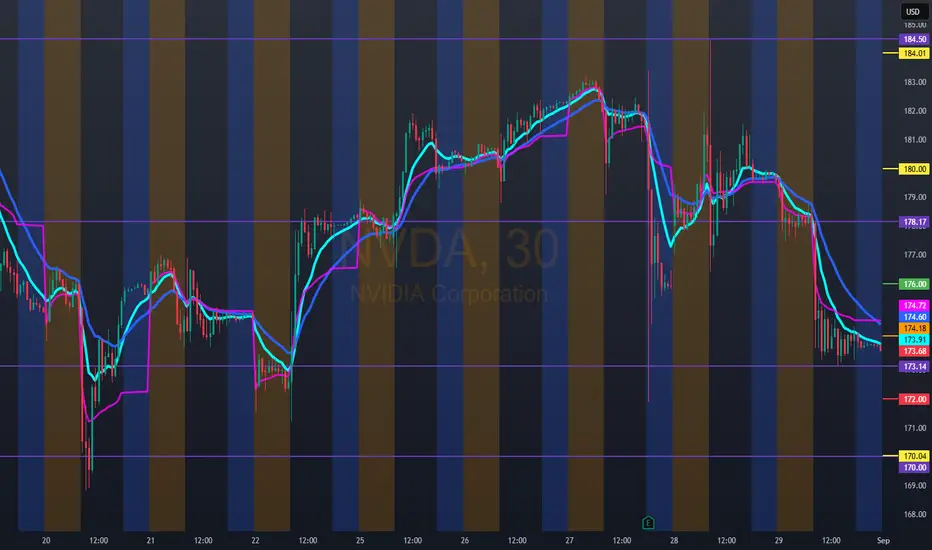
Hello trader, for tomorrow, February 9, 2025.NVDA: Bullish entry at 176.00. Possible profit-taking at 180.00. If there is no rejection at 180.00, for a next bullish entry, we should wait for a breakout of the double top at 184.00, taking a new bullish entry at 186.00.
For the bearish entry: 172.00/170.00. This last one could act as a rebound zone because it would form a double bottom. Use the VWAP indicator for your stops.
Nvda volume spike at top?Bearish argument:
Volume spike at the top on the daily
No daily reversal seen as of Monday Sept 1st
Daily bearish divergence
Monthly indecision candle
TP: Last week's low
Daily RSI 30
Daily bullish divergence
160 gap
Last year's high
Bullish arguments:
High volume on Friday's dump on QQQ
Need to monitor for QQQ daily reversal
Conclusion: Probable chance of continued dump on NVDA.
Most likely price target is NVDA or when QQQ reaches last week's low as it coincides with a previous high volume spike level.

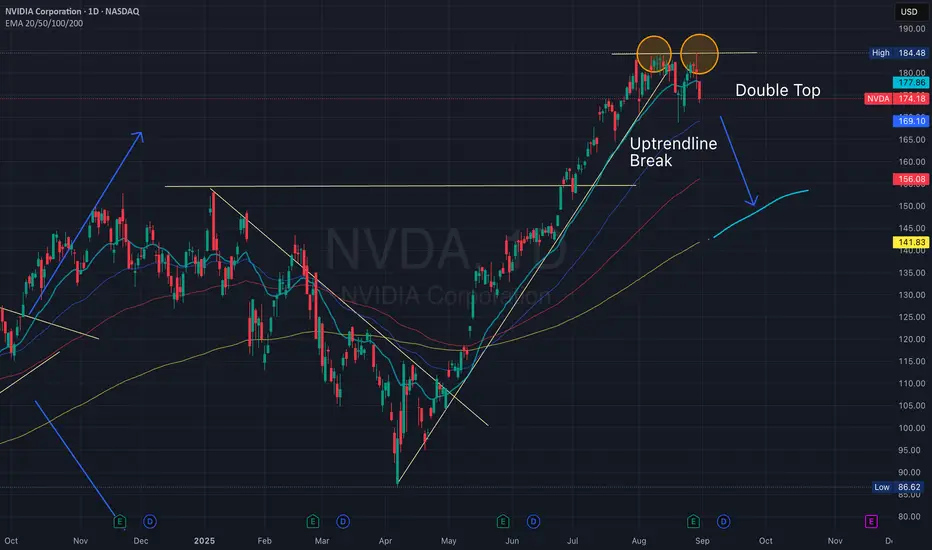
NVIDIA Has Some Reversal SignsNVDA has formed a double top and stochastic oscillator divergance on the dailyt chart. ON the monthly chart it has a it has formed a shooting star candle.
Good luck for all of you
Markets Titan

Getting Support and Resistance Levels using optionsI describe a creative method to use external options data to then plot support and resistance levels directly on the chart. Up to 30 tickers supported at once and updates as frequently as you want.

$NVDA big move comingWatching NASDAQ:NVDA close the month with a long legged Doji at the top is leading me to believe that some bigger news will be coming out to drop the stock to the downside. I would expect a nice discount coming for potential longer term entry.
Potentially something like China is rejecting their chips or an international market rejection or lawsuit to come into play.

NVDA - Short for ShorttermNVDA shows double resistance around $185. Price is going flat and double on resistance. Price is also far away from 200 EMA on Day TF and it must meet in near future. There will some slowness on stock movement and retracement will take it towards 200 EMA on D TF. Short term short price target of $150
Nvidia (NVDA) Shows Bearish Signs After Earnings ReleaseNvidia (NVDA) Shows Bearish Signs After Earnings Release
On Wednesday, Nvidia published a fairly strong quarterly report:
→ Revenue for the second quarter came in at $46.74 billion (record), up 56% compared with the same period last year;
→ Adjusted earnings per share (EPS) were $1.05, a 54% year-on-year increase and above analysts’ expectations of $1.01–$1.02.
However, in the Data Centre segment (closely watched by the market), results fell slightly short of Wall Street forecasts, which may suggest a slowdown in capital flows into AI infrastructure. This factor could explain why Nvidia (NVDA) underperformed the index later in the week: for instance, the S&P 500 hit a record high on Thursday, while NVDA closed lower.
Technical analysis of Nvidia (NVDA) chart
Six days ago, we:
→ Drew an upward channel (shown in blue), capturing NVDA’s price swings after the bullish surge at the end of June;
→ Highlighted the importance of support at $170 and resistance at $183.
Indeed, $183 looks like a solid barrier:
→ The numbers (1, 2, 3) mark failed attempts by the bulls to break through this resistance, giving grounds to view the chart in the context of a triple top pattern.
→ The third peak only slightly exceeds the previous highs, which resembles a bull trap and the Upthrust After Distribution (UTAD) pattern in Richard Wyckoff’s methodology, signalling the prospect of lower prices. A bearish gap the following day (shown by the red arrow) and a weak Friday close underline the bears’ aggression.
Given the above, we could assume that the bulls may try to keep the price within the channel, relying on support at its lower boundary. Yet the mentioned signals suggest that the bears are intensifying pressure. If we see only a weak rebound from the lower boundary at the start of September, the current channel could be at risk. In the event of a bearish breakout, a move down to test the $170 support could happen.
This article represents the opinion of the Companies operating under the FXOpen brand only. It is not to be construed as an offer, solicitation, or recommendation with respect to products and services provided by the Companies operating under the FXOpen brand, nor is it to be considered financial advice.

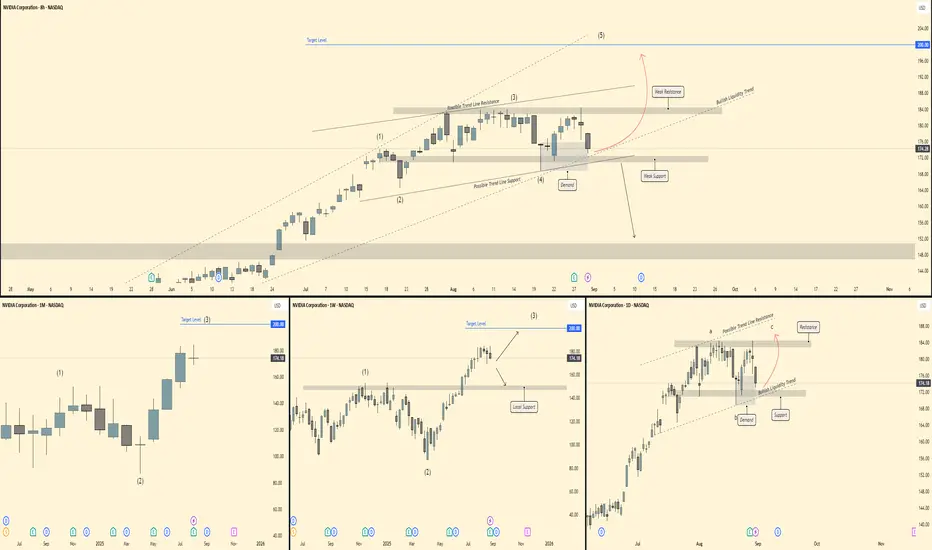
NVDA - Critical Point right now! Back to 150 OR we make new high📊 NVDA – Multi-Timeframe Outlook
🔎 Monthly (1M)
Strong bullish structure with clear Elliott Wave progression (1)-(3) unfolding.
Current candle shows retracement after a parabolic push, but higher timeframe structure remains intact.
Target level stands at 200 USD, aligning with Wave (3) completion zone.
🕰 Weekly (1W)
NVDA completed Wave (3) near 184, now pulling back into a local support zone ~160 – 165.
Structure suggests a corrective Wave (4) before potential continuation higher.
As long as support holds, expectation remains for a Wave (5) push towards 200+.
⏱ Daily (1D)
Price coiling inside a corrective a-b-c structure under trendline resistance.
Demand/support zone ~170 – 172 is acting as the base.
Break above 184 resistance confirms bullish continuation, while loss of support opens risk towards 152 (deeper retrace).
⏳ 8H
Clear retracement into demand after Wave (3) high.
Price holding trendline support + demand confluence.
If buyers step in, expect a rally into Wave (5) targeting 190 – 200.
Breakdown of demand would shift momentum bearish short-term.
🎯 Trade Plan
Bias: Bullish continuation (Wave 5 setup)
Entry Zone: 170 – 175 (demand/support)
Targets: 184 (short-term), 200 (medium-term)
Invalidation: Break & close below 160 support
Institutions & Participants in Financial Markets1. Introduction
Financial markets are the backbone of global economies. They provide a platform where individuals, corporations, and governments can raise capital, invest savings, and manage risks. Behind every transaction in the stock market, currency exchange, bond market, or commodity trading, there are participants who make the system function. Some are individuals trading with their own savings, while others are large institutions managing billions of dollars. Together, they form a complex network of buyers, sellers, intermediaries, and regulators who ensure liquidity, stability, and transparency in markets.
Understanding Institutions and Participants is essential because they influence how prices are discovered, how risks are shared, and how capital flows across economies. Without them, financial markets would not function efficiently.
2. Definition of Institutions & Participants
Institutions in financial markets refer to organized bodies that create, regulate, or facilitate market activities. Examples include central banks (RBI, FED), regulators (SEBI, SEC), stock exchanges (NSE, NYSE), clearing houses, and depositories. Their primary role is to ensure smooth functioning, enforce rules, and reduce risks of defaults or fraud.
Participants are entities or individuals that actively take part in financial transactions. This includes retail traders, institutional investors, corporations, governments, and intermediaries like brokers and dealers. They provide liquidity, demand, and supply for financial assets.
Together, institutions and participants form the ecosystem of financial markets, where institutions provide the structure and participants provide the activity.
3. Types of Market Participants
(a) Retail Investors
Retail investors are individual participants who invest their personal savings in stocks, mutual funds, bonds, or derivatives. They usually trade in smaller quantities compared to institutions. Retail participation has grown tremendously with the rise of mobile trading apps, discount brokers, and financial literacy campaigns.
Strengths: Flexibility, diversity of strategies, emotional conviction.
Weaknesses: Limited capital, lack of information compared to institutions, prone to herd behavior.
Example: In India, after 2020, retail investors surged on platforms like Zerodha, Upstox, and Groww, contributing significantly to stock market liquidity.
(b) Institutional Investors
These are large organizations that pool funds from clients or members and invest systematically. They include:
Mutual Funds – Manage pooled capital for retail investors.
Pension Funds – Invest long-term for retirement benefits.
Insurance Companies – Invest premiums in safe and growth-oriented assets.
Hedge Funds & Private Equity – Use complex strategies to maximize returns.
Institutions play a dominant role because of their large capital base and access to advanced research. Their actions often influence market trends and sentiments.
(c) Brokers & Sub-Brokers
Brokers act as intermediaries between investors and the stock exchange. They provide platforms, research, and execution services. Sub-brokers or franchisees work under main brokers to service clients in smaller regions.
In India, SEBI regulates brokers, requiring them to register and follow compliance rules. Discount brokers like Zerodha revolutionized the industry by reducing costs and increasing retail participation.
(d) Market Makers & Dealers
Market makers are institutions or individuals who continuously provide buy and sell quotes for securities, ensuring liquidity in the market. Dealers trade on their own account, taking positions in securities to profit from price movements.
Example: In the Forex market, banks act as market makers by offering two-way quotes (bid and ask prices).
(e) Corporates
Companies participate in markets to raise funds by issuing shares, bonds, or commercial papers. They also engage in hedging using derivatives to manage currency or interest rate risks.
For example, Reliance Industries regularly taps debt markets, while Infosys issues shares under ESOPs.
(f) Governments & Central Banks
Governments raise capital through bonds (sovereign debt) to finance infrastructure, welfare, and development. Central banks regulate money supply, set interest rates, and intervene in foreign exchange markets.
The Federal Reserve (US) sets monetary policy that affects global markets.
The Reserve Bank of India (RBI) manages inflation, rupee stability, and liquidity.
(g) Regulators & Exchanges
Regulators (e.g., SEBI in India, SEC in the USA) create and enforce laws to protect investors and maintain fair markets.
Exchanges (e.g., NSE, NYSE) provide the physical or electronic infrastructure where buyers and sellers meet. They ensure price transparency, equal access, and fair competition.
(h) Foreign Institutional Investors (FIIs) & Foreign Portfolio Investors (FPIs)
Global investors participate in emerging markets like India to seek growth opportunities. They bring in large capital inflows, which can boost stock indices but also increase volatility if they withdraw funds quickly.
Example: In 2020–2021, FPIs invested heavily in Indian equities, leading to record highs in Nifty and Sensex.
4. Institutions in Global & Indian Context
Stock Exchanges
Global: NYSE, NASDAQ, London Stock Exchange.
India: NSE and BSE dominate trading volumes.
Clearing Corporations & Depositories
They reduce settlement risks by ensuring that buyers get their securities and sellers receive payments.
India: NSDL, CDSL.
Global: DTCC (USA), Euroclear (Europe).
Regulators
India: SEBI, RBI, IRDAI.
Global: SEC (USA), FCA (UK), ESMA (Europe).
International Institutions
IMF & World Bank – provide financial stability and funding to nations.
Bank for International Settlements (BIS) – sets banking regulations.
5. How Participants Interact in Markets
Financial markets are divided into:
Primary Market: Where new securities are issued (IPOs, bonds). Corporates and governments raise funds here.
Secondary Market: Where existing securities are traded. Retail and institutional investors interact here.
Price Discovery happens when buyers and sellers agree on prices based on demand and supply. Institutions often lead price discovery, while retail investors follow.
Technology’s Role: Algorithmic trading, high-frequency trading, and fintech platforms have transformed participation. Machines now execute trades in microseconds, increasing liquidity but also creating flash-crash risks.
6. Case Studies & Examples
2008 Financial Crisis: Triggered by reckless lending by banks, misuse of mortgage-backed securities, and regulatory gaps. It showed the danger of unregulated institutions.
Indian Markets Post-2020: Surge in retail investors and rise of discount brokers democratized investing. FIIs also played a strong role in pushing indices to record highs.
7. Challenges & Risks
Conflicts of Interest – Brokers may mis-sell products, institutions may prioritize profits over clients.
Market Manipulation – Pump-and-dump schemes, insider trading, and algorithmic manipulation distort fairness.
Globalization Risks – Capital flight during crises (e.g., FIIs pulling funds).
Regulatory Gaps – Some instruments (like crypto) still lack clear regulations.
8. Future of Institutions & Participants
AI & Algorithmic Trading will dominate markets, with human traders playing a smaller role.
Fintech & Digital Platforms will bring more retail investors into the system.
Global Institutional Flows will decide the fate of emerging markets like India.
Sustainable Finance – ESG-focused investing and green bonds will rise.
9. Conclusion
Institutions and participants together form the lifeline of financial markets. Institutions provide the rules, infrastructure, and trust needed for smooth functioning, while participants provide liquidity, capital, and demand. Their interaction shapes prices, drives innovation, and supports economic growth.
From a small retail trader buying a single stock to a central bank moving billions in currency reserves, each participant plays a vital role in maintaining balance. The future will bring more technology-driven participation, deeper global integration, and stronger institutional oversight.
In essence, the strength of a financial market depends on the quality of its institutions and the diversity of its participants.