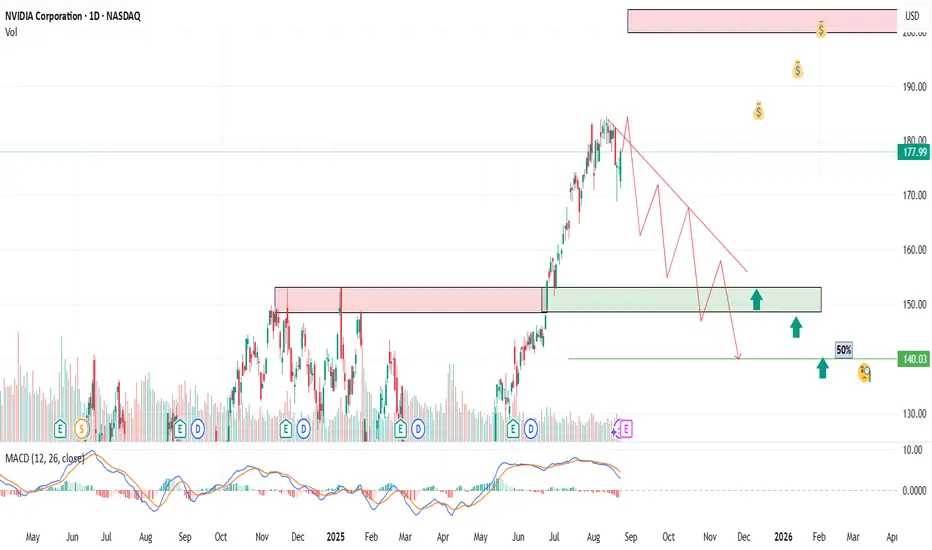
NVDA – Decision Week Ahead $200 or $140?NVIDIA (NVDA) has been on an incredible bull run, climbing from $140 to nearly $180+ in just 2–3 months. Now, with earnings coming this week, the market is at a decision point: Will the AI leader extend its rally toward $200 🚀, or will profit-taking and cautious guidance send it back toward $150 📉?
🟢 Bullish Scenario
Entry points: 170→165→160
Targets: $185 → $190 → $200+
Lose $170? I’ll wait patiently for $150–140 before sizing back in.
🔴 Bearish Scenario – Pullback to $150–140
If earnings disappoint or guidance weakens (China restrictions, slowing demand), NVDA could unwind toward prior support.
Entry Points (for long re-entry after correction):
$160
$150
$140
Targets on recovery: $160 → $175 → $190
📌 Disclaimer: This post reflects my personal trading plan, not financial advice. Always do your own research and use proper risk management.
NVDA trade ideas
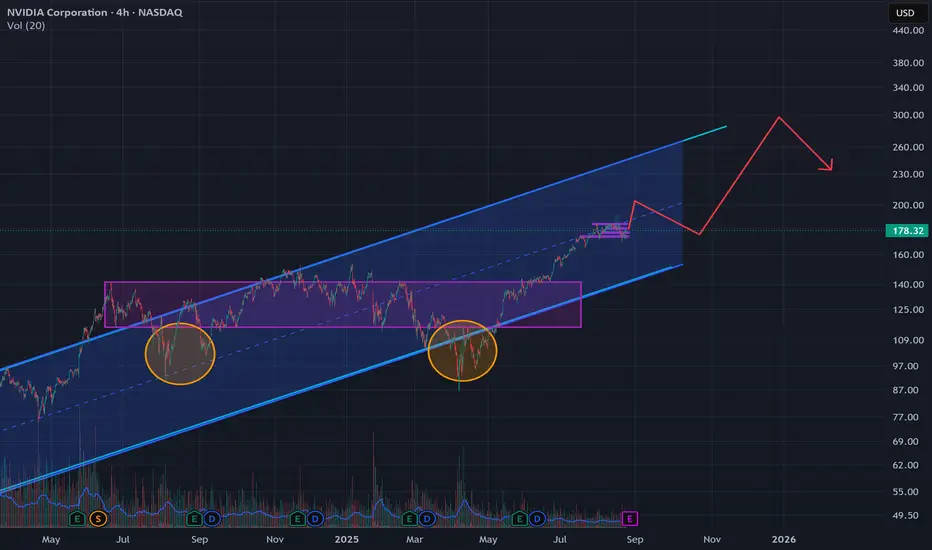
NVIDIA Trend ForecastFollowing Nvidia’s upward move within the blue channel, there appeared to be a period of liquidity accumulation, marked by a pullback into the purple box. Within this range, two instances — highlighted in the yellow circles — suggest possible order gathering or liquidity collection.
The price has now broken out of the purple box, and if positive news emerges, it will likely continue its upward move toward the $200 level. This is not a buy or sell recommendation — it is solely my personal opinion. If the news develops as I anticipate, the trend will probably continue in the direction indicated by the red arrow.
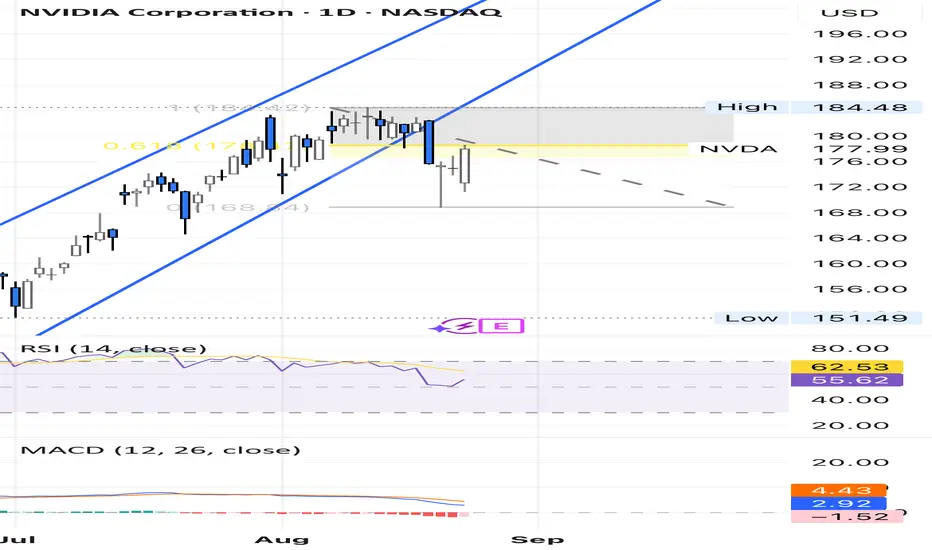
NVIDIA shows signs of a potential breakout.If NVIDIA breaks above $180, we should analyze the candlesticks at $183 and prepare for a move toward $190.

NVIDIA shows signs of a potential breakout.If NVIDIA breaks above $180, we should analyze the candlesticks at $183 and prepare for a move toward $190.

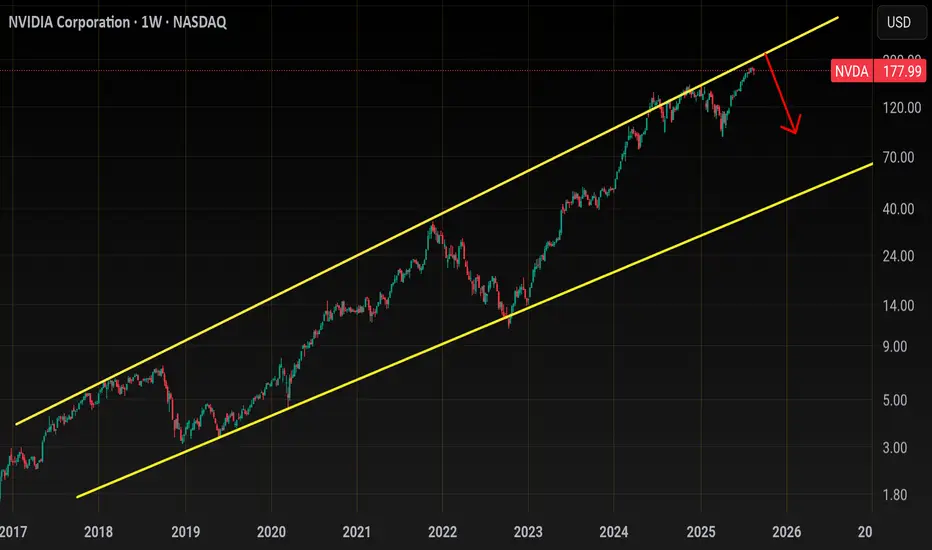
NVIDIA new possible down trend An analysis of Nvidia's price action shows it trading within a four-month-long ascending channel. The price has recently broken below the channel's support line and has since retraced to a key Fibonacci level. This price action, combined with bearish indicators from the MACD and RSI on the daily and weekly charts, presents a technical case for a potential trend reversal.
Nvda... where we standEarnings this week...
Upside move 195-200 if they pump this but any opening near 200 should be faded .. I'm looking towards a 140 test in Sept - Oct.
Weekly is really overbought , I wouldn't chase this up here.. I'm looking for a move similar to what TSM did after blow out earnings which is gap up to weekly trendline and fade
Biggest red flag here is NASDAQ:SMH (Chipsector)
Zoomed out you can see price is rolling over at resistance here
Zoomed in and you can see , Wyckoff distribution
You'll be lucky if SMH gives you one more pop but this sector and the underlying top stocks are headed for a 20-30% correction (Maybe more).. I'd stay away from the longs until Seasonality flips again around late Oct early November
See the link from the NASDAQ:AVGO and NYSE:TSM .. they are already finished. NVDA IS THE FAT LADY SINGING.
Eventually NVDA will retest the bottom of this channel , this move will like come with a break below 90 but first we would have to break back below 140..
So my analysis is, Nvda has room for 190-200 if it beats on earnings, if it goes red and drops below 167 it's a short back to 140's..
Either way, we will see 140
The 4 Steps That Triggered NVDA BUY - "I spotted a red bar "NVIDIA (NVDA) BUY Setup Using the Short Squeeze Mindset 💻📈
NVIDIA continues to dominate the AI revolution, but trading it isn’t always easy. Pullbacks shake out weak hands, while volatility tricks retail traders into shorting.
That’s why you need the Short Squeeze Mindset.
NVDA is Setting Up for a BUY 🚀
👉 On the Daily Chart, NVDA printed a green bar 🟩, confirming bullish trend strength.
👉 On the 4H Chart, I spotted a red bar 🟥, which tempts shorts to enter — but they’re stepping into a trap.
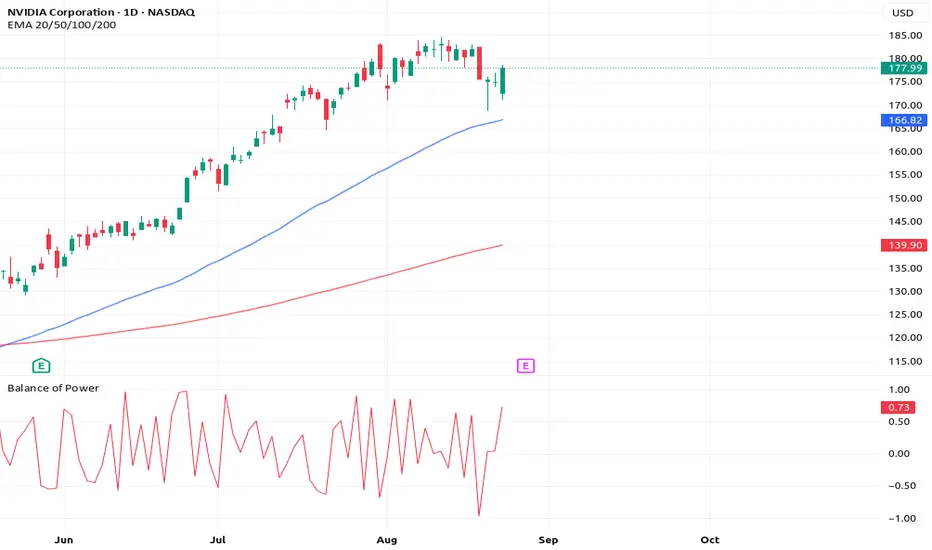
👉 And here’s the extra confirmation: Balance of Power (BOP) = 0.7+ on the Daily.
This tells us institutions are firmly in control — demand outweighs supply, and bears are just adding fuel to the fire.
The 4 Steps That Triggered NASDAQ:NVDA BUY 🎯
1️⃣ Rocket Booster Strategy
Find big trending stocks → NVDA is leading the AI/tech sector.
Daily green 🟩 confirms trend strength.
2️⃣ Momentum Trading Style
NVDA is outperforming NASDAQ.
Strong relative strength means it’s a prime BUY candidate.
3️⃣ Short Squeeze Mindset
Daily = green 🟩
4H = red 🟥
Shorts think the pullback is safe → but daily momentum will squeeze them out.
4️⃣ Stochastic Overbought Zone
Overbought ≠ sell. In a squeeze, it confirms powerful breakout continuation.
Extra Note on BOP 🟩📊
The Balance of Power reading above 0.7 on the daily chart is rare.
It means:
Buyers are overwhelming sellers
Institutions are quietly accumulating
Breakout continuation has a high probability
This strengthens the BUY thesis for NVDA.
How To Trade NVDA BUY 🔑
📊 Step 1 – Confirm Daily Trend
Daily = green bar 🟩 + BOP > 0.7 = buyers in control.
📊 Step 2 – Watch 4H Pullback
Shorts enter on red bar 🟥 → wait for them to get trapped.
📊 Step 3 – Trigger Entry
Look for bullish engulfing or hammer on 4H.
Enter when confirmation candle breaks.
📊 Step 4 – Targets & Risk
TP1: recent daily swing high
TP2: psychological levels (e.g., $1,000)
SL: below 4H swing low
What Makes This Matters 🌍
NVDA isn’t just another stock. It’s the heartbeat of AI momentum.
When you combine the Short Squeeze Mindset with BOP > 0.7, you’re aligning with both price action and institutional order flow.
That’s the edge.
🚀 Keep this NVDA setup in focus — the squeeze is coming.
⚠️ Disclaimer: Not financial advice. Trading involves risk. Always use proper risk management and demo test your strategy.
NVDA Ready to Break Out? Targeting $200NVIDIA (NVDA) has been consolidating inside an upward wedge, and the price action is looking primed for a breakout to the upside. Based on this technical setup, I believe NVDA has the potential to push toward the $200 level. 📈
I’ll walk through the chart, key levels to watch, and why this wedge could be the launchpad for NVDA’s next big move.
👉 What do you think—will NVDA break out or fake out? Drop your thoughts below!
#StockMarket #Trading #DayTrading #Investing #TechnicalAnalysis #OptionsTrading #StockTrader #StockTips
Past Resistance = Future Support: SPX500 and Others UpdateIt is August 21, 2025. I have entitled this video, Past Resistance = Future Support. As I purchased many stocks from the yearly lows of 2025, I anticipate, from a probabilistic perspective, that this new retracement will not last, but alas! It shall be a 3% to 5% pullback.
I investigate, from a technical perspective, the chart built on the principles and experience I have gained over the years of watching the markets: from the smallest (general) timeframes to the biggest.
Stocks have been pent up for months, coiling, building up weekly pressure. It is time to grow. Time to invest. Time to be patient over the course of one or two quarters.
Expectation:
A Halloween or Thanksgiving rally. Targets will be hit by December 2025 to January 2026.

Nvidia Shares Maintain Bearish Bias Near $170Over the past three trading sessions, Nvidia’s shares have posted a sharp decline, accumulating losses of more than 3% in the short term. For now, the emerging selling bias around the stock remains in place, as the market fears a potential overheating of the artificial intelligence industry. Added to this is the anticipation of the company’s results on August 27, which may show difficulties in revenue, mainly due to concerns that sales in China have weakened in recent months amid the intensifying trade war. Earnings per share are expected to come in around $0.94, but uncertainty remains as to whether this figure can hold given possible performance challenges. As long as this uncertainty persists, selling pressure on the stock could remain in the short term.
Uptrend Channel at Risk
Recent sessions have shown a clear shift in the bullish outlook that Nvidia had been sustaining in prior weeks. A significant bearish correction has emerged, halting the advance of the short-term uptrend channel and leading to a breakdown of its lower boundary. As long as selling pressure continues, this previous channel may lose relevance and give way to a broader bearish scenario, provided the bearish bias remains dominant.
Technical Indicators
RSI: the RSI line has begun to show a downward slope, now approaching the neutral 50 level. If it breaks below this threshold, selling momentum could become dominant in the short term, paving the way for stronger bearish pressure on the chart in the upcoming sessions.
MACD: the MACD histogram is currently moving below the 0 line, reflecting that short-term moving averages have entered a sustained bearish territory. If the histogram continues to decline, selling pressure is likely to strengthen further in the short term.
Key Levels to Watch:
$184 – Main Resistance: corresponds to the area of recent highs. A sustained recovery above this level could reactivate a bullish bias and bring back strength to the uptrend channel.
$173 – Near-Term Support: current congestion zone of recent weeks and the most immediate barrier. A sustained move below this level could trigger a stronger bearish bias in the short term.
$162 – Crucial Support: aligned with the 23.6% Fibonacci retracement. A decisive break below this level would confirm a bearish structural shift, opening the door to a new selling trend in the short term.
Written by Julian Pineda, CFA – Market Analyst

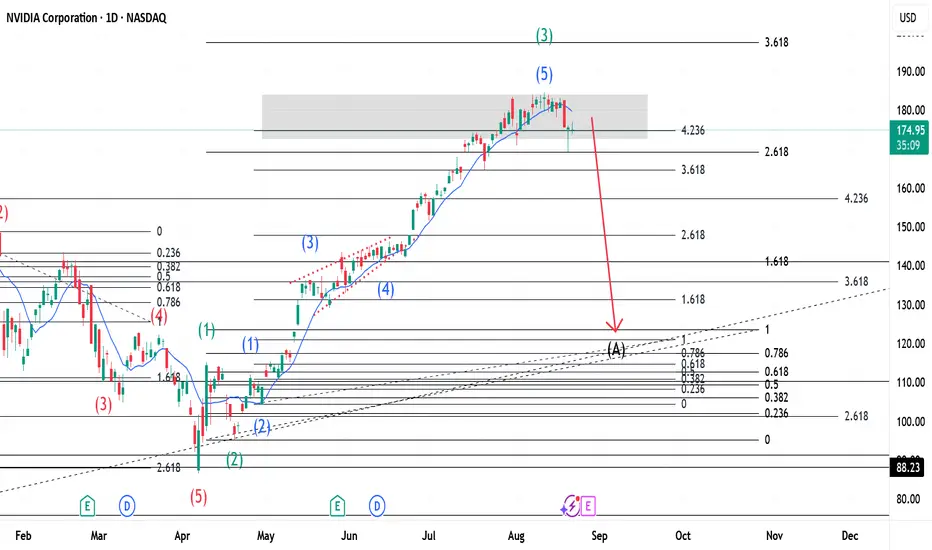
$NVDA and the Elliott Wave Theory(Updates)This is an update of a previous publication(link below). With price above the 423% Fib. level, this means that there is overbuying. Using Elliott Wave Theory we can see that Wave 3(Green) is complete with 5 waves(shown in Blue) inside it. What should follow from this is a Flat correction for Wave 4(Green) because Wave 2(Green) was a Zigzag. The Red arrow shows price direction only and points to a Wave A(Black) as our first wave for the Zigzag. This arrow does not show precise price ending rather shows direction. For more on the same, go to:

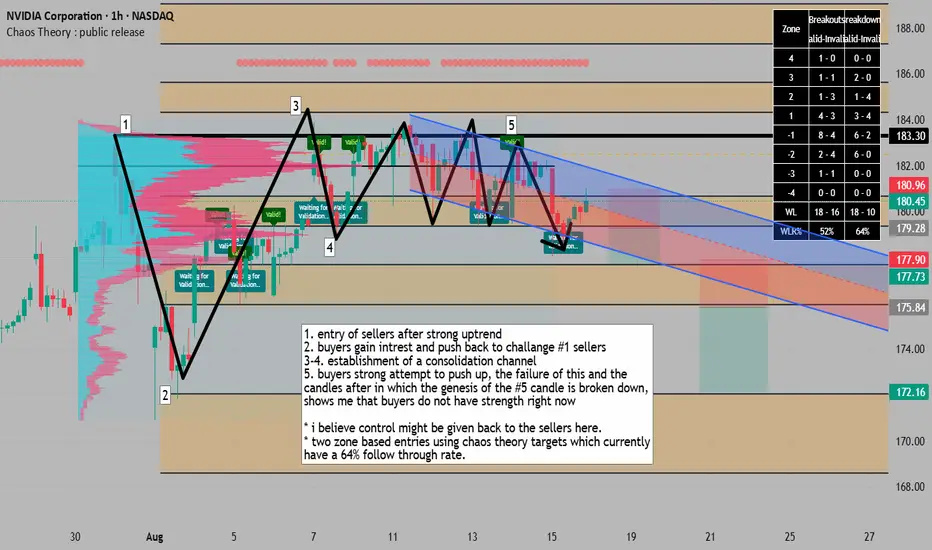
sellers showing signs of exhaustion, potential return to support1. entry of sellers after strong uptrend
2. buyers gain intrest and push back to challange #1 sellers
3-4. establishment of a consolidation channel
5. buyers strong attempt to push up, the failure of this and the
candles after in which the genesis of the #5 candle is broken down,
shows me that buyers do not have strength right now
* i believe control might be given back to the sellers here.
* two zone based entries using chaos theory targets which currently
have a 64% follow through rate.
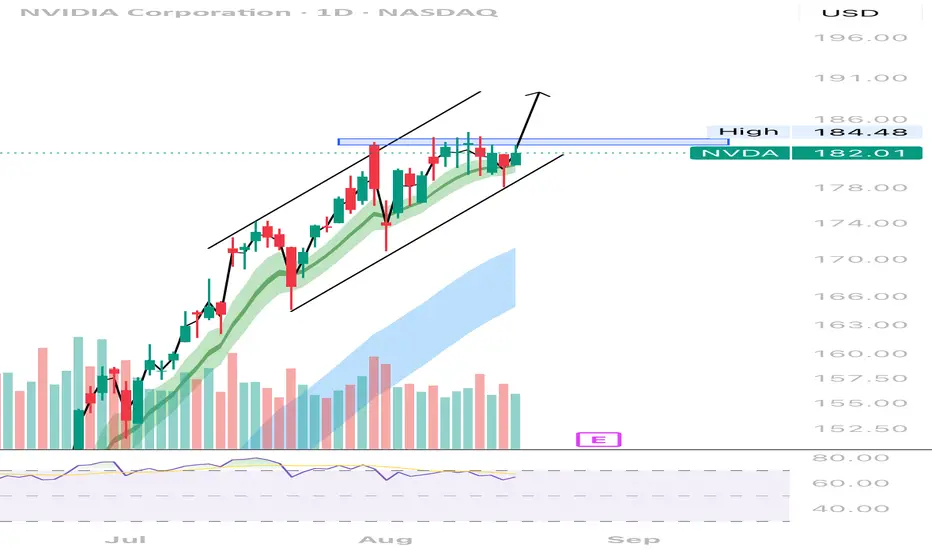
NVDANVDA Weekly:
The price is trading within a well-defined ascending channel, with the upper trendline acting as resistance and the lower trendline as support.
The price recently touched the upper boundary of the channel around $182–$185 and has since slightly retraced.If the price breaks above the $182–$185 resistance (upper channel boundary), we could see accelerated bullish momentum. The next potential target would be based on an extrapolation above the channel or psychological levels such as $200.
The price appears to respect the dashed midline of the channel as a dynamic support/resistance, signifying its importance in price movements.
A previous consolidation zone between $135 and $150 (highlighted by the shaded gray area) now represents a major support area. If the price declines, the stock may test this zone.
If the pullback continues, the $150–$160 range serves as a critical support zone. Breaking below this range might send the stock toward the midline of the channel or the $140 region.

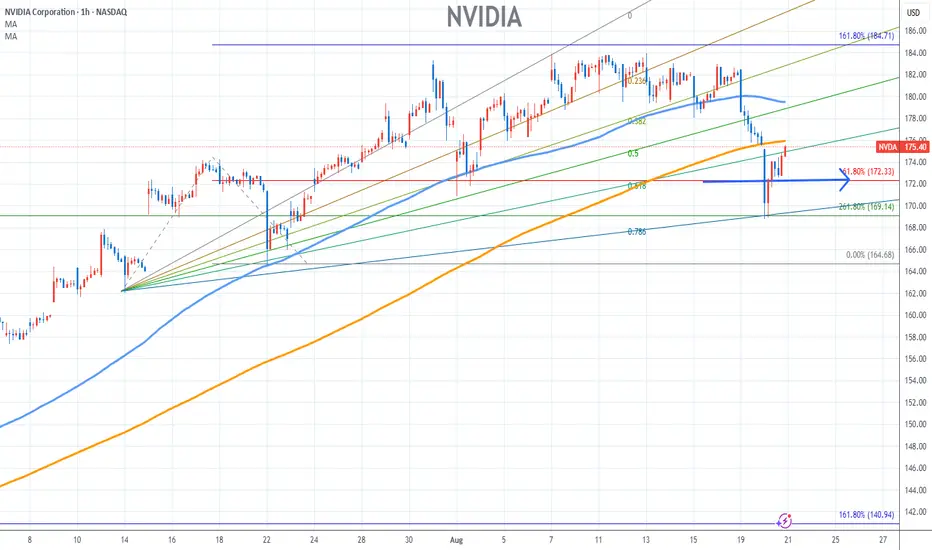
NVIDIA Stock Chart Fibonacci Analysis 082025Trading Idea
1) Find a FIBO slingshot
2) Check FIBO 61.80% level
3) Entry Point > 172/61.80%
Chart time frame:B
A) 15 min(1W-3M)
B) 1 hr(3M-6M)
C) 4 hr(6M-1year)
D) 1 day(1-3years)
Stock progress:C
A) Keep rising over 61.80% resistance
B) 61.80% resistance
C) 61.80% support
D) Hit the bottom
E) Hit the top
Stocks rise as they rise from support and fall from resistance. Our goal is to find a low support point and enter. It can be referred to as buying at the pullback point. The pullback point can be found with a Fibonacci extension of 61.80%. This is a step to find entry level. 1) Find a triangle (Fibonacci Speed Fan Line) that connects the high (resistance) and low (support) points of the stock in progress, where it is continuously expressed as a Slingshot, 2) and create a Fibonacci extension level for the first rising wave from the start point of slingshot pattern.
When the current price goes over 61.80% level , that can be a good entry point, especially if the SMA 100 and 200 curves are gathered together at 61.80%, it is a very good entry point.
As a great help, tradingview provides these Fibonacci speed fan lines and extension levels with ease. So if you use the Fibonacci fan line, the extension level, and the SMA 100/200 curve well, you can find an entry point for the stock market. At least you have to enter at this low point to avoid trading failure, and if you are skilled at entering this low point, with fibonacci6180 technique, your reading skill to chart will be greatly improved.
If you want to do day trading, please set the time frame to 5 minutes or 15 minutes, and you will see many of the low point of rising stocks.
If you want to prefer long term range trading, you can set the time frame to 1 hr or 1 day
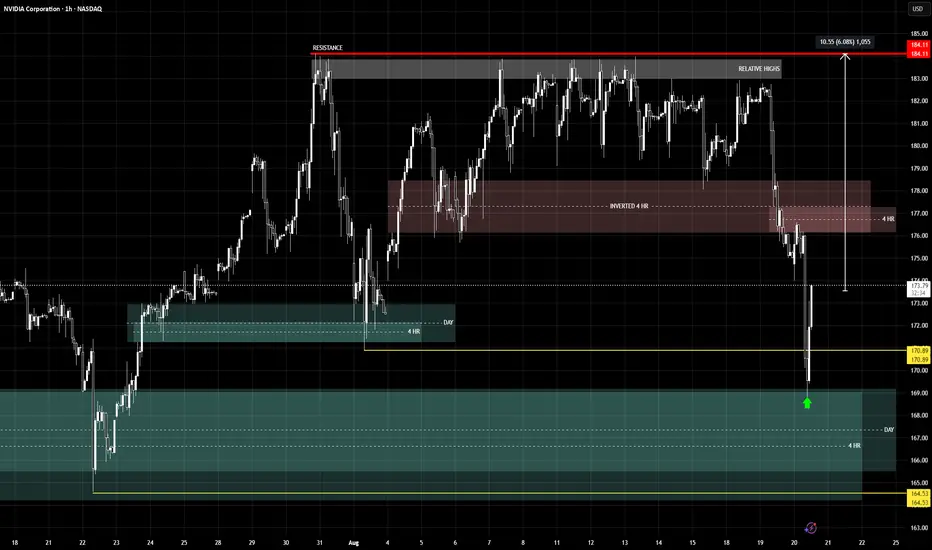
NVDA at a Pivotal Spot – Aug 21NVDA at a Pivotal Spot – Reversal or Just a Dead Cat Bounce? 🚨
Technical Analysis (1H Chart)
NVDA sold off hard from the $182.5 zone, breaking structure and sliding toward $170 before bouncing. Current price is hovering near $175–176, right under a descending trendline.
* Resistance Levels:
* $178.0 → First key rejection point (previous supply & resistance line).
* $182.5 → Strong supply zone, coincides with prior range high.
* Support Levels:
* $172.5 → Short-term demand from recent bounce.
* $170.0 → Stronger base support; breakdown risks deeper selloff.
* Indicators:
* MACD is turning bullish with histogram rising, suggesting short-term momentum favoring upside.
* Stoch RSI is overbought, which warns of a possible pullback after this bounce.
* Trendline still points downward; NVDA must reclaim $178–182.5 to flip bullish.
⚡ Intraday Bias: Cautious bullish momentum but still within a bearish macro structure. $178–182.5 is the line in the sand.
GEX / Options Sentiment
The options board reinforces the technical zones:
* Upside Gamma Resistance:
* $178.0 → 2nd Call Wall (79%)
* $182.5 → Highest positive NetGEX + Major Call Resistance
* Above $182.5, upside unlocks $187.5 → $190
* Downside Gamma Support:
* $172.5 → 2nd Put Wall (–81%)
* $170.0 → Strongest Put Support (–87%)
* Break below $170 risks fast flush toward $167.5
* Sentiment:
* IVR 20.2 (low → option premiums cheap).
* Options flow leaning slightly bearish with 7.9% Calls, heavy put concentration below $172.
Trading Thoughts & Suggestions
* Bullish Setup: Consider short-dated Calls if NVDA can hold above $175 and break $178 with volume. Target $182.5, then $187.5. Stop under $172.
* Bearish Setup: If rejection comes at $178–182.5, Puts back toward $172.5 and $170 make sense. Strong stop above $183 to manage risk.
Conclusion:
NVDA is at an inflection zone. Short-term bounce looks promising, but unless bulls push through $178–182.5, bears keep control. Watch options walls closely — they align with key technical levels.
Disclaimer: This analysis is for educational purposes only, not financial advice. Always do your own research and manage your risk.

NVIDIA BUY SET UPNVIDIA has broken out of its triangle consolidation, confirming strong upward momentum. Expecting continuation with new higher highs ahead. price target 250

BEARISH CASE: NVDA SHOWING CLASSIC PARABOLIC EXHAUSTION BEARISH CASE: NVDA SHOWING CLASSIC PARABOLIC EXHAUSTION 📉
After an unsustainable 300%+ rally since Q3 2023, NVDA is displaying textbook parabolic blowoff characteristics. Weekly chart shows fractal trend violation with price touching upper resistance for first time since 2023.
4-hour chart reveals rapid breakdown below parabolic SAR support - a key reversal signal after extended uptrends. RSI at weekly overbought levels (70+) for prolonged period, historically precedes significant corrections.
Multiple Fibonacci retracement levels ($110-130) now acting as downside targets, representing 30-40% correction potential from all-time highs.
Institutional rotation away from AI premium already in progress. Extremely elevated valuation metrics combined with technical exhaustion pattern suggests profit-taking accelerating.
The AI narrative has pushed NVDA's market expectations beyond reasonable execution capabilities. Watching for confirmation at $150 support level - a break there opens path to much larger correction.
NASDAQ:NVDA #TechnicalAnalysis #BearishSetup

NVDAEVENTS:
1. Relative highs avoided (from July 30 to August 19)
2. Price swept low of August 1 (8% retrace of ATH)
3. Bullish reaction (wick up) from bullish day & 4hr gap
OBJECTIVE:
To Break all time high (ATH)
HISTORY:
Previously, on April 7 2025, price swept low of August 5 2024 (40% retrace of ATH)
$NVDA Huge Buy FridayThere was a massive NASDAQ:NVDA buy at open Friday of $1.1 Billion. It's been sideways for a while. Could be good for a push.

NVDA short (Daily chart)MVP SYSTEM
this one is fairly obvious.
MOMENTUM- rsi broke from the triangle; sharply lower
VOLUME- not only was the volume light during this last move went upward, now there is a larger volume red engulfing candle
PRICE- as stated, large red candle. price broke below the topping area. and there is a smooth/rounded top here.
the weekly chart had a breakout to the upside; i suspect this move downward to be a pullback to the last support
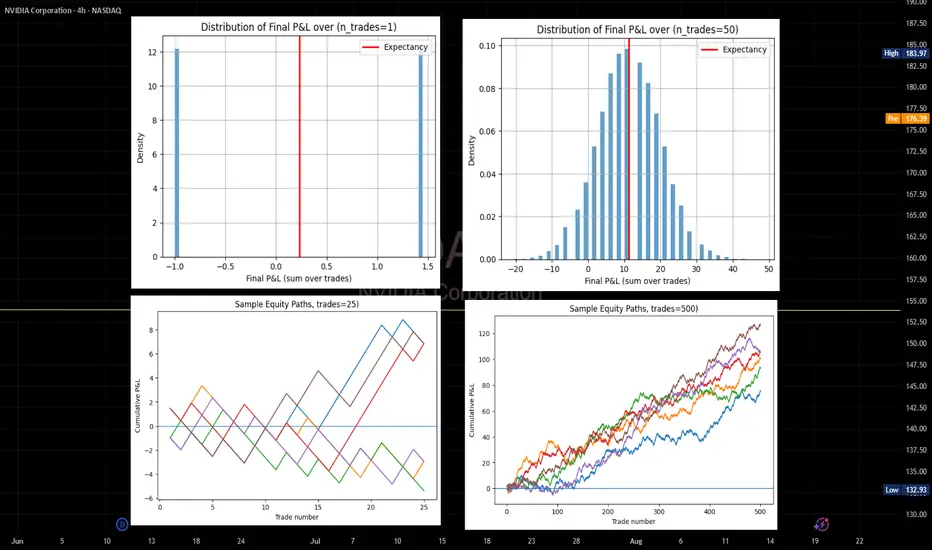
The Many Roads of Your Trading SystemThere are many possible journeys for your account — some lucky, some painful. But why is it that only one of them really matters? Let’s find out.
1. A Glimpse Into the Future (With All Its Paths)
How confident would you feel if your trading plan could show you not just the average outcome you can expect, but also the good, the bad, and even the ugly roads your account might take?
In this blog, we’ve talked about expected value as the trader’s true laser vision: the ability to project the evolution of your account instead of obsessing over the price of a single trade.
Today, we’ll turn that laser forward in time. We’ll see how expectancy becomes real when trades start piling up, and how a couple of simple simulations let us peek into the different futures of a trading system.
2. The Power of Repetition: When the Average Becomes Real
A single trade tells you nothing. It may end in profit, it may end in loss — but in statistical terms, it’s just noise.
Things change once you start repeating trades under a rule-based system. Variance begins to smooth out, and the average result — expectancy — becomes visible.
Think of flipping a coin: if you flip it 5 times, you might get 4 heads and 1 tail. Misleading, right? But flip it 500 times, and the ratio will settle close to 50/50.
Trading works the same way: a system is not judged by one trade but by hundreds or thousands. And here’s where many beginners stumble: they overvalue a single outcome, feeling euphoric after a win or devastated after a loss. That emotional swing is one of the main reasons traders blow up their accounts. But judged in the bigger picture, those single dots are meaningless — what matters is the long-run average.
3. The Trap Visualized
When you look at trades one by one, the picture is chaotic. Some dots are up, some are down, scattered without a clear pattern.
The plot at the top left is exactly what fuels emotional trading. The blue bars are single-trade outcomes — random wins and losses. The red line is expectancy. When you zoom in on just one bar, you’re focusing on noise, whether it’s a big win or a big loss. In reality, that focus is a misleading: a single trade tells you nothing about the true edge of your system.
But when you let your rule-based system play out over time, the story changes. As the top-right plot shows, trades accumulate, those scattered outcomes begin to cluster, and the distribution slowly aligns with the red line. The noise shrinks, the signal emerges, and the expectancy — the true value of your system — takes center stage.
4. From One Trade to Many: The Path of Your Account
Once we shift from a single trade to many trades, the picture changes completely. Instead of scattered dots, we now see full equity paths — different possible journeys of an account following the same rules over time.
The bottom-left plot shows that with just a handful of trades (10 or 20), the paths zigzag wildly. Some end positive, others in losses—here, luck still calls the shots!
The bottom-right plot shows that with hundreds of trades (200, 500, or more), the paths converge around the system’s true average. Luck fades away, and expectancy takes the lead.
5. Expectancy = Realistic Confidence
Together, these lessons are powerful:
A single trade means nothing — it’s just random variance.
Many trades reveal the true destiny of the system — expectancy gradually asserts itself.
This isn’t about promising that losses won’t happen. It’s about accepting that your account’s future is always a range of possible scenarios. The key fact is this: if your system has positive expectancy, mathematics is on your side — but only if you give it enough repetitions for the signal to rise above the noise.
So let me ask you: do you know the expectancy of your system? If you don’t, then trading without it isn’t just risky — it’s irresponsible.
6. Conclusion and What’s Next
So here’s the takeaway:
Expectancy is your compass.
Monte Carlo simulations are the flashlight showing you the different roads that compass might lead you down.
The future of your trading isn’t a black box. It’s a set of possible paths you can explore, measure, and prepare for.
In the next post, we’ll focus on the engine that makes expectancy work in real life: risk management. Because even with a winning system, if you risk too much on each trade, variance can knock you out of the game before expectancy has a chance to do its job.
For Readers Interested in Quantitative Trading
I have prepared a Python repository to accompany this post. You can find it on GitHub by searching for the repository name "How To Lambo." Inside, you’ll find the notebook probabilistic_trading.ipynb, which lets you experiment hands-on with the probabilistic trading concepts discussed here. Think of it as opening the hood of the car and seeing how the engine actually works.
To recreate the plots from this post:
Run monte_carlo_pnl to visualize the dispersion of single-trade outcomes. You’ll see clearly that no single result reflects the true expectancy of the system — it’s all variance.
Run plot_equity_paths with different values of n_trades. At 50 trades, the equity curves look like a jungle of chaotic, diverging paths. At 500 trades, they transform into something resembling a highway of parallel lanes — stable, predictable, and clustered around the system’s mean.
And that’s just the beginning. The notebook follows a clear conceptual line, guiding you interactively through the logic of probabilistic trading. It’s an open invitation to explore, test, and see for yourself the power of expectancy in action.
Nvidia - This is clearly not the end!📐Nvidia ( NASDAQ:NVDA ) will simply rally more:
🔎Analysis summary:
Yes, over the past couple of months, Nvidia has been rallying another +100%. But looking at the higher timeframe, this is still not the end of the unbelievable bullrun. Following the rising channel pattern, Nvidia can rally another +20% before we might see a potential retracement.
📝Levels to watch:
$250
SwingTraderPhil
SwingTrading.Simplified. | Investing.Simplified. | #LONGTERMVISION
