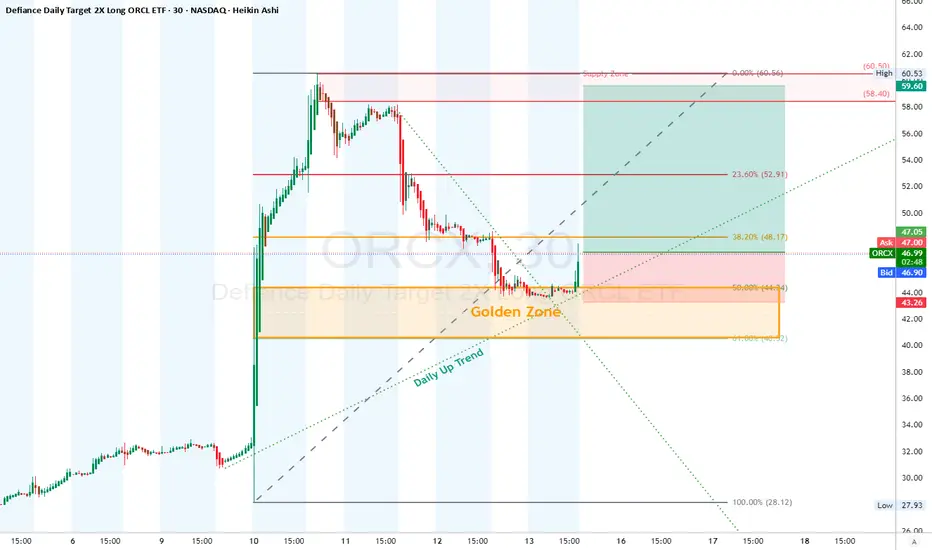
ORCL 2x Leveraged ETF (ORCX, 30-min chart) Long Golden Zone
ORCX ripped from ~28 lows to 60.5 highs in just a few sessions — massive parabolic move.
After peaking at 60.5 (Supply Zone), price retraced aggressively, dipping back to the Golden Zone (Fib 0.618–0.65) around 43–44.
Buyers stepped in right at demand, confirming this zone as valid institutional buying level.
Current price 47.45, just reclaimed the 38.2% retracement at 48.1.
🔎 Trend & Structure
Macro Trend: Bullish (daily uptrend intact).
Correction: Healthy retracement into Fib Golden Zone (classic continuation setup).
Structure Break: Strong bounce off golden zone suggests Wave 2 correction may be over → prepping for Wave 3 push.
🏦 Supply & Demand
Demand Zone (Golden Zone): 43 – 44.5 (critical long entry area, already tested).
First Supply Test: 52.9 (Fib 23.6%).
Major Supply Zone: 58.4 – 60.5 (previous peak, high liquidity zone).
🛠 Trade Idea (Swing Setup)
Entry Zone: 44 – 47 (Golden Zone already tested).
Stop Loss: 42 (below demand).
Take Profit Targets:
TP1: 52.9 (Fib 23.6%).
TP2: 59.6 (supply zone retest).
TP3: 60.5+ (breakout continuation).
🎯 Risk/Reward Estimate: ~1:3 to 1:4 depending on execution.
⚖ Risk Management
Max risk per trade = 1-2% of account equity (since ETF is leveraged).
Move SL to BE once 52.9 (TP1) is tagged.
Scale out partially at 52.9, let rest ride to 59–60.5.
If parabolic rally resumes, trailing stop may capture new ATHs.
"Amateurs want to be right. Professionals want to make money." – Anonymous
⚠️ Disclaimer
This is not financial advice. For educational purposes only. Leveraged ETFs carry extra risk — trade small and respect stops.