PLUG | Support–Resistance FlipPrice has reclaimed the $2.50 level, which previously acted as resistance and is now turning into near-term support. Holding above this zone keeps the structure constructive, with buyers defending pullbacks above the rising EMA. A sustained hold above $2.50 opens room for a continuation move, while a failure back below would invalidate the breakout and shift bias neutral-to-bearish.
What traders are saying

PLUG Power – Context, Contracts & 2026 OutlookNov 2025 – Convertible Bonds
Plug Power issued senior convertible notes to raise liquidity and refinance short-term high-interest debt. This move provides cash without immediate dilution, as conversion into shares is optional and in the future, extending debt maturities and reducing near-term financial pressure.
New Contracts & Pipeline
Recent months saw major contracts signed for PEM electrolyzers and green hydrogen solutions, including projects in Europe and the US. These agreements expand Plug’s commercial pipeline and confirm strong industrial demand.
Recent Price & Volatility
After a significant rally earlier in 2025, the stock has entered a consolidation phase with high volatility, reacting technically to refinancing news and market sentiment.
💡 2026 Outlook
Revenue growth expected from implementation of hydrogen plants and electrolyzer modules
Improving operating margins through cost optimization and scaling production
Cash flow & debt management strengthened by recent refinancing
Market sentiment will remain linked to green hydrogen adoption and quarterly results
PLUG remains a high-potential, high-volatility stock.
Recent financial maneuvers and new contracts support growth expectations, but achieving sustainable margins and profitability in 2026 will be key to confirming a long-term uptrend.
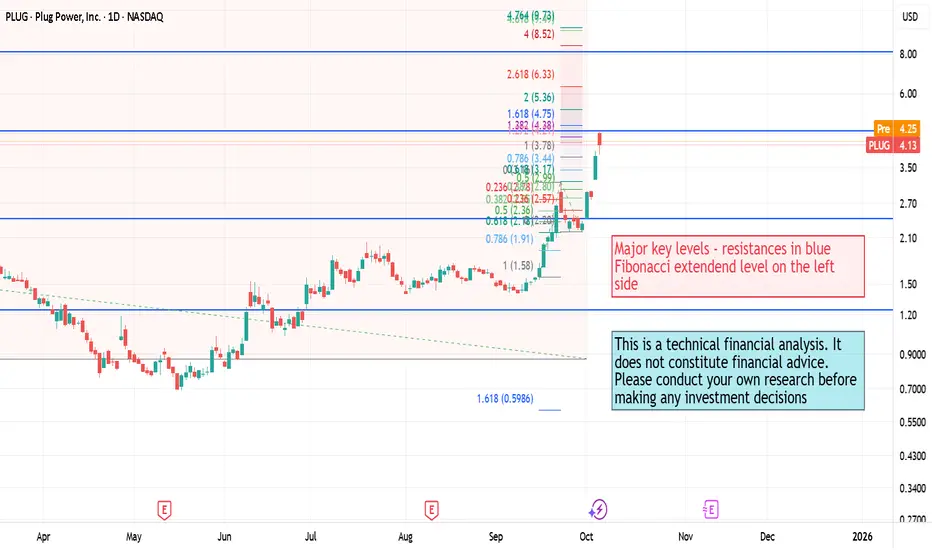
Price Levels & Key Resistance
Let’s highlight the main resistance areas, which if broken could become support, and potential price targets suggested by Fibonacci extensions. These levels are crucial for monitoring breakout potential and establishing reference points for traders.
This is not a financial advice.

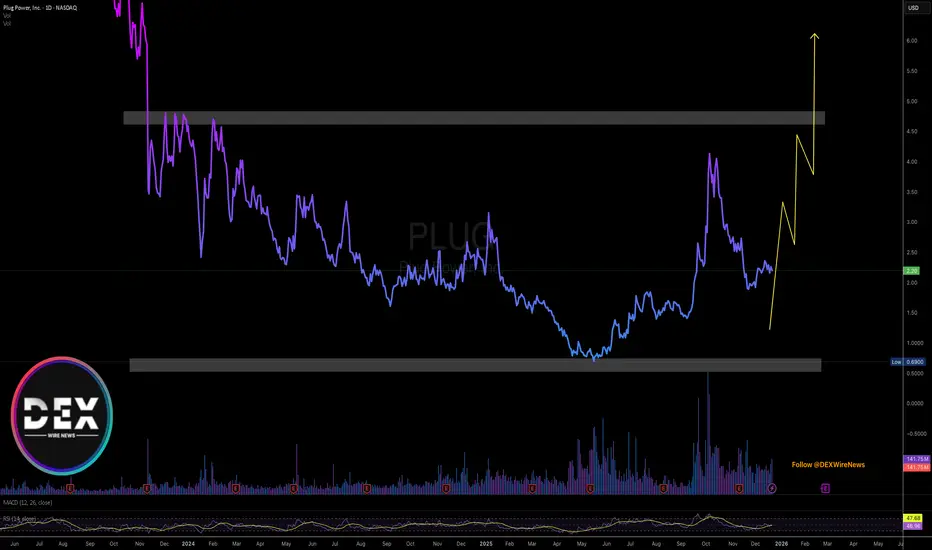
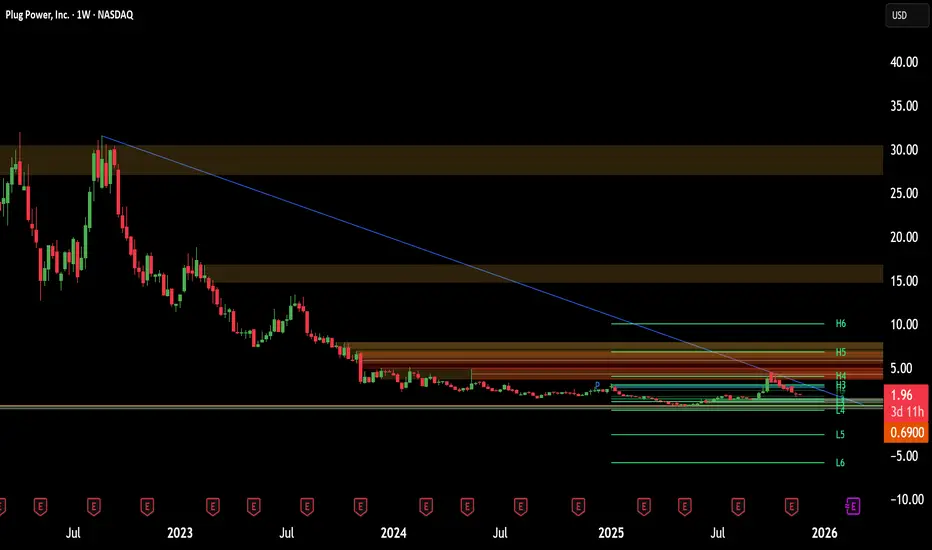
PLUG long-term TAPLUG has been pumped and dumped pretty hard, but it's not dead, as a matter of fact it has a positive bullish formation on weekly since the last few months, moreover, monthly frame has finally bottomed out for the first time since 2022 and has regained the support level, it's not yet bullish on monthly but it's a significant improvement. Currently, there's a consolidation on mid-term with rising trend strength which is in the formation process of bullish trend continuation.
Also, when assessing their fundamental priorities or incentives, you may want to consider the demand for their products during the AI boom which can be the further trigger for the growth.

Plug Power: Shaping the Future of Green Hydrogen Through InnovatIn recent years, green hydrogen has emerged as a key player in the global energy transition, and Plug Power is at the forefront of this movement. The U.S.-based company develops fuel cells, electrolyzers to produce hydrogen from water, and all the necessary infrastructure to store and distribute clean energy. In other words, Plug Power doesn’t just create components, it builds a complete ecosystem to make hydrogen a viable and scalable energy source.
Latest Quarter: Growth and Positive Signals
In the second quarter of 2025, Plug Power reported revenues of $174 million, up 21% from the same period last year. This strong growth highlights the increasing demand for hydrogen solutions across industrial and transportation sectors.
Particularly notable is the expansion in electrolyzer sales, with revenues tripling compared to the same quarter in 2024. This indicates that companies and utilities are investing more in technologies to produce green hydrogen at scale and Plug Power is ready to provide the critical infrastructure.
The gross margin also shows encouraging signs: while still negative at -31%, it has improved significantly from -92% in Q2 2024. This reflects the effectiveness of cost optimization strategies and the company’s growing operational expertise.
Investments continue through the Project Quantum Leap, a strategic initiative aimed at improving efficiency and sustainability. Although these non-cash expenses,about $80 million,impact quarterly results, they are essential investments for long-term growth.
Outlook for the Next Quarter and Beyond
Looking ahead to Q3 2025, revenues are expected to continue growing, with a more controlled loss per share compared to previous quarters. Plug Power aims to strengthen margins, reduce cash burn, and expand deliveries of electrolyzers and hydrogen infrastructure.
Over the longer term, the company’s vision is compelling: building a fully integrated green hydrogen ecosystem, making this energy source not only sustainable but also commercially competitive. Government incentives and strategic partnerships further support growth prospects.
In summary, Plug Power combines technological innovation with strategic foresight: the company is growing, optimizing costs and operations, and positioning itself as a global reference point in the green hydrogen market.
This is not financial advice.
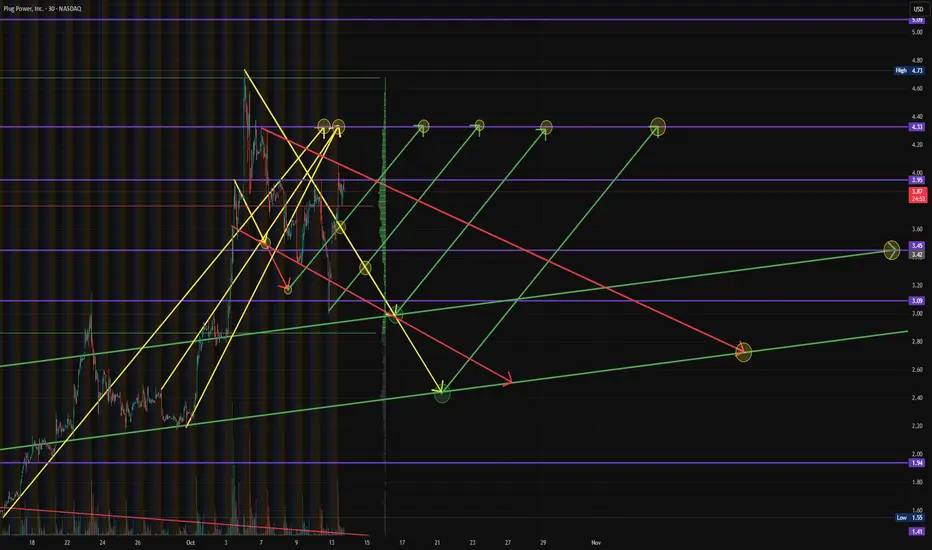
PLUG — Daily Momentum ReversalThis chart highlights a momentum-driven reversal attempt in PLUG following a prolonged downside phase. After sustained selling pressure, price formed a base and transitioned into an impulsive upside move, reclaiming short-term daily structure.
Recent price action shows strong bullish candles with follow-through, suggesting active participation rather than a single-session reaction. Price has moved back above rising short- and medium-term averages, indicating improving directional alignment on the daily timeframe.
Key structural observations:
The prior downtrend has been interrupted by a higher-low formation and upside expansion.
Multiple upside target interactions (“HITs”) signal engagement at key reference levels rather than immediate rejection.
Price is consolidating near reclaimed structure instead of retracing sharply, which supports short-term trend stability.
Multi-timeframe context:
Daily and 4H reference levels are closely clustered, forming a near-term balance zone.
Weekly reference levels remain overhead and may act as resistance unless acceptance develops above them.
Lower reference levels beneath price now define a developing support framework if consolidation occurs.
Momentum context:
The oscillator has shifted into a bullish regime, with projected continuation rather than immediate exhaustion.
Momentum recovery aligns with price structure, increasing the probability of continued range exploration before a larger directional resolution.
Forward-Looking Scenarios (Probabilistic)
Sustained acceptance above reclaimed daily structure favors continued upside probing toward higher-timeframe resistance zones.
Failure to hold current levels would more likely result in sideways consolidation or a shallow pullback, rather than an immediate trend reversal.
Broader directional clarity is expected as price resolves its interaction with weekly reference levels.
All levels shown are contextual reference points, not guarantees. This analysis is provided for educational and informational purposes only and should be confirmed using additional tools, timeframes, and risk management practices.

PLUG Long Alert: Accumulation Phase Before a Major Move📌 This long position was opened yesterday in the PREMIUM channel.
The trade remains valid and can still be considered for entry at current price levels.
📊 FUNDAMENTAL ANALYSIS
Plug Power (#PLUG) is one of the key players in hydrogen energy and fuel-cell technologies. The company operates across the U.S., Europe, and Asia, actively participating in the global energy transition and the development of “green hydrogen” infrastructure.
Fundamental growth drivers:
🟢 Strategic importance of hydrogen in the energy transition of the U.S. and EU
🟢 Government subsidies and support programs for clean energy
🟢 Growing interest from industrial, logistics, and energy sectors
🟢 Strong long-term potential of the hydrogen technology market
Fundamental risks:
🔴 The company is still unprofitable
🔴 High stock volatility
🔴 Dependence on external financing and government support
👉 Conclusion: PLUG is not a “safe haven” asset, but rather a speculative–investment play with elevated risk and significant upside potential if the market cycle turns favorable.
🛠 TECHNICAL ANALYSIS
📈 Scenario: LONG 🐂
Key technical factors:
▪️ Price is holding above the long-term ascending trendline
▪️ A consolidation base is forming after a deep correction
▪️ Strong rebound from a major support zone (around 2.10–2.30)
▪️ EMA 50 and EMA 200 are converging → potential medium-term trend reversal
▪️ RSI has exited oversold territory and is turning upward
▪️ MACD is forming a bullish divergence and preparing to move into positive territory
✅ The current structure points to accumulation and preparation for an impulsive move.
🏹 TRADE TARGETS
T1: 3.19
T2: 4.08
T3: 4.48
T4: 7.12
👉 Partial profit-taking is recommended, with the option to move the position to breakeven after reaching T1–T2.
📈 UPSIDE POTENTIAL
If the full scenario plays out, the upside may exceed +200–400% from current levels, making this setup attractive for both active trading and positional holding.
💼 Portfolio: #active_management
⚠️ The ideas published are not individualized investment advice and reflect the author’s personal opinion. Always manage risk responsibly.

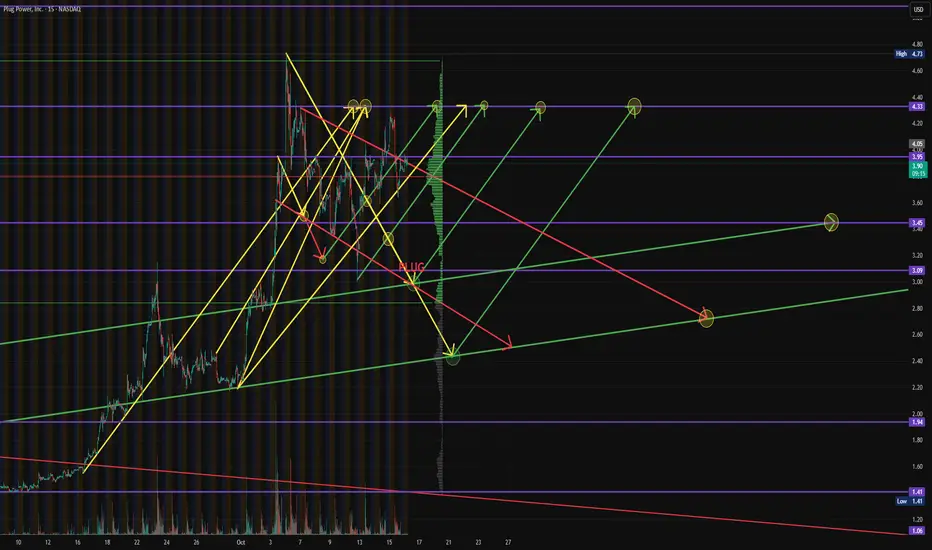
PLUG — Price–Time Confluence & Early Reversal StructureThis chart views PLUG through a price–time confluence lens, focusing on how price interacts with dynamic targets, trend structure, and momentum rather than fixed price forecasts.
Structural Context:
Price spent an extended period in a declining phase, with consistent lower highs and sustained downside pressure.
A basing process developed as downside momentum weakened and candle ranges began to compress.
Recent candles show a decisive shift away from the prior decline, marking the first meaningful structural change in this cycle.
Target Interaction:
Downside targets were completed during the decline, followed by the activation and confirmation of upside targets.
Recent target hits occurred through sustained price interaction rather than isolated spikes, suggesting participation rather than short-covering alone.
The current structure shows price holding above recently validated targets, an early sign of stabilization.
Trend & Baseline Behavior:
Price has reclaimed its rising median baseline after spending significant time below it.
The baseline has begun to curve upward, reflecting a transition from contraction to early expansion.
While trend strength is still developing, structure has improved relative to prior conditions.
Momentum Context:
Momentum reached deeply compressed levels during the decline and has begun to recover.
The projected cross highlights a potential momentum reset window, often associated with rotation or base-building rather than immediate trend continuation.
Momentum remains below historical extremes, consistent with early-phase reversals.
Forward-Looking Context (Non-Predictive):
If price continues to respect the reclaimed baseline and prior target zones, the developing structure remains constructive. Failure to hold recent levels would suggest continued consolidation within the broader range.
This chart is intended to visualize price behavior, time alignment, and momentum shifts, not to predict outcomes. All levels shown are dynamic reference zones that evolve with price.

Breaking; Plug Power Set to Install 5MW GenEcoPlug Power Installs 5MW GenEco Electrolyzer with Cleanergy Solutions Namibia for Africa’s First Fully Integrated Green Hydrogen Facility.
The Walvis Bay project plant, which officially opened in September, represents Africa’s first fully integrated commercial green hydrogen facility and will serve as the foundation for expanding hydrogen mobility across Namibia and neighboring markets.
Plug’s PEM GenEco electrolyzer is integrated directly at Cleanergy Solutions Namibia’s Hydrogen Dune site, which includes a 5MW solar park spanning more than 6.5 hectares and a 5.9 MWh battery energy storage system to produce renewable hydrogen off-grid. The locally generated hydrogen will support hydrogen-powered trucks, port and rail equipment, and small ships operating through the Port of Walvis Bay, while also supplying vehicles converted on site for dual-fuel operation using hydrogen and conventional fuels.
Financial Performance
In 2024, Plug Power's revenue was $628.81 million, a decrease of -29.45% compared to the previous year's $891.34 million. Losses were -$2.10 billion, 53.8% more than in 2023.
Analyst Summary
According to 13 analysts, the average rating for PLUG stock is "Hold." The 12-month stock price target is $2.15, which is a decrease of -2.27% from the latest price.
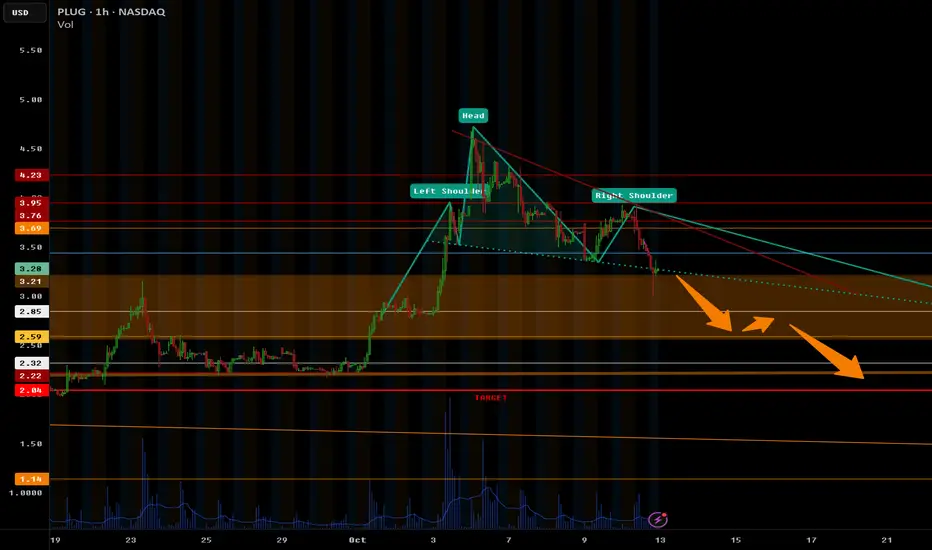
PLUG short.I'm looking for a PLUG Short on monday open. I see a head and shoulders pattern. I think it has a good possibility of opening high of course, but all my trades are just possibilities rather than setups. I'm ready to change my mind at any point.
Plug Power's AI Pivot: A Strategic RechargePlug Power is executing a high-stakes pivot from government-backed green hydrogen to the booming AI infrastructure market. We analyze the strategic, industrial, and technological drivers behind this potential turnaround.
A Strategic Pivot Amidst Headwinds
Plug Power (PLUG) has long promised a "green hydrogen revolution," but its stock performance tells a different story—plummeting 99% since its 1999 debut. Facing a cash crunch and a $364 million quarterly loss, management is now steering the company toward a new, voracious customer: Artificial Intelligence data centers .
This move is not merely opportunistic; it is a survival imperative. With the Trump administration recently canceling a vital $1.7 billion Department of Energy (DOE) loan, Plug Power has halted capital-intensive green hydrogen projects. Instead, it is monetizing assets to survive, signaling a shift from government-subsidized dreams to immediate commercial reality.
Geostrategy: Adapting to Policy Shifts
The cancellation of the DOE loan reflects a broader geopolitical shift. The new administration prioritizes immediate energy availability over subsidized decarbonization. By pivoting to the private sector, Plug Power is reducing its exposure to political risk.
This aligns with a "geostrategy of resilience." Data centers are a national critical infrastructure. By offering independent power generation, Plug positions itself as a guarantor of digital sovereignty, insulating tech giants from an increasingly fragile U.S. power grid.
Industry Trends: The AI Energy Crunch
The timing of this pivot addresses a critical market failure. Major analysts project that data center electricity demand will grow 16% in 2025 and double by 2030. AI-optimized servers consume nearly five times the power of standard racks, creating a bottleneck that utility companies cannot resolve quickly.
Plug’s recent letter of intent to sell electricity rights for $275 million confirms this demand. Tech giants are desperate for power *now*. Plug is capitalizing on this by selling its grid interconnection queue spots—effectively selling "time" to power-starved hyperscalers.
Innovation & Tech: PEM Fuel Cells vs. Diesel
Technologically, Plug holds a distinct advantage. Traditional data centers rely on diesel generators for backup, which are dirty, noisy, and maintenance-heavy. Plug’s **Proton Exchange Membrane (PEM) fuel cells** offer a superior alternative:
Instant Response: PEM cells ramp up power in seconds, matching the uptime requirements of mission-critical AI workloads.
Zero Emissions: This allows data centers to operate in urban zones with strict air quality mandates.
Energy Density: Hydrogen offers higher energy density than batteries, essential for facilities with limited real estate.
Business Models: Asset Monetization & Liquidity
Management is restructuring the business model from "build-and-own" to "asset-light." The $275 million liquidity injection from selling electricity rights provides a crucial runway. Rather than burning cash to build massive hydrogen plants, Plug is leveraging its existing technology stack—GenSure and ProGen systems—to generate immediate revenue.
This shift improves the cash conversion cycle. Selling backup power hardware to well-capitalized tech firms offers faster payment terms and lower capital risk than long-term utility projects.
Management & Leadership: A Decisive Course Correction
CEO Andy Marsh’s decision to suspend DOE-related activities demonstrates decisive leadership. A rigid adherence to the original "green hydrogen" roadmap would have been fatal without federal backing. By pivoting to the "AI trade," leadership is aligning the company with the only sector currently enjoying unlimited capital expenditure: Big Tech.
Conclusion: A Speculative Renaissance?
Plug Power remains a high-risk investment, but the investment thesis has fundamentally improved. The company is trading a dependency on government policy for a dependency on AI infrastructure growth—a far more robust driver. If Plug can successfully deploy its fuel cells as the standard for data center backup, it will transition from a speculative energy play to an essential component of the AI economy.
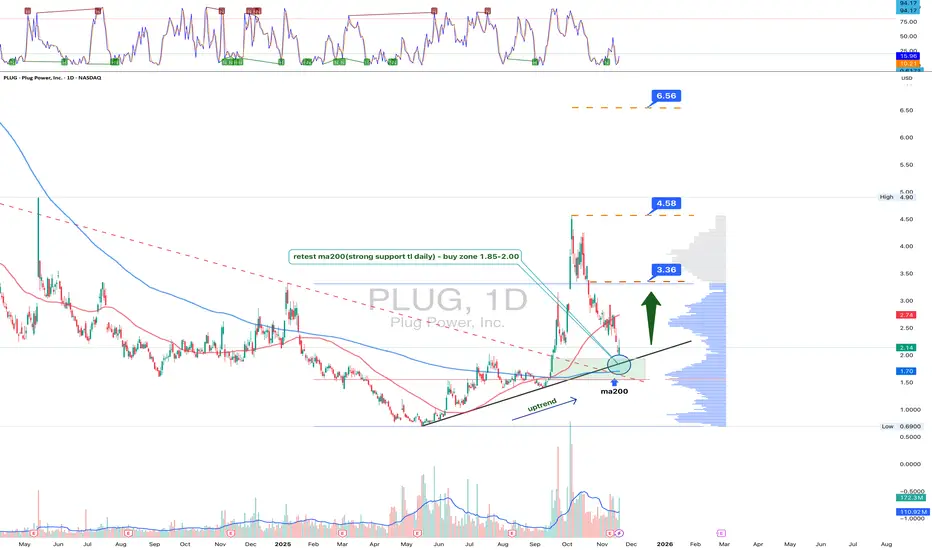
PLUG: recharged on the retest, or another fork with no voltage?PLUG tapped perfectly into the 1.85–2.00 zone - a clean confluence of the MA200, the ascending daily trendline, and the main support that launched the summer rally. Oscillators dipped into oversold, candles show buyer tails, and volume confirms defense of the level. As long as price holds above the trendline, the bullish scenario stands: breaking above 2.70 opens 3.36, and a move above 3.36 targets 4.58. The extended target at 6.56 requires a full breakout from the broader accumulation range.
Company: Plug Power is one of the key players in hydrogen fuel-cell technology, producing electrochemical systems, electrolyzers, and industrial energy solutions for logistics, manufacturing, and infrastructure.
Fundamentally , as of November 19, Plug remains pressured but gradually stabilizing. OPEX continues to decline, manufacturing efficiency improves, and the company expands partnerships in the green hydrogen ecosystem. Revenue volatility persists, but contraction slows, while new electrolyzer deployments build the future pipeline. Scaling production decreases unit costs, and margin improvements suggest the company is climbing out of the worst phase. Policy support and industrial demand keep hydrogen a long-term thematic growth story - though near-term risks remain.
Technically , the bullish structure holds above 1.85–2.00. A breakout above 2.70 activates 3.36, and strength above 3.36 brings the 4.58 target into play. Losing the MA200 risks a prolonged range, but current reaction shows buyers stepping in with precision.
Plug pretends it's collapsing, but really - it’s just plugging itself in for the next run.
Plug Power Rose 560%, Then Pulled Back. What Its Chart Says NowPlug Power NASDAQ:PLUG soared more than 560% between May and October, then the hydrogen-fuel-cell firm gave back some 45% of those gains over the past month. What does PLUG's chart and fundamental analysis say ahead of next week's Q3 earnings report?
Let's see:
Plug Power's Fundamental Analysis
PLUG, which provides commercially viable hydrogen and hydrogen fuel cells for "green" power generation, plans to release Q3 results after the bell on Monday (Nov. 10).
The Street is looking for the company to report a $0.13 per share GAAP loss on roughly $176 million in revenue. That would represent an improvement from the $0.24 GAAP loss per share on $173.7 million of revenue that Plug Power reported in the same period last year.
However, analysts' consensus revenue estimate has dropped from the $185 million they were forecasting when I wrote about PLUG about a month ago.
All in, seven of the 19 sell-side analysts that I know of who cover the stock have lowered their earnings estimates since the quarter began, while seven have raised their numbers lower. (Five have left their estimates unchanged.)
That said, Craig-Hellum analyst Eric Stine (who's rated at five stars out of a possible five by TipRanks) reiterated his "Buy" rating on PLUG just last week. (Stine doesn't have a target price for the stock.)
However, a short squeeze that I wrote last month could develop for the stock hasn't materialized so far. At last check, about 28% of PLUG's float was being held in short positions, down just slightly from the 31% that I saw a month ago.
Plug Power's Technical Analysis
Now let's look at PLUG's chart going back some six months and running through Tuesday afternoon:
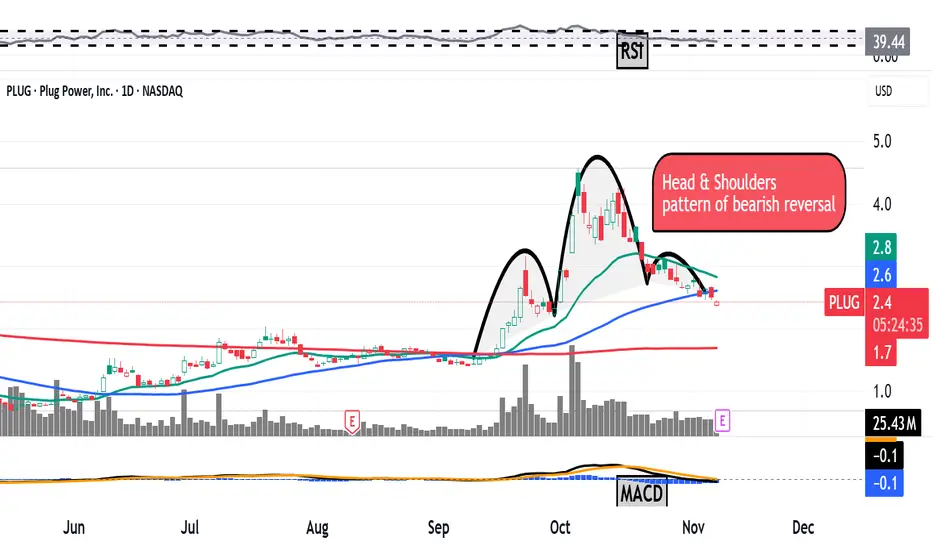
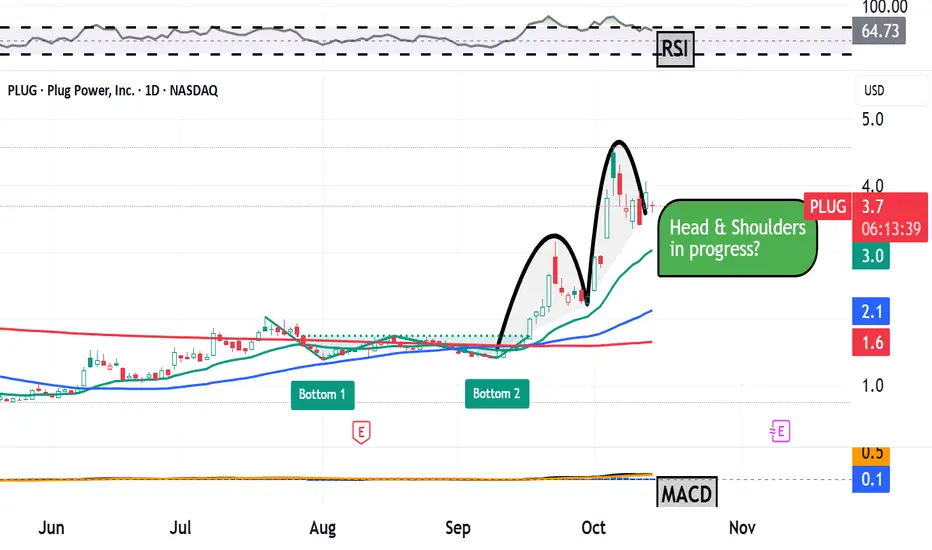
I noted the last time I wrote about PLUG that the stock seemed to be forming a head-and-shoulders pattern of bearish reversal, and the chart above shows that this has only developed further in recent weeks.
PLUG gave up more than 25% of its value in the interim, so the pattern proved to be predictive.
Readers will see that the stock rallied out of a double-bottom pattern of bullish reversal in September before moving into what now appears to be a nearly completed head-and-shoulders formation of bearish reversal. Marked with three black "humps" at the chart's right, this pattern has a $2.70 pivot.
As PLUG breaks below that pivot (shares closed at $2.64 Wednesday), the stock will immediately face a test at its 50-day Simple Moving Average, or "SMA."
Denoted by a blue line, the SMA stood at $2.60 in the chart above. Should Plug Power fail to hold that line, the stock might lose the last of any institutional investors who still own the name.
Meanwhile, Plug Power's Relative Strength Index (or "RSI," the gray line at the chart's top) is running below neutral, although it's nowhere near technically oversold.
Similarly, the stock's daily Moving Average Convergence Divergence indicator (or "MACD," marked with black and gold lines and blue bars at the chart's bottom), looks to have lost its bullish luster as well.
The histogram of the 9-day Exponential Moving Average (or "EMA," marked with blue bars) has been running below the zero-bound since mid-October. That's a short-term bearish signal.
In the same vein, the stock's 12-day EMA (the black line) is at less than zero and running below the 26-day EMA (the gold line). Although the 26-day EMA is still lingering in positive territory, these are all less-than-bullish signals overall.
An Options Option
Some options traders might employ what's known as a "long straddle" as a generally inexpensive way to play any in PLUG coming out of next week's earnings.
That's a directionless trade where an investor who thinks a stock might move sharply by an option's expiration gets long the same number of puts and calls with the same expiration dates and strike prices.
Here's an example:
-- Buy one $2.50 PLUG call with a Nov. 14 expiration (i.e., after next week's earnings report). This will cost about $0.29 at recent prices.
-- Purchase one Nov. 14 $2.50 put for about $0.19.
Net Debit: $0.48.
The trader in the above straddle is risking the $0.48 net debit, although it's unlikely that both of these options will be worthless at expiration.
If PLUG is trading either above $2.98 or below $2.02 at expiration, the investor should at least break even on this trade.
And the further above $2.98 or below $2.02 that the stock goes by expiration, the more profit potential.
(Moomoo Technologies Inc. Markets Commentator Stephen "Sarge" Guilfoyle had no position in PLUG at the time of writing this column.)
This article discusses technical analysis, other approaches, including fundamental analysis, may offer very different views. The examples provided are for illustrative purposes only and are not intended to be reflective of the results you can expect to achieve. Specific security charts used are for illustrative purposes only and are not a recommendation, offer to sell, or a solicitation of an offer to buy any security. Past investment performance does not indicate or guarantee future success. Returns will vary, and all investments carry risks, including loss of principal. This content is also not a research report and is not intended to serve as the basis for any investment decision. The information contained in this article does not purport to be a complete description of the securities, markets, or developments referred to in this material. Moomoo and its affiliates make no representation or warranty as to the article's adequacy, completeness, accuracy or timeliness for any particular purpose of the above content. Furthermore, there is no guarantee that any statements, estimates, price targets, opinions or forecasts provided herein will prove to be correct.
Options trading is risky and not appropriate for everyone. Read the Options Disclosure Document (j.moomoo.com j.moomoo.com ) before trading. Options are complex and you may quickly lose the entire investment. Supporting docs for any claims will be furnished upon request.
Options trading subject to eligibility requirements. Strategies available will depend on options level approved.
Maximum potential loss and profit for options are calculated based on the single leg or an entire multi-leg trade remaining intact until expiration with no option contracts being exercised or assigned. These figures do not account for a portion of a multi-leg strategy being changed or removed or the trader assuming a short or long position in the underlying stock at or before expiration. Therefore, it is possible to lose more than the theoretical max loss of a strategy.
The Analyst Ratings feature comes from TipRanks, an independent third party. The accuracy, completeness, or reliability cannot be guaranteed and should not be relied upon as a primary basis for any investment decision. The target prices are intended for informational purposes only, not recommendations, and are also not guarantees of future results.
Moomoo is a financial information and trading app offered by Moomoo Technologies Inc. In the U.S., investment products and services on Moomoo are offered by Moomoo Financial Inc., Member FINRA/SIPC.
TradingView is an independent third party not affiliated with Moomoo Financial Inc., Moomoo Technologies Inc., or its affiliates. Moomoo Financial Inc. and its affiliates do not endorse, represent or warrant the completeness and accuracy of the data and information available on the TradingView platform and are not responsible for any services provided by the third-party platform.
PLUG | An Epic Run Is Incoming | LONGPlug Power, Inc. provides alternative energy technology, which focuses on the design, development, commercialization, and manufacture of hydrogen and fuel cell systems used primarily for the material handling and stationary power markets. Its fuel cell system solution is designed to replace lead-acid batteries in electric material handling vehicles and industrial trucks for some distribution and manufacturing businesses. The company was founded by George C. McNamee and Larry G. Garberding on June 27, 1997, and is headquartered in Slingerlands, NY.
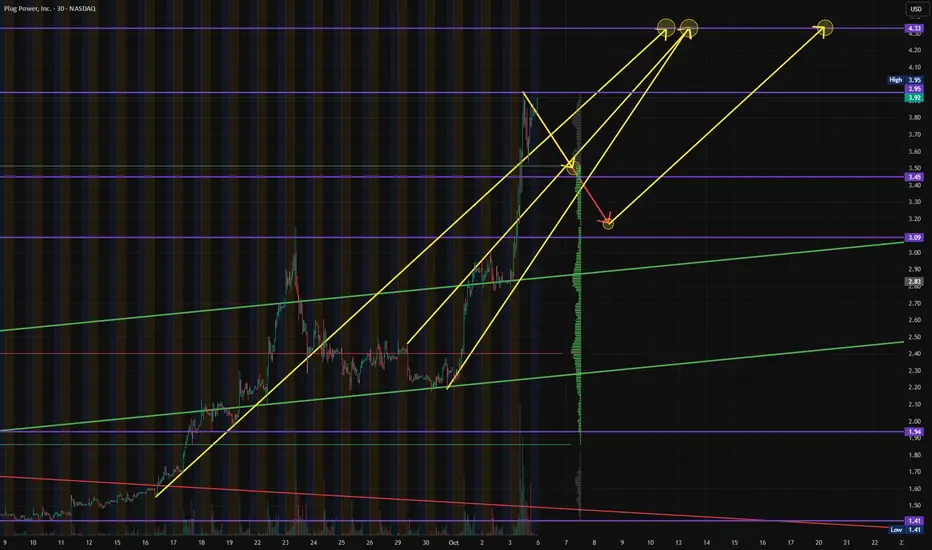
$PLUG - Plug Power - $4.33 RetestNASDAQ:PLUG is currently tracking along one of our potential breakouts to recheck the $4.33 Level of Resistance, but we need to break and hold above that $3.95 Level first. If not, consolidation.
Plug Power Rose 225% in a Month, Then Fell 25%. What's Next?Hydrogen-fuel firm Plug Power NASDAQ:PLUG rallied 225% from its Sept. 10 low to its Oct. 6 high, then fell some 25% over less than three sessions before climbing back some 15% just on Monday. And PLUG is down more than 99% from its all-time high some 26 years ago. One thing's for sure -- it's not a boring stock.
What does PLUG's technical and fundamental analysis say might happen next? Let's see:
Plug Power's Fundamental Analysis
PLUG, which sells eco-friendly "green" hydrogen fuel and related systems, has seen multiple catalysts in just the past week alone.
For instance, the firm announced on Oct. 1 that it delivered the company's first 10 MW GenEco electrolyzer array to the Galp Sines Refinery in Portugal -- Europe's largest proton-exchange-membrane hydrogen-electrolyzer project.
Two days later, HC Wainwright analyst Amit Dayal (rated at four stars out of a possible five by TipRanks) reiterated his "Buy" rating on PLUG while increasing the stock's price target to $7 from a previous $3. (The stock closed at $3.90 on Monday.)
And on Oct. 7, PLUG announced that its board appointed Jose Luis Crespo as new CEO, taking over for current chief Andy Marsh (who's staying on as executive chair). Crespo previously served as PLUG's chief revenue officer.
Then on Oct. 8, the firm announced a warrant-inducement agreement with a single institutional investor for the immediate exercise of the entirety of the company's outstanding warrants issued in March 2025 to purchase 185.43 million shares of common stock. The exercise price was $2 a share, which will raise more than $370 million for PLUG.
In exchange, the investor received 31 million shares of PLUG stock and pre-funded warrants to purchase up to 154.4 million shares more at $7.75 apiece. (The investor can settle up beginning in March 2026.)
All of this happened about a month before Wall Street expects PLUG to release fiscal Q3 financial results.
The Street is looking for a $0.13 GAAP loss per share on roughly $185.4 million of revenue. That would represent about a 45% improvement from the $0.24 loss per share the PLUG saw in the year ago period, as well as about a 7% gain from the $173.3 million the firm recorded in year-ago sales.
Of the 18 sell-side analysts that I know of that cover PLUG, eight have revised their earnings estimates higher since current quarter began, while seven have cut their numbers. (Three analysts have left their estimates unchanged.)
Plug Power's Technical Analysis
Next, let's look at PLUG's chart going back some five months and running through Thursday afternoon:
Readers will see that PLUG blasted out of a double-bottom pattern of bullish reversal in September, marked by two curving black lines at the chart's right.
However, the above rally and subsequent sell-off looks to me more like an incomplete head-and-shoulders pattern that's maybe about two-thirds of the way into its development. That would be a bearish set-up.
Then again, there's a reason that many traders wait to see patterns complete their development. Sometimes, patterns simply don't end up developing.
Oh, and did I mention that short-sellers make up some 31% of PLUG's entire float?
As for PLUG's secondary technical indicators, the stock's Relative Strength Index (or "RSI," the gray line at the chart's top) is running at elevated levels, but off of its recent highs.
Meanwhile, Plug Power's daily Moving Average Convergence Divergence indicator (or "MACD," marked with black and gold lines and blue bars at the chart's bottom) looks very bullish.
For instance, the histogram of the stock's 9-day Exponential Moving Average (or "EMA," denoted by blue bars) is running above the zero-bound and has been since mid-September.
The same goes for the 12-day EMA (black line) and 26-day EMA (gold line), with the black line running above the gold line. That's a short- to medium-term bullish signal.
An Options Option
Aggressive options traders who want to go long PLUG heading into earnings (or who see the potential for a short squeeze) might purchase the stock while selling naked puts to potentially lower their cost basis in this scenario. Here's an example:
-- Buy 100 shares of PLUG at or close to $3.90 a share.
-- Sell one Nov. 14 $3.50 put for about $0.45. This put will likely expire after PLUG's Q3 earnings report.
-- Sell one Nov. 14 $3 put for about $0.25.
Net Basis: $3.20
This options spread means the investor will have essentially bought PLUG for about an 18% discount from market prices, thanks to the put premiums received (assuming shares go higher, or at least don't go below $3.50 by expiration).
However, the sale of naked puts does expose the investor to significant risk, as the stock could theoretically fall to zero.
Should the shares go lower than $3.50 before the puts expire, the investor could wind up long 200 PLUG shares of at a $3.35 net basis at a time when the shares are trading below $3.50.
And if PLUG falls below $3 before the puts run out, the trader could end up long 300 shares at a $3.23 net basis when PLUG is trading below $3.
(Moomoo Technologies Inc. Markets Commentator Stephen "Sarge" Guilfoyle had no position in PLUG at the time of writing this column.)
This article discusses technical analysis, other approaches, including fundamental analysis, may offer very different views. The examples provided are for illustrative purposes only and are not intended to be reflective of the results you can expect to achieve. Specific security charts used are for illustrative purposes only and are not a recommendation, offer to sell, or a solicitation of an offer to buy any security. Past investment performance does not indicate or guarantee future success. Returns will vary, and all investments carry risks, including loss of principal. This content is also not a research report and is not intended to serve as the basis for any investment decision. The information contained in this article does not purport to be a complete description of the securities, markets, or developments referred to in this material. Moomoo and its affiliates make no representation or warranty as to the article's adequacy, completeness, accuracy or timeliness for any particular purpose of the above content. Furthermore, there is no guarantee that any statements, estimates, price targets, opinions or forecasts provided herein will prove to be correct.
Options trading is risky and not appropriate for everyone. Read the Options Disclosure Document ( j.moomoo.com ) before trading. Options are complex and you may quickly lose the entire investment. Supporting docs for any claims will be furnished upon request.
Options trading subject to eligibility requirements. Strategies available will depend on options level approved.
The Analyst Ratings feature comes from TipRanks, an independent third party. The accuracy, completeness, or reliability cannot be guaranteed and should not be relied upon as a primary basis for any investment decision. The target prices are intended for informational purposes only, not recommendations, and are also not guarantees of future results.
Moomoo is a financial information and trading app offered by Moomoo Technologies Inc. In the U.S., investment products and services on Moomoo are offered by Moomoo Financial Inc., Member FINRA/SIPC.
TradingView is an independent third party not affiliated with Moomoo Financial Inc., Moomoo Technologies Inc., or its affiliates. Moomoo Financial Inc. and its affiliates do not endorse, represent or warrant the completeness and accuracy of the data and information available on the TradingView platform and are not responsible for any services provided by the third-party platform.
$PLUG - Plug Power - $4.33 PTNASDAQ:PLUG consolidated to chart the $3.09 and found support like we initially targeted and rebounded to $3.95 before showing potential consolidation for additional entries.
Still holding a $4.31 RT to breakout to that $5.09 PT will potentially providing re-entry at $3.45 if it does consolidate again first.
13, here we comeLooks bullish and can hit 13. It may have massive pullbacks before it hits 13. Play safe and diversify.
Not a financial advise.

Plug - Hear me outProposing a trade on a shit-co like plug may earn some laughs but hear me out for a second.
In the right light and with enough alcohol, she could pass for a strong six. I'd do her.
Jokes, aside, due to the frantic rush to solve AI datacenter energy problem, power companies have been getting a lot of play lately, some have real growth potential, while others may be the speculative dream of degenerates like myself.
A 25 year old company, about to hit the figurative wall (DiCapiro joke...slaps knee), has suddenly seen an influx of buying activity and what looks to be increasing volume following a look below and fail of a weekly box.
According to box rules, I can't ignore this trade. Plug has been in an area of consolidation for years. It's completed atleast two look above and look below and fails of the larger boxed range.
I'm not saying that this stock is going to the moon, but if It can reclaim the top of the mini weekly box and hold the midpoint of the larger box then $8 seems like a realistic target to me.
Now, this stock would easily revert back to the volume point of control (VPOC) around $2 or lbaf again or simply fail miserably below the boxes...then all you degens will be living in boxes.
If we do see 2.50 - $2 again, I'd love to take an entry there (a lbaf of vpoc would be nice too). Otherwise, I'll be monitor this name for the mentioned trades.
My posts are for shits and giggles. I'm just a guy with an interest and a celcius addiction.
~The Villain

A+ Momentum Setup | Plug Power (PLUG) BreakoutA clean A+ momentum setup on Plug Power (PLUG) — a perfect example of how price structure, volume, and momentum align before a big move.
🔍 Discovered using my volume scan.
🔹 Structure: Higher low → reclaim of key moving averages → breakout through resistance
🔹 Volume: Big demand on the move up, light volume on the pullback
🔹 Momentum: 6.5R move (72% gain on partials) — strong follow-through as trend expanded, offering a great risk/reward opportunity
This is what I look for every week — clear structure, expanding volume, and strength confirming participation.
My goal isn’t to predict; it’s to react with discipline when everything lines up.
No hype. No gimmicks. Just price action, volume, and process.

$PLUG - Plug Power, Inc - $4.33 Short-Term PT/UpdateNASDAQ:PLUG hit our previous $3.45 PT and broke out to $3.95 Level of Resistance. If we can't find the volume to keep pushing through those $3.95's, then we'll be looking for the following Re-Entries: $3.20 - $3.45
Price Target: $4.33
$PLUG - Plug Power, Inc - $3.45 RT & Breakout?NASDAQ:PLUG looks to have broken out of its longer-term downward channels, showing strong volume, support, and momentum while re-attempting to break the $3.09s and push forward to our $3.49 PT.
This also comes after HC Wainwright maintains a BUY on NASDAQ:PLUG , raising its Price Target to $7. Not to include, the company just delivered its first 10-MegaWatt GenEco Electrolyzer Array to Gilp, a Portuguese Energy Company.
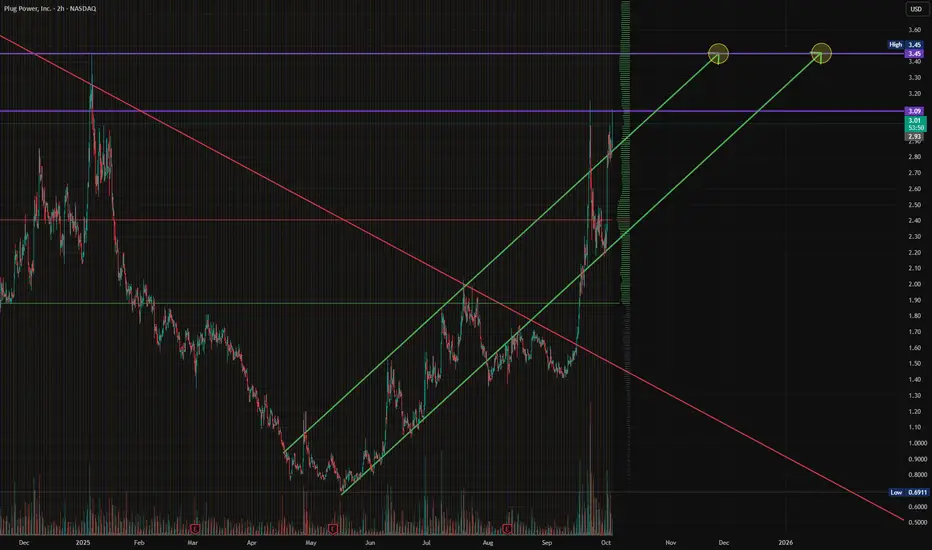
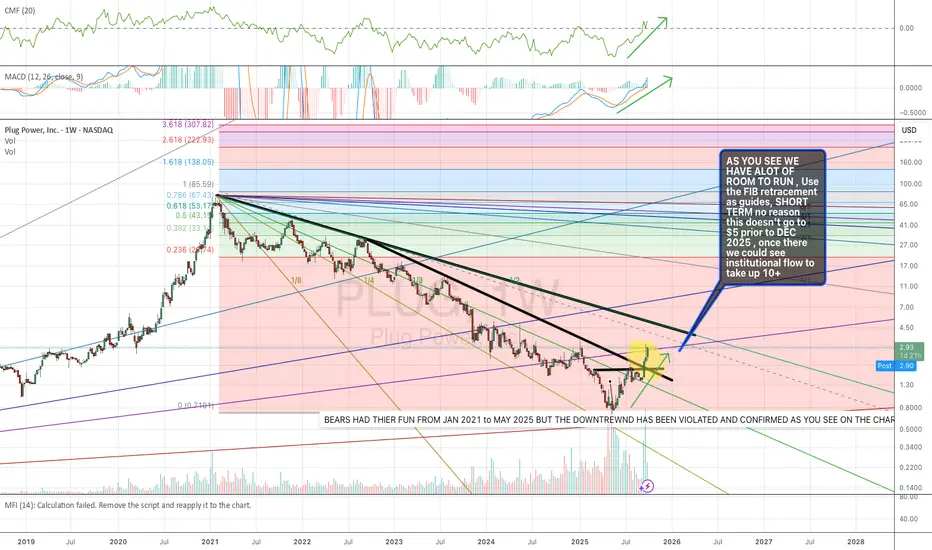
$PLUG short turn run to $5 the $10+ prior to DEC 2025 Detail is in the chart for my TA guys enjoy! NASDAQ:PLUG
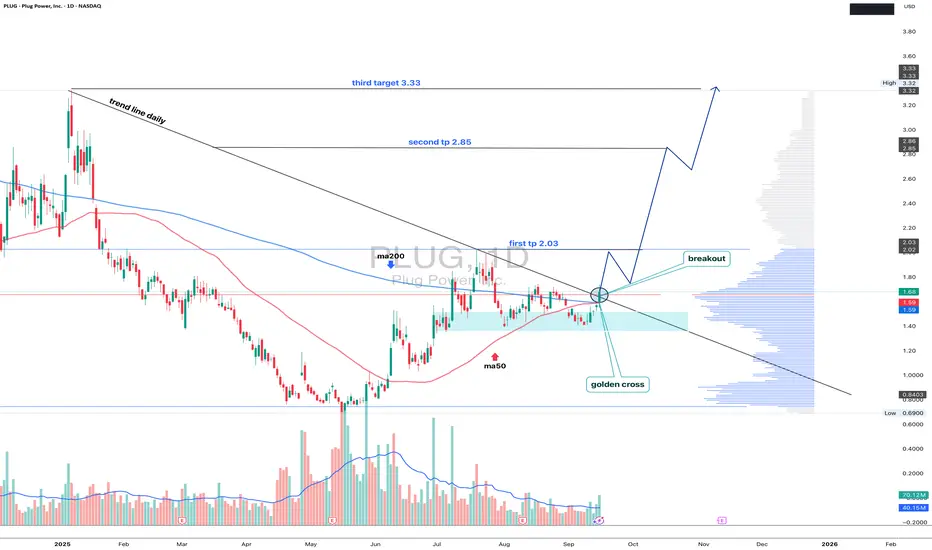
PLUG 1D - powered by a golden crossThe current PLUG chart highlights a key technical shift: the golden cross (MA50 crossing above MA200), usually seen as a potential mid-term reversal signal. Price has broken out of its downtrend structure and is retesting the breakout zone around 1.60–1.68, forming a possible accumulation base. Targets are defined step by step: first at 2.03 (major resistance and Fibo 1), second at 2.85 (Fibo 1.618), and third at 3.33 where strong volume and supply zone meet.
Fundamentally , Plug Power remains a high-risk play: heavy debt, negative cash flows, yet renewed investor attention thanks to green energy incentives.
The tactical view is clear: if the stock holds above 1.68, the road opens toward 2.03, and further breakout may accelerate momentum. A drop back below MA50, however, would invalidate the bullish case.
In short, the market is now deciding whether PLUG becomes a green-energy comeback star or just another unplugged socket.