QBTS - Where are we?Hello Everyone and Followers,
Because of the my External Post URL, moderator is removed my previous Post. Therefore i am sharing it again without external Link.
Happy Sunday to all.
QBTS is the second one for today.
My previous analysis was almost 4 months ago and you can access it below :
That times price was 15.17 and QBTS Hit to 46.50 which is over %300 within 4 Months. Unbelievable Profit.
Where are we now?
We are still in Up trend and as long as this trend is not broken i am expecting to close this year 59-60 which is again %50 over today's price. Of course we need to watch closely news flows as well.
Our support level is in between 32 - 32.50 and if it will hit that point then I will definatelly increase my positions.
My expected pattern i have drawn as Yellow.
If it breaks the 44.50 and stay above this level then next stop is 59-60 which i am expecting to be happen till end of the year.
Worst case scenario you can see as RED.
It can hit to 29.50 - 29.00 area then find a support from this level and go Up and get in the trend channel. If it decide to hit this area then this levels are the another perfect levels to buy or increase positions. Also maybe there will be some delay to reach 59-60 , maybe within next 3 months of 2026.
My expectation is Yellow Pattern.
As i mentioned the IONQ post , i am investing for future and not interesting the fluctuations.
This is just my thinking and it is not invesment suggestion , please do not make any decision with my anaylsis.
Have a lovelly Sunday to all and Good Start a Week.
Trade ideas

QBTS up and awaySimple charts without PT, $55-79.
All indicators provided plus future outcome makes in unbeatable.

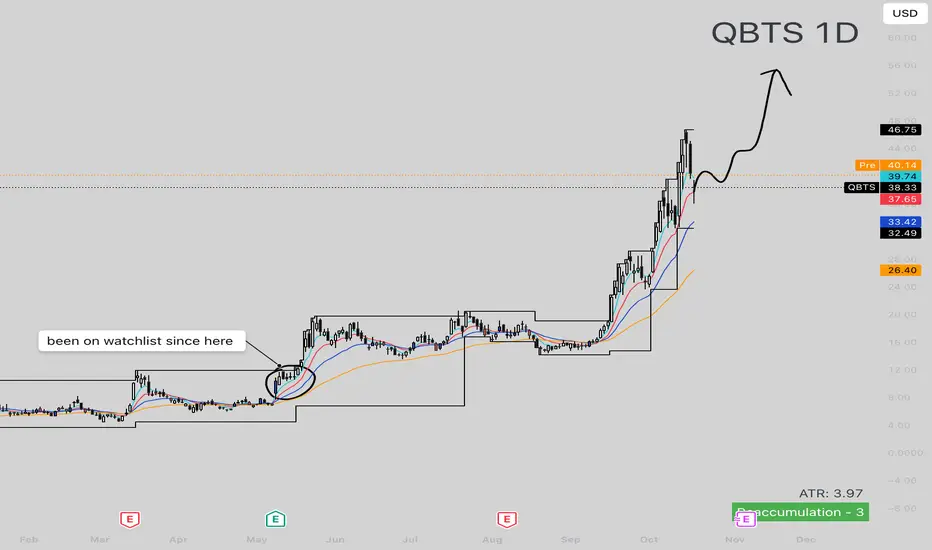
QBTS – Relentless Strength From $10, Still DeliveringQBTS 1D
I’ve had this on watch since the breakout around $10 — and it continues to be one of the cleanest trending stocks in the market.
Quantum computing as a whole has started to catch attention recently — the entire sector (QBTS, IONQ, RGTI etc.) is heating up. But honestly, I’m not here for the hype, I’m here because the price action has been flawless.
Why I like it:
Respecting the 5 / 10 / 20 EMAs on every pullback
Each consolidation → clean expansion, no distribution yet
Strongest relative performer in its sector
Only invalidation would come from a breakdown in structure or if NQ stops delivering
As long as Nasdaq (NQ) holds its trend, I don’t see a reason this slows down. Sector strength is a bonus — but the chart is the only confirmation I need.
Riding this trend or waiting for a pullback?
Do you follow sector hype or just the chart?
what sectors are on your watchlist?
Can Quantum Annealing Reshape Global Power?D-Wave Quantum Inc. has emerged as a distinctive player in commercial quantum computing by focusing on immediate utility through quantum annealing rather than waiting for fault-tolerant gate systems. The company's Advantage2™ system, featuring over 4,400 qubits, delivers production-grade solutions for complex optimization problems today, generating measurable ROI for clients like Ford Otosan, which reduced vehicle production scheduling from 30 minutes to under five minutes. This hybrid strategy of monetizing mature annealing technology while developing gate-model capabilities positions D-Wave to capture revenue now while hedging technological risk for the future. The quantum computing market's projected growth to $20.20 billion by 2030 (41.8% CAGR) and JPMorgan Chase's $1.5 trillion initiative, which explicitly includes quantum as a critical security technology, validate this sector beyond speculative investment.
D-Wave's recent scientific milestone, demonstrating "beyond-classical computation" on a magnetic materials simulation published in Science, marks a pivotal moment. The Advantage2™ prototype completed in minutes what would have required nearly one million years on classical supercomputers like Frontier, representing the first quantum supremacy claim on a commercially relevant, real-world problem. While classical researchers dispute aspects of the claim, the peer-reviewed validation drives enterprise confidence and accelerates bookings across manufacturing, pharmaceuticals, and energy sectors. Japan Tobacco's proof-of-concept using D-Wave's quantum-AI workflow generated drug candidates with superior properties compared to classical methods, addressing the pharmaceutical industry's 90%+ failure rate crisis.
Geopolitically, D-Wave has strategically embedded itself in European digital sovereignty initiatives, co-founding Italy's Q-Alliance to establish what aims to be the world's most powerful quantum hub. This dual-vendor partnership with IonQ provides Italy and the EU immediate access to D-Wave's production-ready annealing technology while hedging against future gate-model capabilities. Additional strategic deployments include Swiss Quantum Technology's €10 million investment and extended partnerships with Aramco Europe. The company's concentrated portfolio of 208 patent families in superconducting annealing creates defensible IP barriers, though significant risks remain: wider-than-expected losses despite 40% revenue growth, the Advantage2™ system's high cost barrier to adoption, and critical dependence on rare helium-3 supplies subject to geopolitical volatility.

QBTS - Big Move Coming For This Wild Quantum StockQBTS having a really great pop today up 20% ❗️
This lower wicked whipsaw and momentum pop is a very bullish look.
So this one can be heading up and up.
Right here it is hitting resistance so we may see a pull back at some point, but a scattered buy here and on a pull back if it comes may work well.
This looks very strong.
Very dangerous though 👍.
This analysis is shared for educational purposes only and does not constitute financial advice. Please conduct your own research before making any trading decisions.

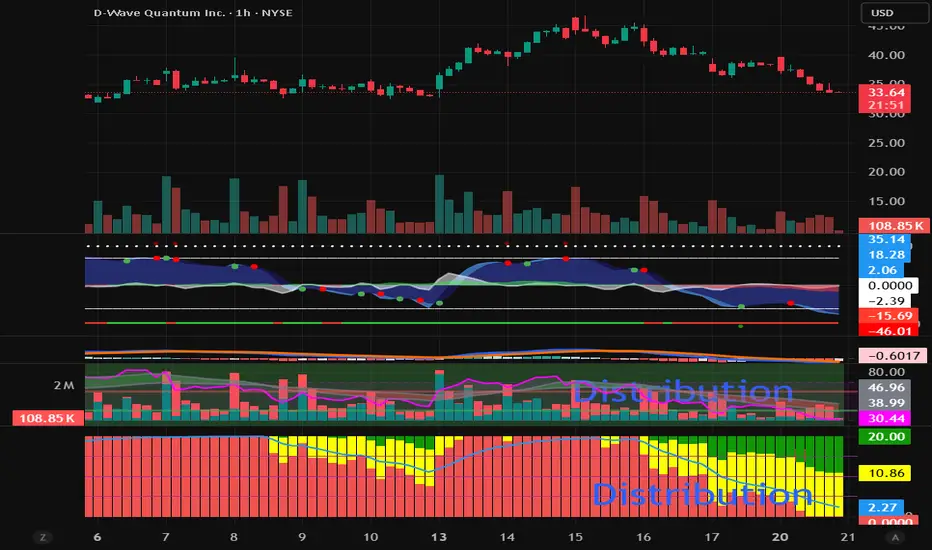
Heavy distribution in QBTSVia buy/sell and smart money indicators, heavy distribution seen today across the quantum space, particularly in NYSE:QBTS , NYSE:IONQ , and NASDAQ:RGTI , which are deeply overvalued, even beyond the worst dot com valuations. Weekly sell signal also observed. Institutional investors are beginning to exit via euphoric retail liquidity. Signs of weakening have been occurring since last week, and it appears the correction is accelerating.
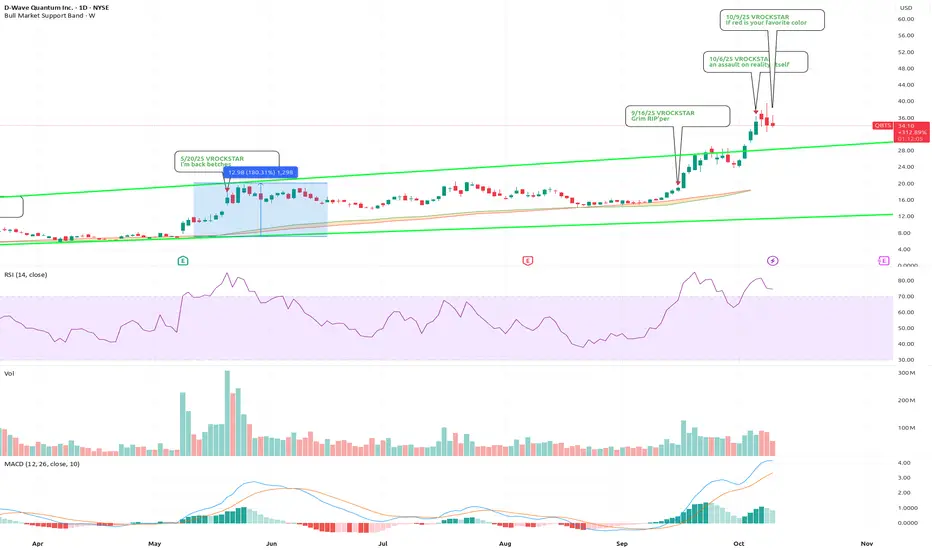
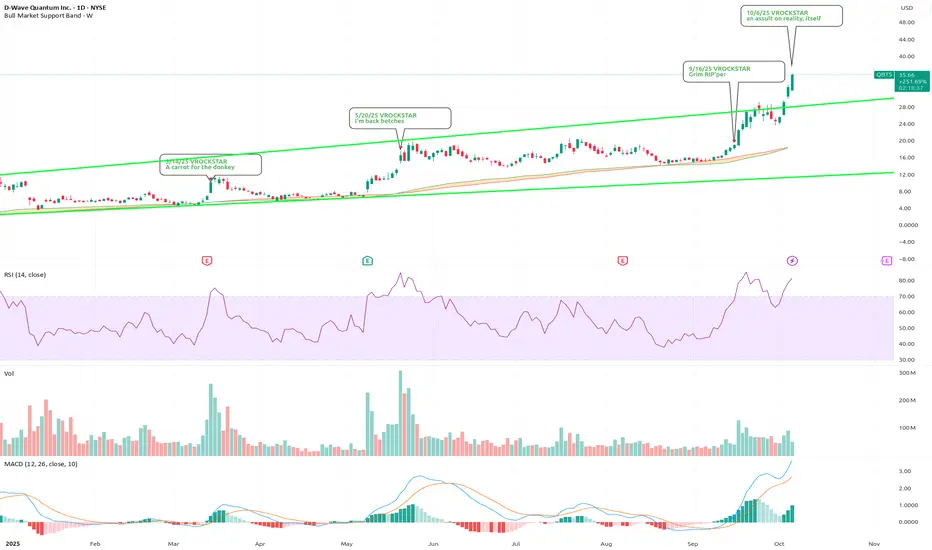
10/9/25 - $qbts - If red is your favorite color10/9/25 :: VROCKSTAR :: NYSE:QBTS
If red is your favorite color
- it's me again. you know. coming to you from reality
- so here's the deal, without sharing too much
- quantum won't be too useful in a conflict with china
- not many zombie companies will be
- best off looking at crash positions, yield positions (2s10s steepener if u r brave), or just holding more cash
- sanity is the scarce asset you need to be storing up
- because the oppty will arise
- when you hear "tis not fair", that's where we move again.
- i'm still 50% cash, a lot of deep ITM leaps on positions w good FCF yields growing HSD/DD, and even these r hard to size up
- con-sumer credit is cracking so hard you-know-who would be all over it like it just turned 18
- and here we are again
- be warned that $34/shr is likely equal to the amt this stock is worth if it had $34/shr of cash on it's balance sheet. i'm surprised they haven't dunked into yo pockets just yet.
- momentum does not equal value. but if you're playing that game... respect. just know i'm still here and happy to take the under.
V
QBTS — RS 99 Leader in a Leading Group | Textbook Bull Flag This chart highlights a classic bull flag continuation setup on D-Wave Quantum (QBTS) — a high Relative Strength (RS 99) name within the Computer–Hardware/Peripheral industry group, one of the top-ranked sectors in the current market.
Even though QBTS’s earnings don’t fully meet traditional CANSLIM criteria, this setup shows why focusing on leading themes, strong groups, and RS leadership can be just as powerful in identifying potential big winners.
Key Leadership Factors:
✅ High RS (99)
✅ Leading Industry Group
✅ Part of the 2025 AI/Quantum Theme
Following a sharp 100%+ move (the flagpole), NYSE:QBTS consolidated in a tight, downward-sloping flag with low-volume pullbacks — a textbook structure signaling healthy digestion of gains.
The breakout came on expanding volume, confirming renewed institutional buying pressure.
Key Technical Traits:
-Strong flagpole with explosive volume
-Pullback of ~19% on lighter volume
-Rising key moving averages
-Breakout on heavy volume
This is a Qullamaggie-style momentum continuation setup — clean, structured, and high risk/reward.

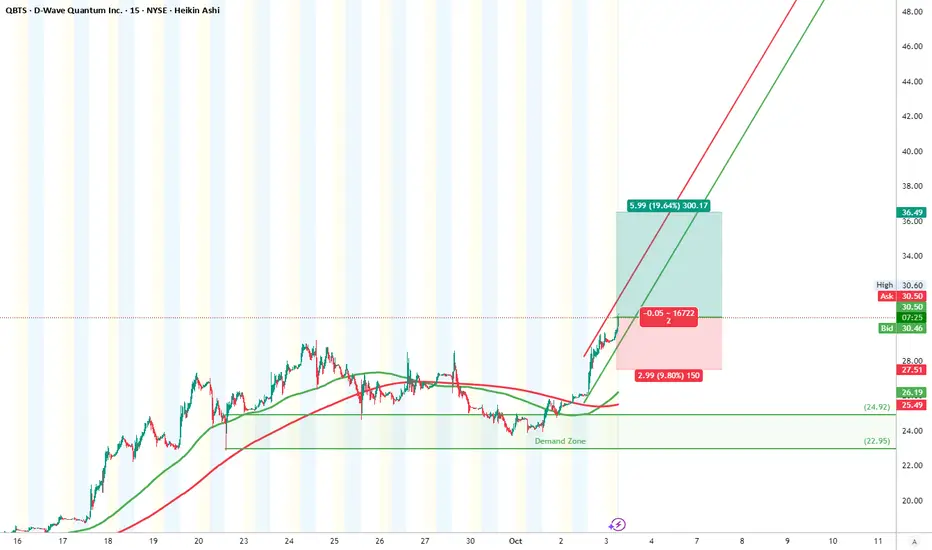
QBTS (D-Wave Quantum Inc.) Long
Asset: QBTS (D-Wave Quantum Inc.)
Timeframe: 10-min Heikin Ashi
Bias: Bullish breakout after demand zone accumulation
Entry Zone: Around 30.36 (current price)
Stop Loss: 27.37
Take Profit: 36.49
RRR (Risk/Reward): ~2.0
Target Gain: +19.64%
Potential Drawdown: -9.80%
🔍 Technical Breakdown
Trend: Clean bullish trend emerging after multi-day consolidation.
Demand Zone: Strong base formed between 24.92–25.67, confirmed by multiple tests and V-shaped recovery.
Breakout Level: Price broke prior range highs near 30, with momentum.
EMA Structure: All EMAs turning up and aligned bullishly.
Price Action: Flag breakout with strong bullish candles; good volume follow-through likely.
💼 Trade Management
Max Risk: 1–3% capital. SL beneath last minor swing and demand zone.
Management Tip: Move SL to breakeven near 33.50+.
Scaling Strategy: Add more at 32.50 retest if breakout consolidates cleanly.
⚡ Extras
Fundamental Note: QBTS is a quantum tech play = high-beta and news-sensitive.
Volatility Alert: Extremely volatile stock. Small size recommended.
“Trends have a higher probability of continuation than reversal.” – Linda Raschke
⚠️ Disclaimer: High-risk asset. Confirm with volume and protect capital with stops.
#QBTS #BreakoutTrade #DemandZone #MomentumPlay #TechStocks #QuantumComputing #RiskReward #SmallCapMoves
10/6/25 - $qbts - an assault on reality, itself10/6/25 :: VROCKSTAR :: NYSE:QBTS
an assault on reality, itself
- what annealing problem can be solved in a practical way today that's worth any real amt of $?
- i suppose the product here is stock go up
- so be it.
- obviously no longer holding a flat PnL w this trash
- but i'm still stepping it up
- wish someone could comment below and explain the product to me
- i don't need someone saying "market can stay mentally regarded longer than you can stay solvent". i know.
- this is an assault on reality itself.
- congrats to the longs. whoever you are. hilarious. i'm so happy for you. and i also feel so sorry for you.
- no revenue
- no useful product
- 12B valuation.
- there's not really any fundamental math here to communicate.
- because it's not a company?
- be safe out there.
- but i'm still fading this.
V
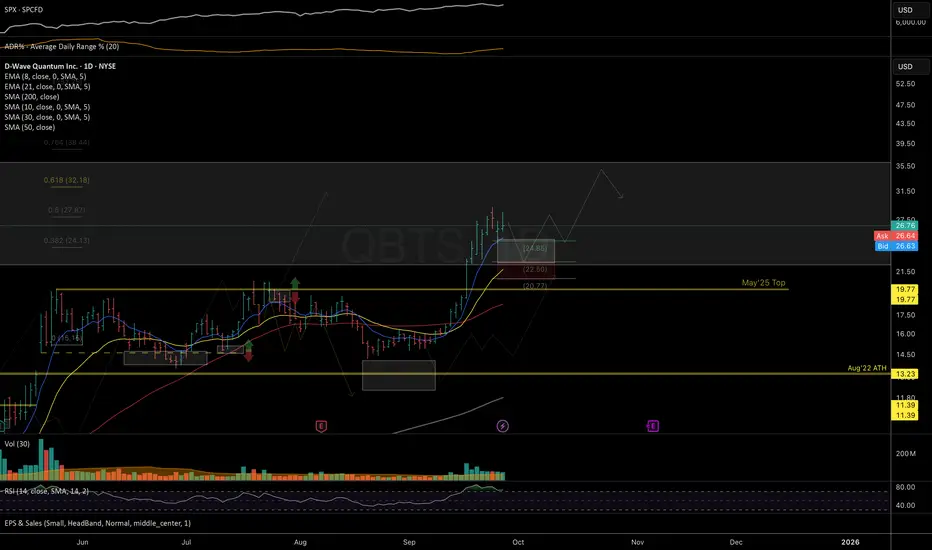
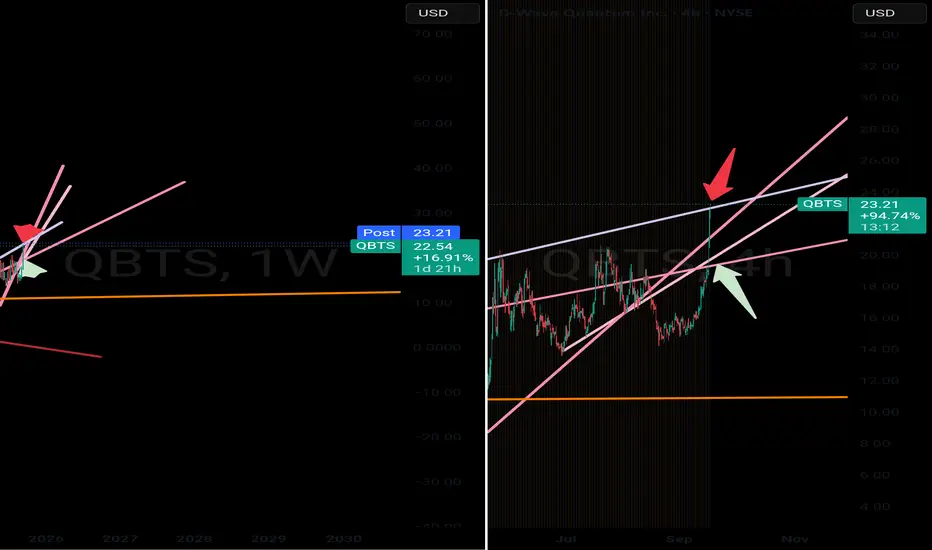
QBTS in the macro resistance
Price managed to post the higher low from the mid-term support mentioned in the Jul update and rallied into the macro resistance target at 23–38, where I am watching for a potential macro top formation and uptrend reversal.
Chart (Daily):
Chart (Weekly):
As long as price holds above local support at 24–22/20, I remain on the lookout for one more push higher into the top of the macro resistance zone.
If price manages to sustain a breakout above 38, the door opens for a blow-off top toward 45 and even 59 macro resistance levels.
Previously:
• On mid-term support (Sep 5):
s3.tradingview.com
www.tradingview.com
• On important resistance (Jul 22):
s3.tradingview.com
tradingview.com
• On upside potential (Jul 10): s3.tradingview.com
tradingview.com
• On macro trend (Jun 30): s3.tradingview.com
tradingview.com
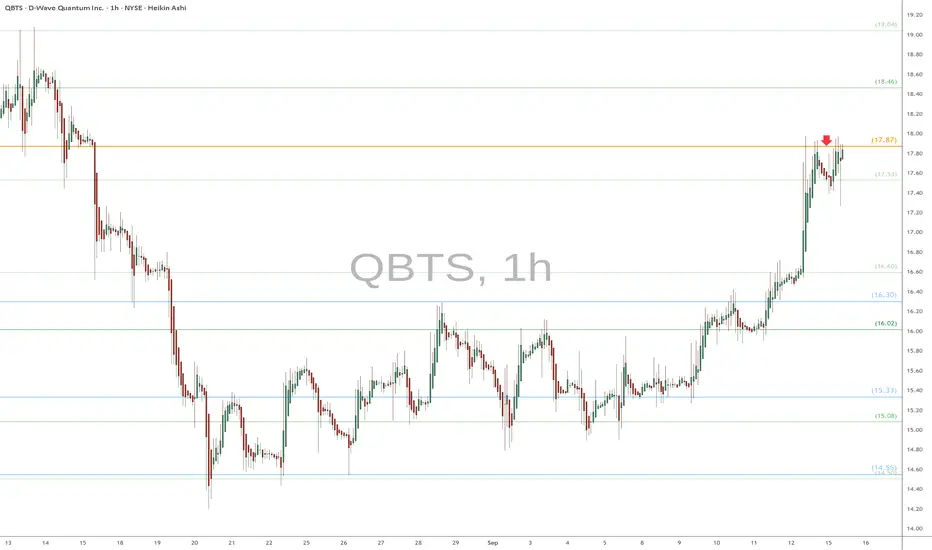
QBTS eyes on $17.87: Golden Genesis holding up move to new ATHQBTS has been recovering from a downtrend
Now testing a Golden Genesis fib at $17.87
Look for a Break-n-Retest to ride to new ATH.
.
Previous Analysis that called this exact TOP:
Hit BOOST and FOLLOW for more such PRECISE and TIMELY charts.
=========================================================
.
QBTS: Climbing the Stairway to SellPrice has surged to $23.18, nearly doubling in recent weeks (+94%).
Chart shows strong rejection zone near $24–25 (red arrow / upper trendline).
Key downside levels: $18.50–19.00.
Bearish drivers
Overextended rally – Stock nearly doubled in a short period, likely fueled by speculative flows rather than fundamentals.
Valuation disconnect – QBTS is still an early-stage quantum computing company with limited commercial revenues; current levels price in aggressive future adoption.
Cash burn risk – Quantum startups like D-Wave face high R&D costs with long timelines to profitability; potential need for dilution/financing remains.
Sector volatility – Quantum and AI-adjacent stocks often trade in hype cycles; any cooling in sentiment can drive sharp pullbacks.
QBTS Daily | Cloud Break, Tenkan-Kijun Confirm, Clear R/RMarket context & signal overview
Price has just closed above the Kumo, signaling a confirmed bullish cloud breakout. That's your primary trend indicator—stronger, cleaner setup with fewer false signals.
Tenkan-sen (Conversion Line) has crossed above the Kijun-sen (Base Line)—that’s your short-to-medium momentum kick.
Chikou Span (Lagging) is well above past prices, reinforcing bullish strength.
Cloud ahead is rising and thickening—this projects solid future support if price retraces.
Timeframe & strategy fit
This is a Daily chart play—suits swing/trend-following strategies and filters noise.
Entry, Stop & Target (Risk Management)
Entry trigger: Clean daily close above the cloud + Tenkan/Kijun confirmation.
Stop-loss: Below the bottom of the Kumo (e.g., near Leading Span B)—protects if support fails.
Target: Measure cloud height or pivot resistance—for example, aiming for ~28-30% upside (adjust sizing accordingly).
Risk/Reward: Current setup offers a 3:1 R/R.
Why this works—and where it can fail
You’re riding clear trend signals, supported by price above cloud, cross bullish, Chikou confirmation, and projected support ahead.
Still, if price slips back into a thin cloud, you get chop—stay quick to cut. Cloud thickness matters.
Adding a complementary tool—like volume spike, market structure, or RSI—tightens your confidence.
Bottom line
QBTS gives you a textbook Ichimoku breakout: trend confirmed, momentum confirmed, structure ahead confirmed. With disciplined risk and clear targets, this trade deserves attention.

D- Best Wave Quantum ^.^^I love D Wave.
It rings the bell of riding 2nd wave under AI hot trend.
Although company is not making profit yet.
Technicals are favoring this stock.
Greenbar bounces back from $16 support
Although there is a downward cross of 60MA and 20MA.
I think market still love D Wave.
It might break previous high as it gains momentum.

9/16/25 - $qbts - Grim RIP'per9/16/25 :: VROCKSTAR :: NYSE:QBTS
Grim RIP'per
- as the weird times are upon us
- and have been
- get yourself a healthy dose of Halloween in Sep with NYSE:QBTS
- trick or treat = F. A. F. O.
- well for $6B, i probably get something nice, right?
- yes $25 million of revenue
- it makes money right?
- nope.
- how about next year?
- nope.
- but how about 2027
- nope.
- 2028?
- maybe
- "well that's good enough DD for me" say the WSB crowd in their tendie town stupor of group think.
- i'm back.
- and shorting all the qwandem stonkies
- may the best player win.
V

Very similar pattern the third timesI feel like my drawings speak for themselves and there is nothing to explain because it's obvious what I think if you examine them. @vanathi commented on my other idea that expressing what we think/feel is the right thing as people don't have mind reading ability. I agree, but I often feel that explanation doesn't really help. Some people get it, some not, even if one tries to explain. A painter expresses his / her feelings and thoughts through his / her paintings. Each person perceives reality differently, interpret paintings, lyrics etc differently. I think when we think we understand something often it's just an illusion. We make up different explanations, connect dots that maybe not real just looks like that. We are just cannot comprehend the whole reality so fill up the missing pieces with creativity and try to convince ourselves that we are right because it feels safe and that is what we want to feel basically.

New Setup : QBTSOn the daily chart, despite the rising highs and lows,there is an interesting bearish crossover that may lead the price to a big correction.

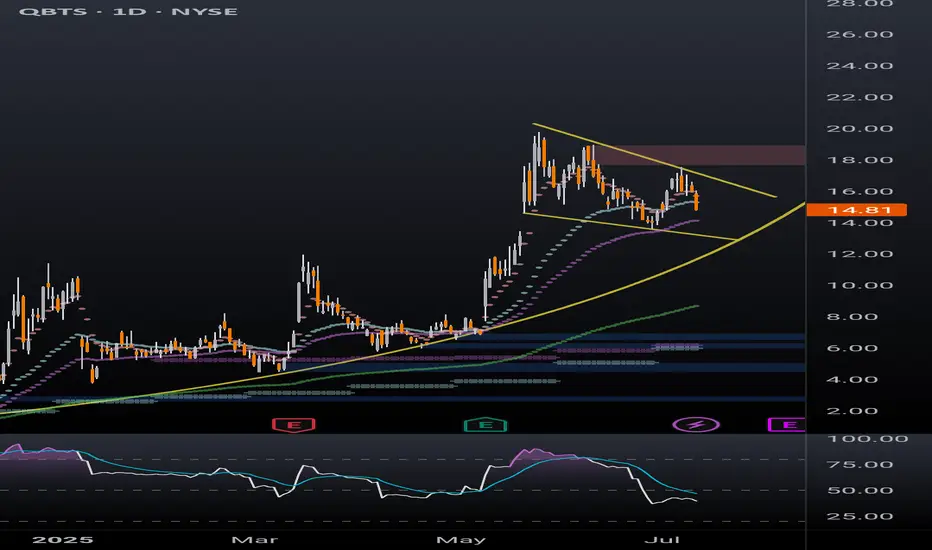
QBTS under $13The current setup is neutral-to-bearish, with downside pressure dominating unless price can decisively move above volume resistance and show momentum indicator strength
Zone Type Trigger
15.63 Bullish Reclaim and hold as support after breakout
16.95–18.05 Bullish Retest and bounce above resistance
15.63 Bearish Fail to reclaim as resistance after breakdown
14.20 Bearish Retest and fail below former support

TradeUSAsignals RecommendationsQBTS - Long (5% of your portfolio) - Order filled @ 18.83
QBTS - shows strong upward momentum with a breakout of an ascending triangle pattern and high trading volume, indicating continued price increase. Along with expected financial performance improvement and clear technical support between $16.5 and $17.5, it presents a strong buying opportunity with potential additional gains in the near term.

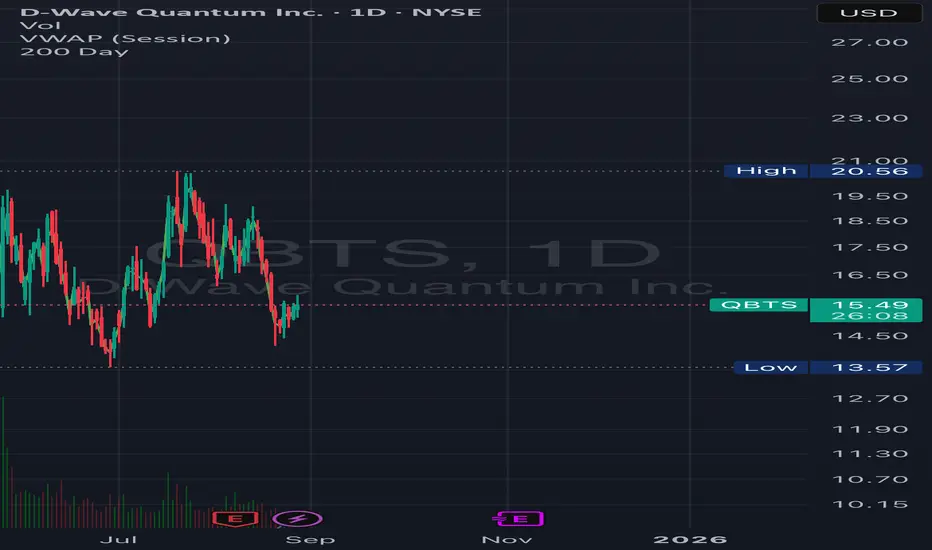
QBTS Pops With Volume – Holding Above All Anchored VWAPsQBTS surged nearly 10% today on above-average volume (50M vs. 46M MA) and is currently trading above all key anchored VWAP levels. Price reclaimed the short-term breakout zone and showed strong buyer interest near the yellow VWAP band.
This continuation move is happening with healthy volume expansion and support from recent consolidation. If price holds above $18.50, a test of the $22–24 resistance zone seems likely.
Indicators used:
Anchored VWAP from prior pivot lows and breakout zones (support)
Volume spike confirmation
Volume MA (context of demand strength)
Entry idea: On dip to $18.50 or reclaim of $19.50
Target: $22–24
Stop: Below $17.80
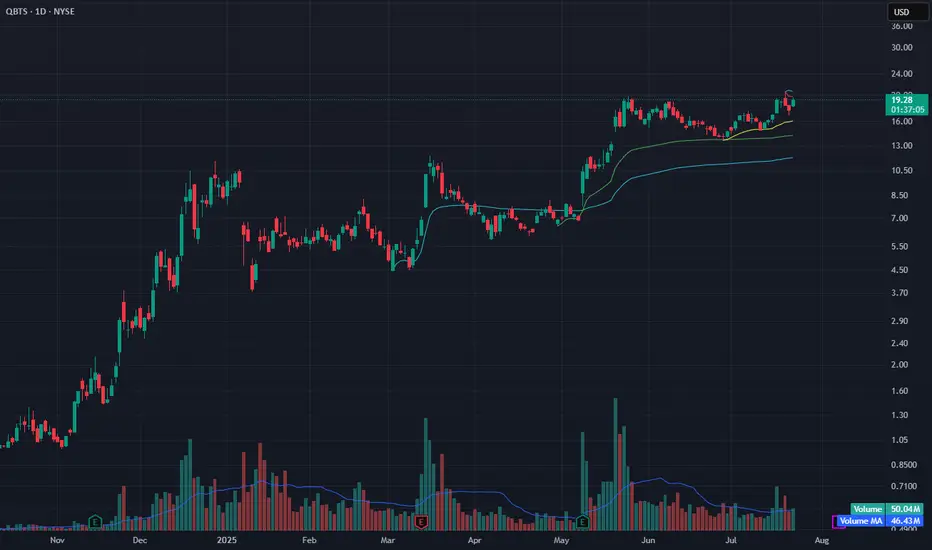
QBTS bull flag dailyBetter look at quantum computing ticker QBTS bull flag on the daily timeframe. Previous post looked at the weekly timeframe to highlight the bullish momentum. Lots of retail money piled into this one in the last few months, a breakout of this bull flag will likely be followed by a parabolic move.