Rklb shortI am short from 54$, and still not closed.
It was a lucky dqy for me takin short position just before the atm news. I predict this wave should end way below current price levels.
RKLB trade ideas

Rocket lab chart looks amazing. $100 plus is my target.Rocket lab is at the perfect place the perfect time with the perfect products. Chart looks extremely bullish and the basic channel indicates over 100 soon.. This chart reminds me of my other winner RGTI before I took off from the $15 mark. Do your due diligence before you pull the trigger in buying or shorting.
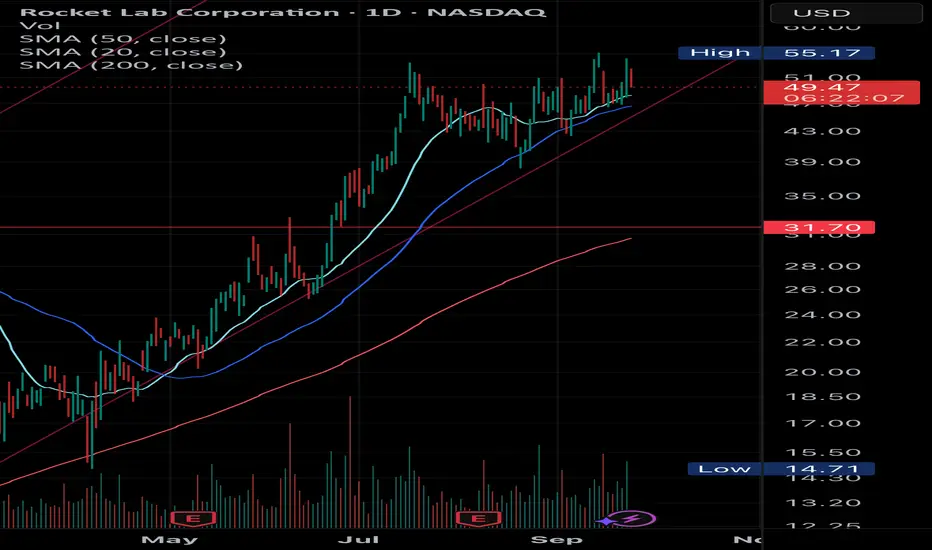
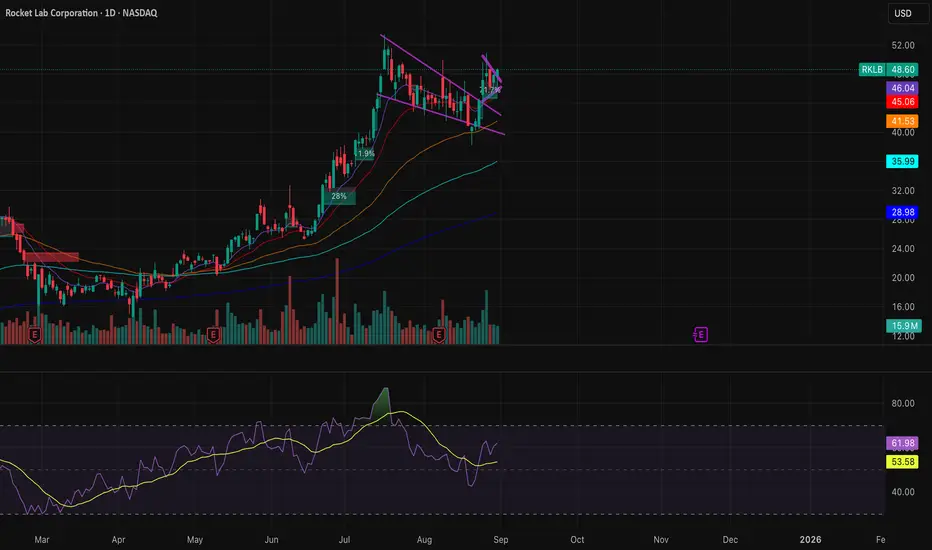
$RKLB Testing Breakout Levels – Next Leg or Pullback?Trend: Still in a strong uptrend since April. Price is consolidating after testing recent highs ($55). Structure remains bullish as long as key supports hold.
Support Zones: Immediate support at $49.10–47.22, aligning with 20 EMA. Deeper support sits at $43.86 (50 EMA) and $42.29–41.20 zone. A close below $41 would weaken the setup.
Resistance Levels: Overhead resistance at $55.17 (recent high). Breakout confirmation comes above $57.57 (Fib 2.618) → opens path to $62.19, then $73.94 / $84.05 / $90.31.
Momentum: RSI at 54.8 reset from overbought—room for another leg higher if buyers step in.
Outlook: Pullback may act as healthy retest of breakout zone. Holding above $47 keeps bulls in control. Watch $55–57 breakout for the next impulsive leg.
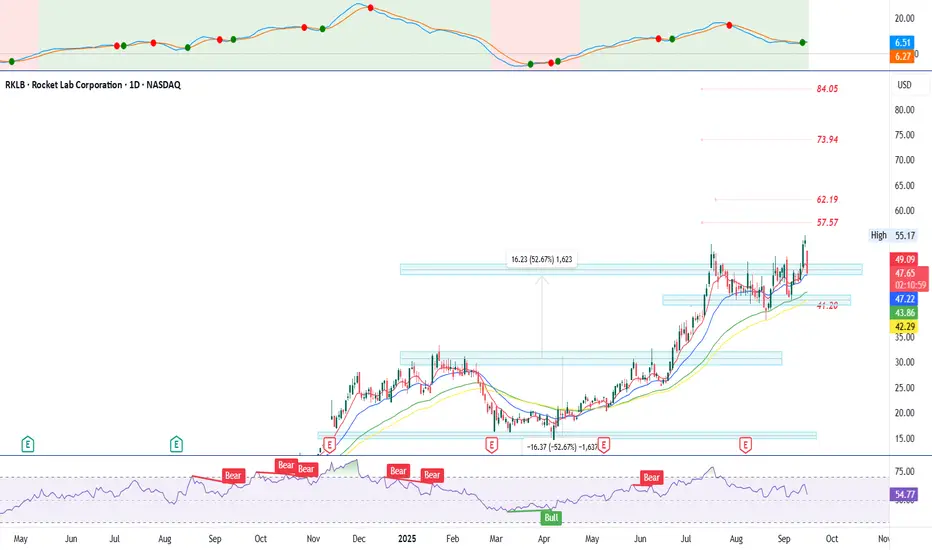
RKLB: Elliott Wave Analysis. TARGET $71
RKLB is in its final move up to complete its fifth wave in wave three.
If W1=W5 target is 71.
After this move a deep retracement likely a complex Wave 4 should unfold before we see continuation to the upside.

$RKLB FIB-levelsLatest test has been near highest 23.6% FIB-level which sits at 41.65$
Stock came down after 17th July 2025 all time high. After 15 market days consolidation stock pulls down to 38$.
Stock retested support 20th August 2025. (Exactly same support/consolidation-zone before run to all time high so around 38-39$ area)
Bounced off that 38-39$ support to around 50$-area. Double top at 51$'s resistance. No support yet. ------> Pulls back to near 23.6% FIB-level. This is IMHO the consolidation-area now.
Strong resistance levels are currently IMHO: High 45$'s, low 47$'s, high 48$'s, high 49$'s, 51$, 52$ & 53$.
Strong support levels are 42.33$, 43.10$, 44.45$, 45.38$, & 47.08$.
It's quite hard to predict how high stock price will go if all time high breaks. My prediction is with upside momentum somewhere between 62-64$'s in upcoming weeks.
Most bearish scenario is 38.2% FIB-level retest at 34.45$. I don't see it myself coming because showing strong support to 23.6% FIB-level 41.65$.
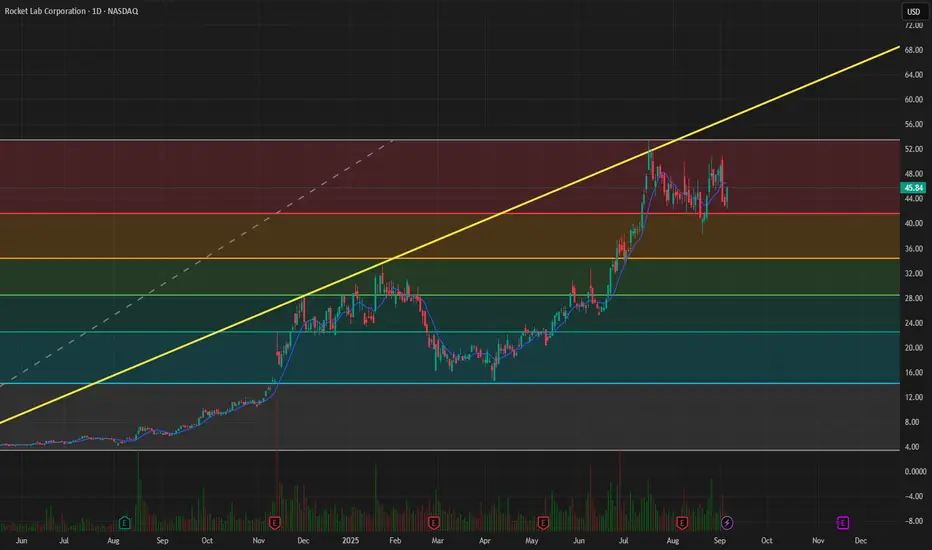
$RKLB - Can't Stop, Won't StopNASDAQ:RKLB - Can't Stop, Won't Stop
Holding uptrend and downtrend at the same time.
Breakout = $62.81
Breakdown = $33 Retest
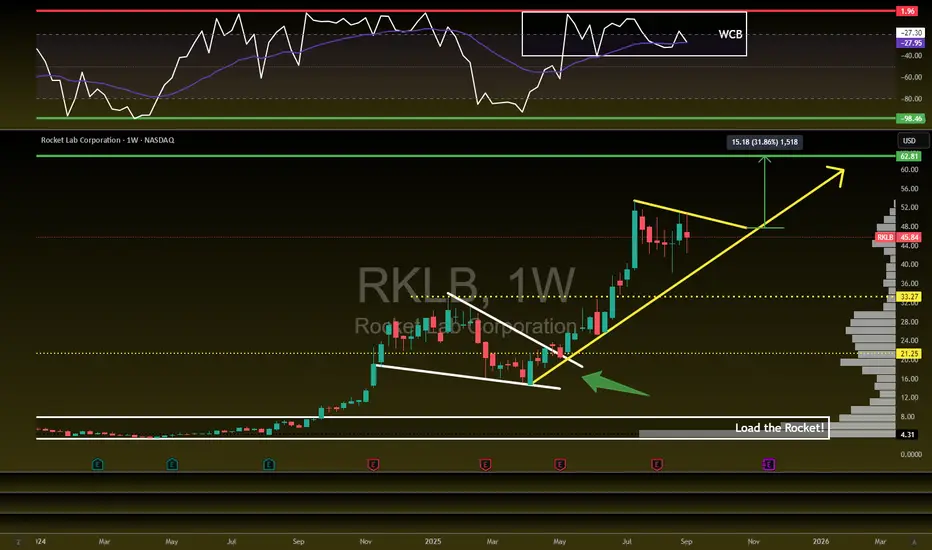
RKLB Next target is 65.60Rocket Lab showed good strength to end the week last week, finally closing above the recent downtrend line. Next structure target would be 65.60, with partial profits being taken at key fibonacci levels along the way. The thesis changes is we break 34.

RKLB Breakout Imminent RKLB has been pretty hot this year, and after the break out of the initial bullflag, we have another small wedge. I think we break up even more soon, as the beginning of the breakout in the wedge has already started today.
Rocket Lab USA, Inc. (RKLB) Expands Satellite LaunchesRocket Lab USA, Inc. (RKLB) is an aerospace company specializing in small satellite launch services and space systems. Its flagship Electron rocket provides frequent, cost-effective launches for commercial and government customers, while its Photon spacecraft platform supports satellite deployment and deep-space missions. Rocket Lab’s growth is fueled by rising demand for satellite launches, expanding defense and commercial contracts, and its push into larger vehicles like Neutron.
On the chart, a confirmation bar with rising volume signals bullish strength. The price has entered the momentum zone after breaking above the .236 Fibonacci level. A trailing stop can be set just below this Fibonacci mark using the Fibonacci snap tool, helping traders secure gains while allowing room for more upside potential.

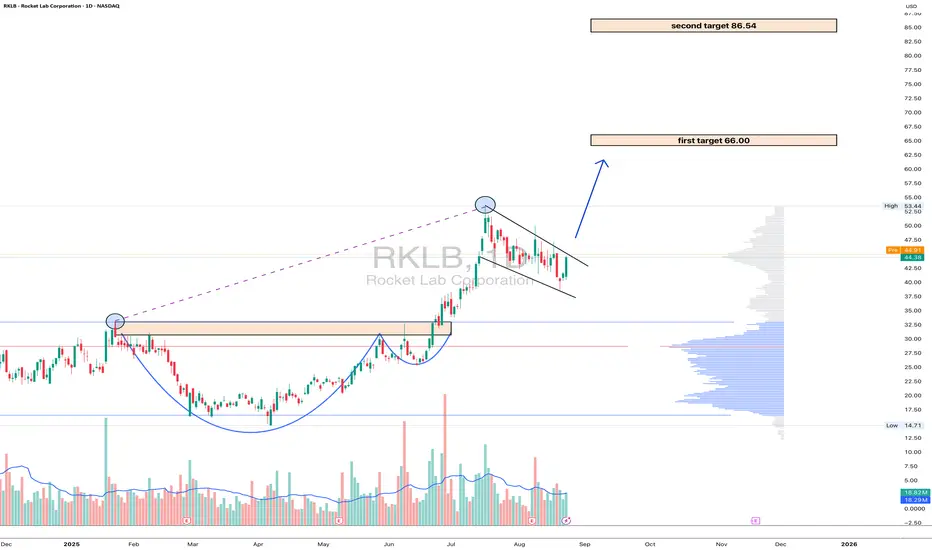
RKLB: the rocket is fueled and ready for orbitOn the daily chart of Rocket Lab (RKLB) , the price is trading at $44.38 after a confident breakout above key consolidation zones. Technically , the break of the $40 level confirmed the strength of the bulls and solidified the upward structure. The next target is $66 - a strong resistance aligned with the Fibo extension and if momentum holds, the market could extend toward $86.54, where long-term levels converge. EMA indicators remain below the price, reinforcing the bullish outlook.
Fundamentally , Rocket Lab stands as a leader in the small-launch vehicle sector, strengthened by contracts with NASA and consistent commercial demand. Amid growing interest in the aerospace industry and rising competition with SpaceX, the company benefits from diversified revenue streams and steady launch schedules. On the geopolitical side, increased defense programs in the U.S. and allied nations provide additional long-term support.
Tactically , the zone above $40 now acts as a support: as long as price holds above it, the bullish scenario remains intact. Targets are set at $66 and $86.54. Short-term corrections are possible if the market overheats, but the broader structure points upward, with institutional flows suggesting accumulation.
If this scenario plays out, Rocket Lab won’t just launch satellites - it’ll launch portfolios into orbit.
Rocket Lab Corp. (RKLB)RKLBdesigns and manufactures the Electron small orbital launch vehicle, a family of flight-proven spacecraft, and the Company is developing the large Neutron launch vehicle for constellation deployment.

$RKLB LongEntry: 39.68
Stop: 36.74
Target: 42.75
Signals (at entry):
Flow: Call/Put Vol Ratio: 1.63 Net Δ: 57.89
IV Skew (Put/Call): 0.87
Max Pain: 45.5
Due to the bullish option sentiment, a long trade was opened with a 1:1 risk.

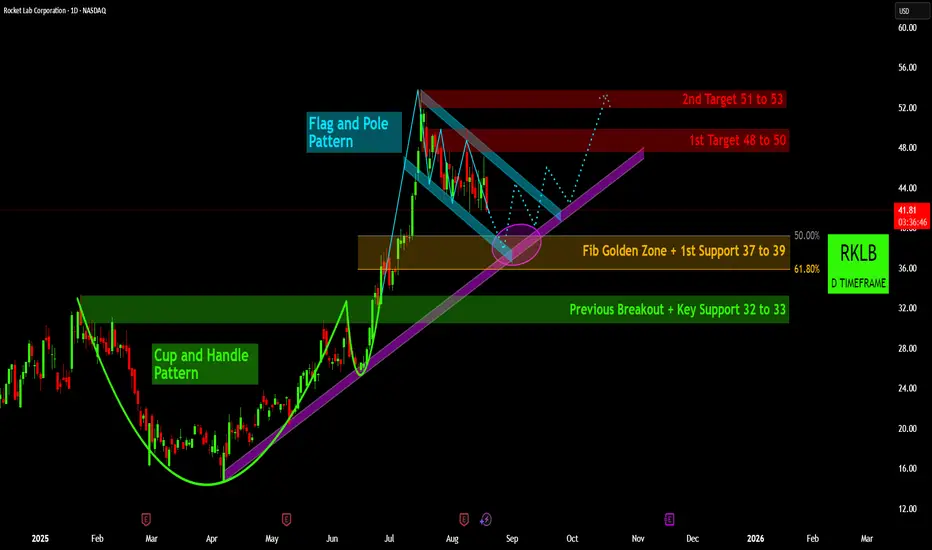
RKLB's Technical Blueprint: Is a Power-Up Imminent?🎯 RKLB's Technical Blueprint: Is a Power-Up Imminent? 🪐
Rocket Lab (RKLB) has presented a fascinating technical picture, displaying classical chart patterns that suggest a potential bullish continuation after a period of consolidation. My analysis points to key levels to monitor for future price action.
Foundation for Growth:The Cup and Handle Breakout: Earlier in the year, RKLB successfully formed and broke out of a well-defined Cup and Handle Pattern 📈, a classic bullish continuation signal. This robust formation propelled the stock into a strong rally, establishing significant upward momentum and highlighting investor conviction following its previous consolidation. This breakout set the stage for the subsequent price discovery at higher levels.
in.tradingview.com
Current Consolidation: The Flag and Pole Pattern: Following the sharp upward move, RKLB has entered a Flag and Pole Pattern 📉. Price action is currently consolidating within a descending channel, typical of a healthy correction after a strong run. This pattern often serves as a pause before the next leg up, allowing the market to absorb gains and gather energy for another significant move. Traders are keenly observing this phase for a decisive breakout.
in.tradingview.com
Critical Confluence Zone for Reversal: The stock is currently approaching a highly significant confluence zone 🟣. This area around $37 to $39 (identified as the "1st Support") aligns perfectly with the Fibonacci Golden Zone (50%-61.8%) and the lower boundary of the descending flag channel. Furthermore, a long-term ascending trendline provides additional underlying support in this same region. This convergence of multiple support indicators makes this zone a high-probability area for a potential bullish reversal and rebound. Below this, Key Support at $32 to $33 (the "Previous Breakout" level) stands as a crucial backup.
in.tradingview.com
Upside Potential and Price Targets: Should RKLB successfully find support within this identified confluence zone and break out of the descending flag pattern, significant upside targets come into play. Our analysis identifies an initial 1st Target range of $48 to $50 🎯, followed by a 2nd Target range of $51 to $53 🎯. The projected trajectory from a successful bounce within the confluence zone supports a move towards these higher price levels, confirming the continuation of the underlying bullish trend.
In summary, Rocket Lab's price went high due to the initial SPAC-driven excitement, coupled with a solid operational track record, a strategic pivot to vertical integration (beyond just launch), significant customer wins, and ambitious future plans (like Neutron) that promise to unlock larger market opportunities. It is crucial for investors to understand that Rocket Lab (RKLB) is a high-risk, high-reward long-term investment, and while the technical setup appears promising for a bullish continuation, market dynamics and company-specific developments will ultimately dictate its future trajectory. Monitor the identified support levels closely for confirmation of a potential move higher.
Disclaimer:
The information provided in this chart is for educational and informational purposes only and should not be considered as investment advice. Trading and investing involve substantial risk and are not suitable for every investor. You should carefully consider your financial situation and consult with a financial advisor before making any investment decisions. The creator of this chart does not guarantee any specific outcome or profit and is not responsible for any losses incurred as a result of using this information. Past performance is not indicative of future results. Use this information at your own risk. This chart has been created for my own improvement in Trading and Investment Analysis. Please do your own analysis before any investments.
$RKLB Overvalued asf! - NASDAQ:RKLB is overvalued. I will either stay on the sidelines or short the heck out of this POS.
- Company sells hopium which doesn't have meaningful materialization as of now and not even in the distant future.
Fundamentally,
2025 | 2026 | 2027 | 2028
-0.32 | -0.08 | 0.17 | 0.47
Revenue:
576.83M | 905.01M | 1.21B | 1.69B
- Market cap of NASDAQ:RKLB currently sits at 24.61B as of July 17, 2025.
- People who are buying now are buying someone else bag and are in for a horrible ride.
- Consider buying it under $15 if you are super bullish
RKLB Looking to Blast Off, Market PermittingNASDAQ:RKLB breaking the 20 SMA... market permitting, this may be a good short term trade
TradeUSAsignals RecommendationsRKLB - The 50, 100, and 200-day moving averages all indicate an upward trend, as the stock is clearly trading above them. The Relative Strength Index (RSI) hovers around a neutral level with a slight upward bias (approximately 47-54). The MACD indicator provides a positive signal with a bias favoring the upward trend.
Reasons supporting the continuation of the uptrend:
Trading above the long-term moving averages (50, 100, 200): A strong indicator of the persistence of the upward trend and sustained demand for the stock.
Strong support: The current price is near support zones that protect the stock from sharp downward movements.
Momentum indicators (RSI and MACD) are positive or neutral with an upward tendency: Indicating that the momentum is still in favor of buyers.
Recent bullish wave with notable trading volume: Reflects investor confidence in the stock and continued support for the trend.
Summary:
The stock is on an upward path supported by stable moving averages and strong price supports, with momentum indicators backing the continuation of the bullish movement in the short to medium term.

RKLB wait for break Out Fibo Level🚀 RKLB Weekly Options Alert (Aug 12, 2025)**
**Bias:** 🔥 **BULLISH** — Institutional money flowing in, low VIX, RSI rising!
📊 **Quick Stats:**
* **Daily RSI:** 53.9 ↗ (building momentum)
* **Weekly RSI:** 73.7 ✅ strong uptrend
* **Volume:** 1.4× avg — institutional accumulation confirmed
* **Options Flow:** Call/Put = **1.80** 📈
* **VIX:** 15.89 — great for longs
💡 **Consensus Play:**
* **Type:** Naked CALL
* **Strike:** \$47.00
* **Expiry:** Aug 15, 2025
* **Entry:** \$0.93
* **PT:** \$1.67 (+80%)
* **SL:** \$0.40
* **Confidence:** 75%
* **Exit Timing:** Before Friday to dodge gamma crush
⚠ **Risks:**
* Daily RSI still under 55 — could see intraday chop
* Only 3 DTE — time decay will bite if slow move
---
**📈 TL;DR:**
Volume + RSI + options flow = 🚀 Setup. Tight risk. Fast exit.
\#RKLB #OptionsTrading #SwingTrade #WeeklyOptions #FlowTrading #UnusualOptions #OptionsFlow #StockMarket #TradingSetup #BullishBreakout #TechnicalAnalysis #CallOptions #OptionsAlert
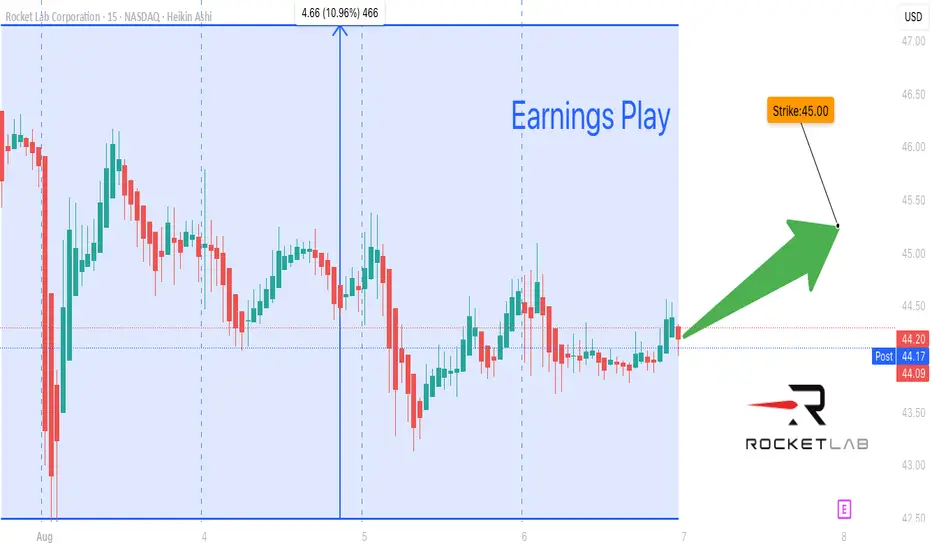
RKLB Earnings Bet: Will Rocket Lab Blast Off After August 7?
### 🚀 RKLB Earnings Bet: Will Rocket Lab Blast Off After August 7? 🚀
**🔥 75% Bullish Confidence | IV Rising | \$45C Looking Juicy!**
📊 **Earnings Play Breakdown – August 6, 2025**
🧠 **Model Summary:**
* ✅ *Revenue Growth: +32.1% YoY*
* 🚨 *Still Unprofitable (-44.3% margin)*
* 📉 *Oversold RSI: 30.10 (Bounce Setup?)*
* 🏗️ *Heavy R\&D Drag – But Long-Term Tailwinds*
💥 **Options Heat:**
* \$45C ➡️ Heavy Volume @ \$2.27
* Implied Move: \~5%
* Call/Put Flow: Bullish Lean
* IV Rank: 75% 🚨
📈 **Suggested Trade:**
> 🟢 **RKLB 45C (Aug 8 Expiry)**
> 🎯 Entry: \$2.27 | Exit Target: \$4.54+
> 📉 Stop: \$1.14 | RR: 3:1+
> 📆 Enter: Before Earnings (Aug 7, AMC)
---
🧠 **Why It’s Hot**
> RKLB is down, oversold, and loaded with short interest — but earnings could ignite a squeeze. High IV, sector tailwinds, and bullish flow = setup worth watching.
---
📌 **Hashtags (for visibility)**
`#RKLB #EarningsPlay #RocketLab #OptionsTrading #HighIV #BullishSetup #SpaceStocks #VolatilityPlay #CallOptions #TradingView`
Rocket Lab Is Up 800%+ in 12 Months. What Does Its Chart Say?Space-services company Rocket Lab NASDAQ:RKLB , which has seen its stock shoot up by more than 75% year to date and 800%+ over the past 12 months, will report its latest quarterly earnings next Thursday. Does RKLB's chart show the company has more altitude to gain ... or will it crash back to Earth?
Let's check things out:
Rocket Lab's Fundamental Analysis
For those of you unfamiliar with RKLB, it's a Long Beach, Calif.-based end-to-end space company. (Full disclosure: I own shares in the name.)
Rocket Lab designs and manufactures its own small- and medium-class rockets in order to provide launch services from its sites, which are primarily in Virginia and New Zealand.
The company has mostly had commercial customers since its founding, but is starting to get some traction providing these services to the U.S. government for national-security purposes. You might say the firm competes with Tesla chief Elon Musk's privately held SpaceX and Amazon founder Jeff Bezos' private Blue Origin firm, just on a smaller scale.
RKLB is set to release Q2 results after the bell on Aug. 7, with the Street looking for a $0.07 adjusted loss per share on $135.3 million of revenue.
That would represent a 27.3% revenue gain from the $106.3 million the company took in during the same period last year, although profitability would have eased from the $0.05 adjusted loss per share RKLB posted in Q2 2024.
Of the seven sell-side analysts that I found that cover the stock, three have increased their earnings estimates since the quarter began, three have cut their estimates and one has sat on his hands.
Notably, Jeff Van Rhee of Craig-Hallum this week initiated Rocket Lab with a "Hold" rating and a $51 target price (vs. the $45.30 the stock was trading at Friday afternoon).
Looking further ahead, analysts expect Rocket Lab's revenues to grow 32% for 2025 as a whole, followed by another 56% for all of 2026.
As for price action, Rocket Lab's shares have traded more volatilely as the firm approaches its earnings release. After spiking into mid-July on an almost parabolic run, RKLB has recently consolidated with a number of days that saw multi-percentage-point drops.
As of Wednesday, options markets were pricing in a 50% likelihood of a move greater than 13%.
Rocket Lab's Technical Analysis
Now let's look at RKLB's chart going back to December:
Readers will note that since Rocket Lab ended its sharp upward run in mid-July, the stock's Relative Strength Index (the gray line at the chart's top) has exited overbought territory -- although the RSI still remains healthy.
Readers will also see that within the daily Moving Average Convergence Divergence indicator (marked "MACD" at the chart's bottom), the histogram of the stock's 9-day Exponential Moving Average (or "EMA," denoted by blue bars) has entered negative territory. That's usually short-term bearish.
Meanwhile, Rocket Lab's 12-day EMA (the black line near the chart's bottom) has also crossed below its 26-day EMA (the gold line). This is also traditionally a bearish signal.
However, one positive for the RKLB is that the stock appears to have found support in recent days at its 21-day EMA (the green line above). This suggests a willingness of swing traders to support the stock at that line.
Still, Rocket Lab's chart is showing what looks like a completed "head-and-shoulders" pattern of bearish reversal at the chart's right (denoted by curving black lines).
Should this pattern foretell a sell-off (as the daily MACD seems set up for), Rocket Lab's downside pivot would likely show up as a neckline at around $37 a share. That's well below the $45.30 that RKLB was trading at Friday afternoon.
What if Rocket Lab fails to hold its 21-day EMA ($45.90 in the chart above)? In that case, both the 50-day Simple Moving Average (or "SMA," marked with a blue line) and 200-day SMA (the red line) would have to come into play for the pattern implied here to become fully realized.
(Moomoo Technologies Inc. Markets Commentator Stephen “Sarge” Guilfoyle was long RKLB the time of writing this column.)
This article discusses technical analysis, other approaches, including fundamental analysis, may offer very different views. The examples provided are for illustrative purposes only and are not intended to be reflective of the results you can expect to achieve. Specific security charts used are for illustrative purposes only and are not a recommendation, offer to sell, or a solicitation of an offer to buy any security. Past investment performance does not indicate or guarantee future success. Returns will vary, and all investments carry risks, including loss of principal. This content is also not a research report and is not intended to serve as the basis for any investment decision. The information contained in this article does not purport to be a complete description of the securities, markets, or developments referred to in this material. Moomoo and its affiliates make no representation or warranty as to the article's adequacy, completeness, accuracy or timeliness for any particular purpose of the above content. Furthermore, there is no guarantee that any statements, estimates, price targets, opinions or forecasts provided herein will prove to be correct.
Moomoo is a financial information and trading app offered by Moomoo Technologies Inc. In the U.S., investment products and services on Moomoo are offered by Moomoo Financial Inc., Member FINRA/SIPC.
TradingView is an independent third party not affiliated with Moomoo Financial Inc., Moomoo Technologies Inc., or its affiliates. Moomoo Financial Inc. and its affiliates do not endorse, represent or warrant the completeness and accuracy of the data and information available on the TradingView platform and are not responsible for any services provided by the third-party platform.
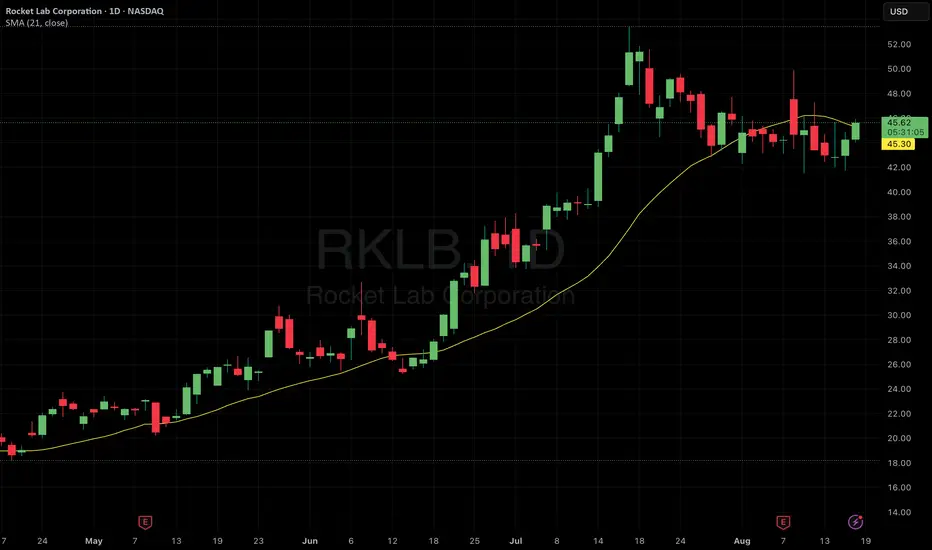
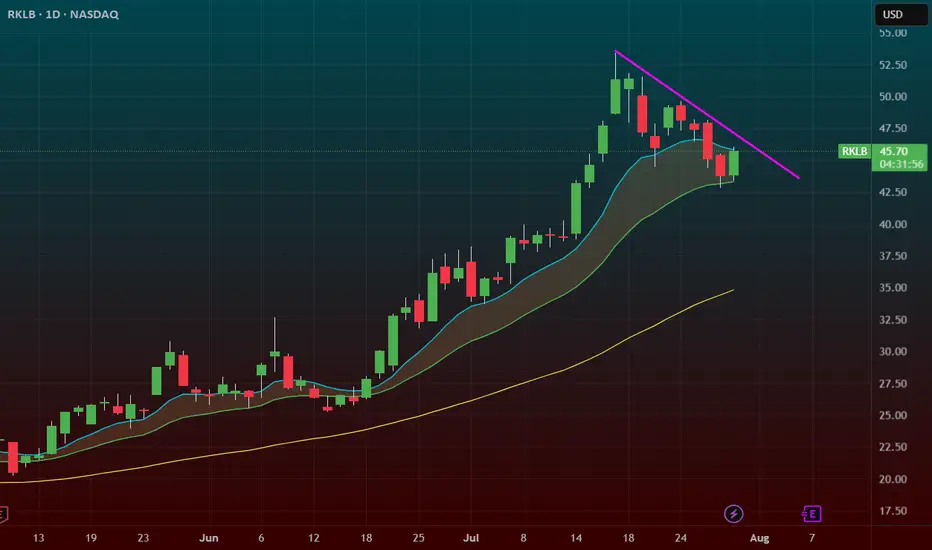
$RKLB – Momentum Pullback to 20 SMA with Trendline Break IncominRocket Lab ( NASDAQ:RKLB ) is setting up for a classic trend continuation move after a strong run. It just pulled back to the 20 SMA for the first time since breaking out over $35 — and it’s holding like a champ.
🔹 The Setup:
After peaking near $55, price pulled back in an orderly fashion on lower volume — a healthy correction.
Now we’ve got a hold at the 20 SMA, with a close back over the 9 EMA and a trendline break in progress.
This is where momentum tends to re-ignite.
🔹 Why It’s Powerful:
First 20 SMA test since the breakout = high probability bounce zone.
Lower volume on the pullback signals no panic selling.
A close over the 9 EMA + trendline = potential speed-up candle.
🔹 My Trade Plan:
1️⃣ Entry: Looking for confirmation over the 9 EMA and trendline.
2️⃣ Stop: Under the 20 SMA — tight structure, defined risk.
3️⃣ Target: Retest of highs near $55 with potential extension on breakout.
Why I Love This Chart:
NASDAQ:RKLB is a momentum name — when it moves, it moves fast.
The trend is intact, the pullback was clean, and now we have structure + volume setup.
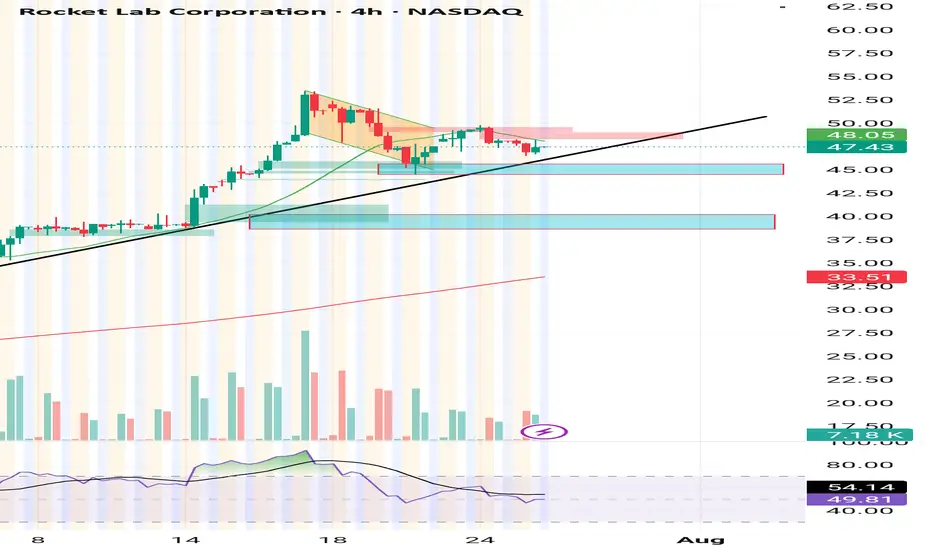
Looking for a long setupLooking at the 4hr trend line for a starter, if it breaks looking to the next block for an add.
How We're Earning A 13%+ Yield Selling Puts On Rocket LabThe commercial space sector is booming, and Rocket Lab NASDAQ:RKLB stands out as one of the most promising players—not just another speculative startup or space tourism hype. But while the company is making strong operational strides, its stock valuation appears stretched, prompting a more strategic approach to investing.
📈 Strong Execution, Growing Opportunity
Rocket Lab continues to hit meaningful milestones. In Q1, the company:
Secured a U.S. Space Force contract for its upcoming Neutron heavy-lift rocket.
Won hypersonic-related contracts with the U.S. Air Force and the U.K. Ministry of Defense.
Successfully completed five Electron rocket launches and booked eight more.
Made a strategic acquisition for developing "Flatellites," enhancing vertical integration.
Revenue rose 32% year-over-year, with gross margins in the mid-30% range. Importantly, Rocket Lab has a $1 billion+ revenue backlog, with over half expected to convert in the next year, and a healthy mix of government and commercial clients across both its Launch and Space Systems divisions.
💰 Valuation: Big Potential, Bigger Price Tag
Rocket Lab's business is solid, but its valuation raises red flags. With a price-to-sales ratio near 55x (compared to SpaceX's ~14x), investors are paying a steep premium for future success. The company is still unprofitable, and the high valuation leaves little room for error. Simply put, the market may be rewarding Rocket Lab too early.
📊 The Smarter Move: Sell Put Options
Instead of buying shares at inflated levels, the better approach is to sell put options—a strategy that earns upfront cash and offers the opportunity to buy shares at a discount if the stock drops.
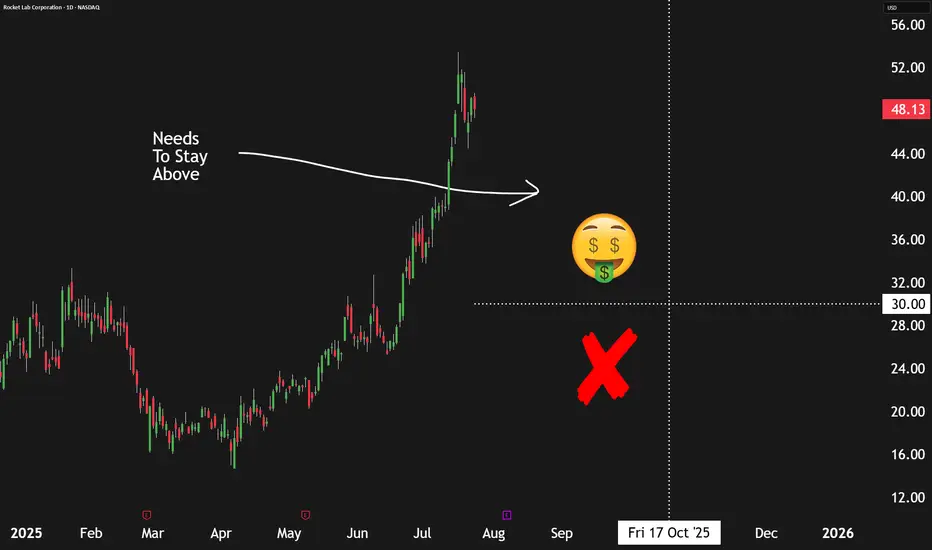
Recommended trade:
Sell October 17th $30 strike put options
Premium: ~$96 per contract
Required buying power: ~$2,904
Implied return: ~3.3% over 90 days, or ~13.4% annualized
This provides income now, while still giving investors potential exposure to Rocket Lab at a 40% discount to current prices.
⚠️ Risks to Consider
This isn’t risk-free. If Rocket Lab’s execution falters—especially with Neutron—shares could drop sharply. Selling puts means you may still be forced to buy at $30, even if the stock falls much lower. This strategy works best for investors comfortable owning RKLB long term at a lower entry price.
✅ Bottom Line
Rocket Lab is a strong business, but the stock looks overheated. Selling put options offers a more balanced way to participate in its growth story—earning income now while positioning to buy the stock later at a better value.
Rating: Buy (via options strategy)