Trade ideas
SILJ Technical Analysis OverviewHi,
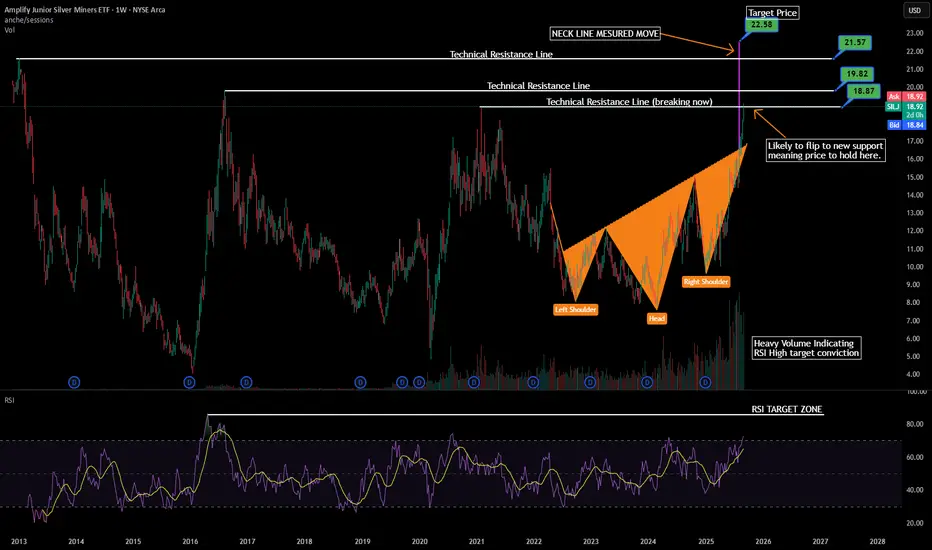
This is my second publication on SILJ. I’ve identified an ascending inverse head and shoulders pattern, which can also be interpreted as a stronger W-formation with higher lows. The measured move from this setup points to a breakout that would clear multiple historic resistance levels on SILJ.
One consideration is the timing of share issuance in earlier periods, which may align with this recent price action. However, silver miners are clearly playing the catch-up trade to gold, and I expect these resistance levels to be taken out, with SILJ potentially making a new all-time high.
The recent surge in volume supports this view, suggesting further upside in both RSI and price. Confirmation would come from daily or 4H closes above the first resistance, likely flipping it into support. In that case, dip buying off re-tests of key resistance levels becomes the higher-probability trade.
I also recommend monitoring spot silver, which is eyeing the $50/oz level. Remember that miners generally lag the silver price due to earnings cycles—their performance is tied to how much silver was actually produced, which is inherently variable.
SILJ offers diversified exposure by averaging across a basket of junior miners, giving potential for outsized upside capture. I also like SIL and will provide a technical breakdown on that ETF next.
Regards,
R.
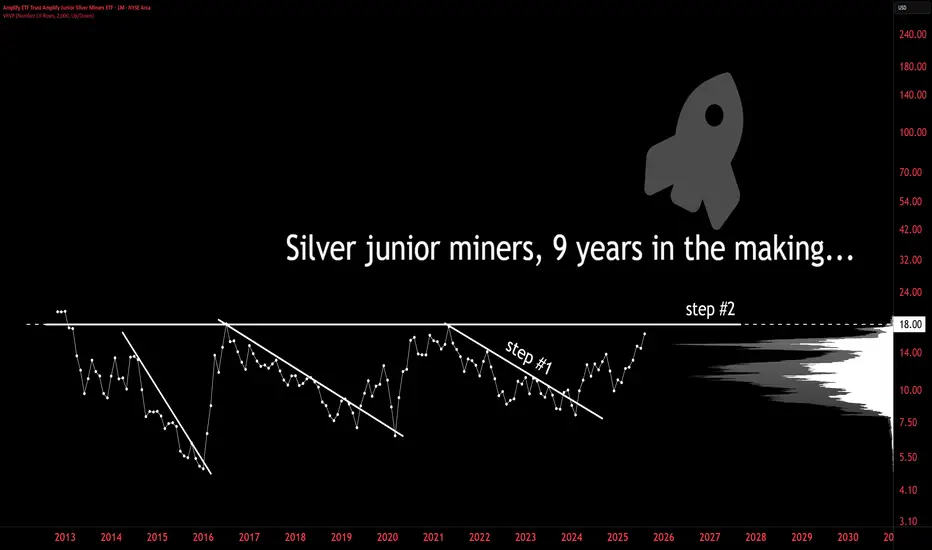
bull era for silver junior miners is ahead of us, not behindStep #1 ✅ Completed.
Step #2⏭️ On deck.
The bull era for silver junior miners is ahead of us, not behind.

SILVER JUNIORS: 9 YEARS IN THE MAKING🚨 SILVER JUNIORS: 9 YEARS IN THE MAKING
✅ Step 1: Internal breakout
🔜 Step 2: Final resistance @ $18
When these go, they don’t walk — they sprint.
The chart says it all.
Short term pb likelyI am thinking that this move up on silver and more specifically SILJ is overdone and a decent size pull back is coming short term...yes...I remain boolish long term, however in the near term I think we will see a pb that can be traded to the downside for the next couple of weeks...but I could be wrong!
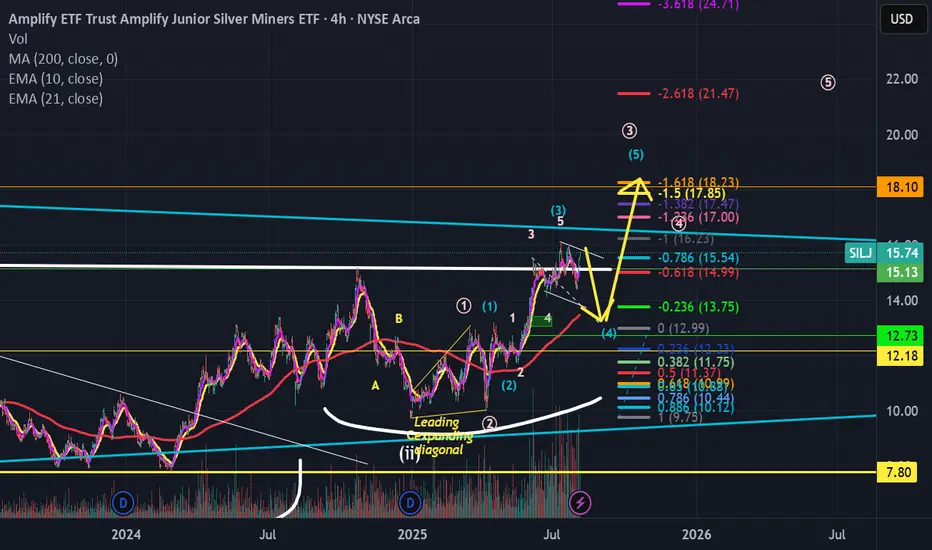
A closer up view of SILJA slighty closer up view of my previously posted SILJ analysis. The yellow could could be off by one degree...in other words the yellow (3) might actually be the teal (3), but either way I see a major move up very very soon...by end of August >$20 imo.

Call me crazy....but SILJ looks explosive here...In my opinion we are seeing a series of 1,2's on SILJ which are about to result in a MAJOR move to the upside. IF I am correct then we will see $20+ in very short time...by the end of August!

Breakout is next?Shaded red looks like a tough nut to crack (being in a confluence of resist zone for some major channels), but with the majority of price action over the last 5 years below (shaded blue), and weekly EMA30 as the wind on its back (red line), it may look possible now. AMEX:SILJ #silver

Silver Junior MinersFor me, the true bind blowing run for silver junior miners starts when the silj ETF is above $18.
Whatever happens before is simply the pre game show.

Silver Junior Miners bullish viewThe Silver Junior Miners are poised for significant growth as we move forward.
Please keep in mind that this is not financial advice. It's important to practice sound risk management. If you find this idea interesting, feel free to boost and share! :)

Bearish hammer on 6M chartI sold all of my AMEX:SILJ last week, which I'd typically wait for the yearly candle to close but it seemed like it was barely holding on by a thread and might not wait the few more days. Then the bottom completely fell out this morning. Whew, close call
The 6M candle looks like death. I'm still very bullish on silver as a LT play but I don't want to be out on the edge of the risk curve while the market pukes. Next major support is around $6.

Metals & Miners Are About To EXPLODE HIGHER (50%-100%+)Please don't miss this opportunity.
I've been studying the metals charts, and last weekend, the SILJ chart caught my attention.
I started looking at longer intervals (Weekly and Monthly) to see what I could find.
XME and SILJ are showing excellent Inverted Excess Phase Peak patterns that may resolve as a breakaway upward price trend over the next 8 to 24+ months - sending both XME and SILJ over 40-50% higher at a minimum.
This sounds crazy, but Metals and Miners are probably the best opportunities for swing position trading right now as hedge investments and/or very long-term options play.
There is nothing else out there that has a 100-200% rally potential and the ability to hedge against global risk factors.
I believe SILJ, XME, Gold, Silver, & Platinum will likely be HUGE WINNERS over the next 12-24+ months.
Get some.
#trading #research #investing #tradingalgos #tradingsignals #cycles #fibonacci #elliotwave #modelingsystems #stocks #bitcoin #btcusd #cryptos #spy #es #nq #gold

SPY/QQQ Plan Your Trade For 11-25-24 - Carryover TrendToday's pattern is a Carryover in Trend mode. Obviously, this is a holiday week, and because of low liquidity, I expect to see moderately wild price volatility.
Stay cautious, as price moves could be exaggerated this week.
Gold and Silver are still attempting to break higher and trading in a consolidated sideways price channel.
BTCUSD pauses into the holiday week.
This would be a good week to pause, read a good book, and avoid the risks in the global markets.
This shortened trading week will likely result in very wild price swings.
Stay cautious.
Get some.
#trading #research #investing #tradingalgos #tradingsignals #cycles #fibonacci #elliotwave #modelingsystems #stocks #bitcoin #btcusd #cryptos #spy #es #nq #gold

Silver Dollar in Ya FaceIf this doesnt mean anything to you, go back to bed. This is ready to go. This one is slow and steady, so if you want fast money, go elsewhere.

SILJ- Parabolic move comingAs discussed, similar to Gold Miners, the Silver Junior Miners will go parabolic as we move ahead.
Kindly note, this is not a financial advise. Please consider proper risk management.
If you like this idea, please like and share. :)

Silver Miners pop, down and then launchI feel a flash crash coming on, similar to Covid - wouldn't surprise me if Birdflu was the catalyst (see my NASDAQ:GILD idea). The patterns line up exactly the same. You can't see it with this picture, but tons of my indicators are going off -which I will post below. Silver Miners will exit the ascending triangle this go around as the commodity supercycle takes off. Could silver miners go a little more up then down? Absolutely, but miners are sensitive to market rallys and poundings like other stocks (see the pandemic in March 2020 on the chart).

Silver Miners vs Silver SpotThis might be the explosion that will kickstart the silver stocks. This chart is showing a possible W formation that's about to break out... as well as the 25 weekly crossing the 52 weekly, which is usually pretty significant. Lastly, if it can break above the ichimoku cloud, then this ride might take off.

SILJ breakoutSILJ has clearly broken out...it is approaching the 200MA on a weekly TF (Red MA)...expect a reaction at this level...may want to take some off around this level...perhaps a decent pb...a chance to reload if you ask me!

SILJ Ok, Silver is not Gold... but we can't help but wonder when Silver will be catching a bid?
Also, this downtrend line is on the verge of breaking.

Silver stocks ready to outperform uranium stocksThe ratio of SILJ (junior silver stocks)/URA( uranium stocks) has reached its A-B-C target and double bottom area.
It is also showing a bullish divergence on its momentum indicator.
We like very much the uranium sector over the long run but are expecting an out-performance of silver stocks over the coming months.

Silver Junior MinersSilver junior miners , very close to break above step #1.
Will this be the run that leads to a break above step #2?
#silver #miners AMEX:SILJ

Probabilities 101Look carefully at this Silver Junior Miners chart.
What is the MAJOR difference in those 2 trade setup propositions, other than what I already outlined?
Which is MOST probable of reaching its target AND why?
#trading #learning #miners #riskmanagement #silver

$ SILJ 100% Gain In less than a Year ? I may be crazy, but so is the world. I like it. I'm in. RSI shows that is is nearly bottomed. May give another 10% but the upside is there. BOOM BOOM
