SMCI – Sell the Spike, Buy the Dip Again?With SMCI approaching a key resistance zone around $64, I'm preparing for a potential pullback. If the price fails to break through that level convincingly, we could see a healthy dip — which I’ll use to re-enter. This is a classic “sell high to buy lower” setup — let the market breathe, then strike.
🟢 Entry Points (Buy the Dip):
$49
$45
$40
🔴 Profit Targets:
✅ $55 – quick bounce zone
✅ $60 – key resistance
✅ $65+ – if momentum continues
📌 Let the chart come to you — don’t chase.
Disclaimer:
This analysis is for educational and informational purposes only and does not constitute financial advice. Always do your own research and evaluate your risk tolerance before making any investment decisions.
Trade ideas

SMCI 100 !WOW.. SMCI is moving finally !!
These laggards in Semi space are getting some bid lately.
Around 35 was good buy zone but not late, if 64 breaks this can be a double soon.
This is above all major VWAPs now.
Long anywhere between 48-60
Target 1 - 80
Target 2 - 100
Stop Loss - 40

SMCI watch $43.89-44.88: Duoble Golden zone a MAJOR milestoneSMCI has been struggling to keep up with its brethren.
Now testing underside of Double Goldns at $42.89-44.88
This is a MAJOR milestone in the lifetime of this stock.

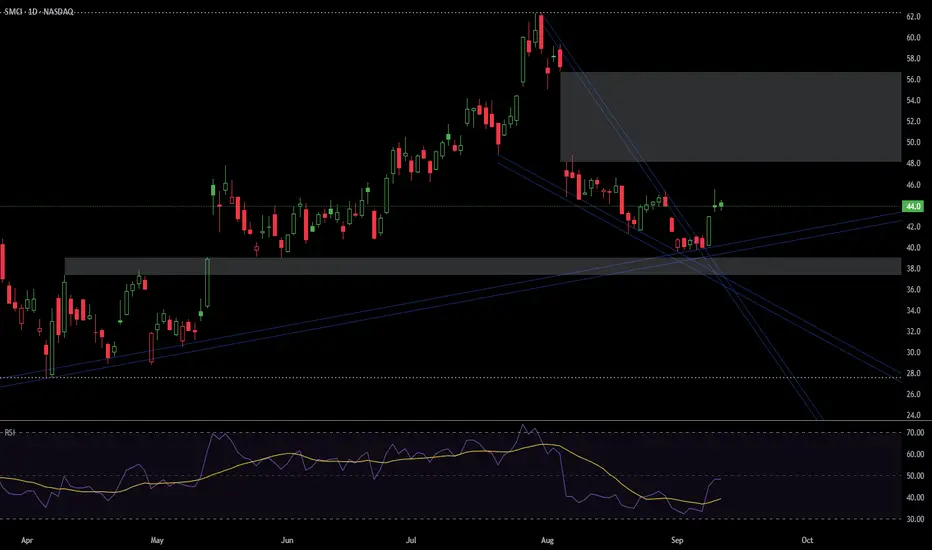
SMCI has been in a downtrend since July🔎 Technical Analysis
Trend Context
SMCI has been in a downtrend since July, but recently broke above a descending structure, signaling a potential trend reversal.
Current price: $49.65, with today’s high at $50.28.
Key Levels
Support Zones:
$45 (marked equilibrium & demand zone) → strong bounce area.
$39.71–$38.68 → deeper support in case of pullback.
Resistance Zones:
$57.07–$58 → strong overhead resistance.
$62–$68 → premium/strong high supply zone.
Indicators
RSI at ~67 → entering overbought but still has room to run.
Volume spike with recent bullish candles shows participation from buyers.
Market Structure
BOS (Break of Structure) confirms bullish intent.
Two projected paths drawn:
Immediate continuation toward $57–$58.
Small pullback to $45 equilibrium before resuming higher.
🎯 Trading Outlook
Bullish Case (higher probability)
If price holds above $45 and buyers keep momentum, target $57–$58 short term. Beyond that, $62–$68 could be tested if bullish volume continues.
📈 Trade Idea: Long on dips into $45–$46 demand zone with stop under $44. First target $57, stretch target $62+.
Bearish Case (lower probability, but risk to note)
If SMCI fails to hold $45, expect retrace toward $39.71–$38.68. Breakdown here could resume broader downtrend.
📉 Trade Idea: Short only if breakdown confirmed below $44 with target $40.
🧭 Strategic Note
Risk Management:
Favor long positions while above $45.
Risk/reward is favorable if entering near $45–$46 with target $57–$58.
Keep stops tight as SMCI is a high-volatility stock.
Catalysts:
Tech earnings season and AI-server demand news could push volatility higher.
Watch NASDAQ index correlation.

Gap Fill setup w Psych 50 and Semi leader Breaking out AHSimple gap fill setup
Pro-
-50 psych above magnet
-gap resistance tested multiple times
-Indicators for RSI and Relative strength vs SPY are all flashing here for me
-good consolidation since last year and VRVP sitting under us now
Con-
-Market overall extended so might get Pull back
Entry/Exit-
-Entered full size in anticipation so RR is better but keeping stops at near VRVP
-Targets are 50 / 50.90 / 53.67 / 56.79(complete gap fill last target)
-Easy 2R Plus trade
Contingency plan-
If tomorrow NASDAQ:NVDA gives a giant reversal then cutting as the 1hr TF 50ema breaks.
Overall nice setup - market still holding strength and until trend is broken I will be happy dip buyer than a top chaser
SMCI: long with tight stopInverted head and shoulders pattern currently trying to resolve to the upside. Took out anchored VWAP from the pivot high on Jul 31st and also the volume shelf at 46.25ish. Lower indicators all look good. Target gap fill up around 57 with some resistance potentially from 49-50. With the market feeling a bit poppy and PCE this friday, will keep a tight stop on daily close below 44.90.
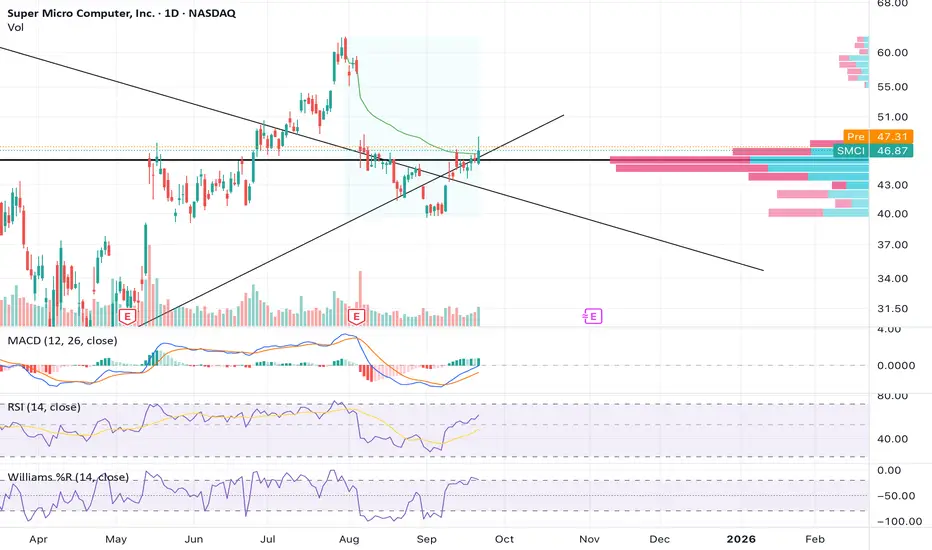
$SMCI Weekend Analysis - October 2nd, 2025NASDAQ:SMCI broke out of the inverse head and shoulders pattern last week while also breaking through the weekly downtrend line, confirming a strong technical shift in momentum.
The measured move from this breakout points to $56.76, which also happens to be the gap-fill area from last quarter’s earnings drop. Holding above that level could open up a run toward $62.44, a major S/R zone from earlier in the year.
The MACD is also curling toward a bullish crossover on the weekly chart, which supports this bullish setup and could help push SMCI beyond $62.77 and into the 70s if momentum continues.
I’m comfortable with an entry around current levels as long as the breakout structure holds. A daily close below $47.21, however, would invalidate this bullish outlook and likely trigger a retest of lower support levels.

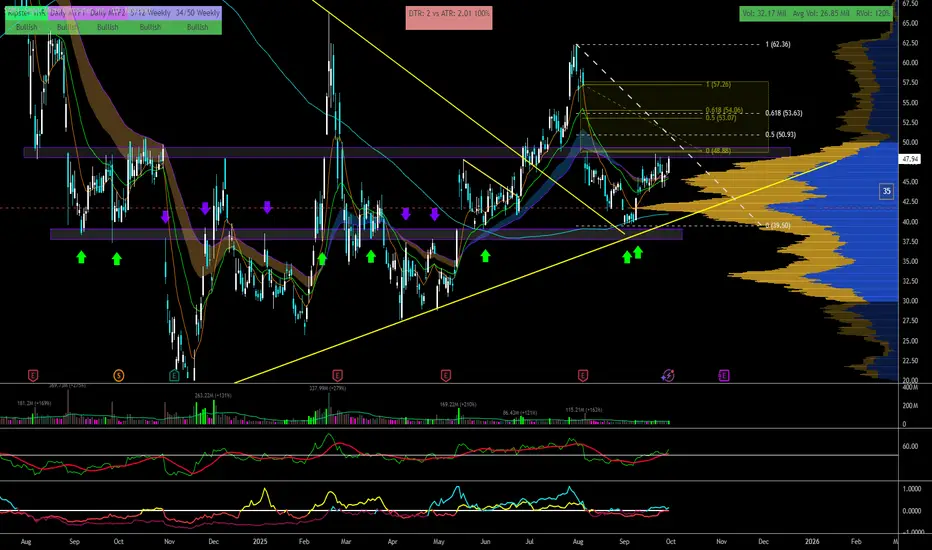
SMCI bullish reversal confirmationSMCI has closed above 51 which means it has entered the golden pocket of the short swing rally .
This confirms its movement towards 60/62 easy
Entries here with stop loss 47 would be a good swing trade

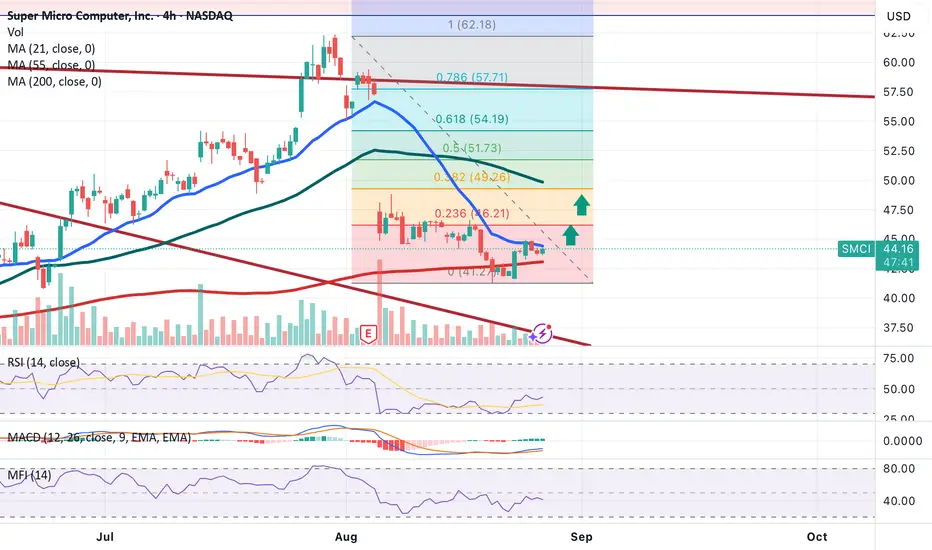
SMCI long📊 SMCI Technical Analysis (4H Chart)
SMCI price action has rebounded strongly from the 200-period moving average, confirming it as a key dynamic support zone.
✅ This bounce signals renewed bullish momentum.
🎯 Upside targets to watch:
First target: $46.21
Second target: $49.26
As long as price holds above the 200 MA, the bullish outlook remains intact. A break below would invalidate this setup.
SMCI DAILY GAP FILLNASDAQ:SMCI going for the daily gap fill at 56.79. Same setup as $COIN. Just broke into the daily cloud today as well.

SMCI ready to test the top of the Triangle at $63.50.Supermicro Computer Inc. (SMCI) has been trading within a 1-year Ascending Triangle but since August 06 it has been 'trapped' within its 1D MA50 (blue trend-line) and 1D MA200 (orange trend-line).
A closing above the 1D MA50, technically confirms the new Bullish Leg, targeting the top of the Ascending Triangle a $63.50.
If it then closes a full 1W candle above it, we will have a technical bullish break-out, targeting the All Time High (ATH) at $123.00.
-------------------------------------------------------------------------------
** Please LIKE 👍, FOLLOW ✅, SHARE 🙌 and COMMENT ✍ if you enjoy this idea! Also share your ideas and charts in the comments section below! This is best way to keep it relevant, support us, keep the content here free and allow the idea to reach as many people as possible. **
-------------------------------------------------------------------------------
💸💸💸💸💸💸
👇 👇 👇 👇 👇 👇

Potential Gap Fill IncomingSMCI's EMAs on the daily are finally starting to reclaim a bullish stack since the Earnings fall off. Strong trendline support, inverse head and shoulders, and strong SMCI leap call flow indicates to me that there's gap fill potential. Long SMCI.
SMCI – The Fastest Server Builder in AI BUYSuper Micro is the breakout leader in custom AI-optimized server racks, scaling alongside NVIDIA’s growth. With unmatched speed in system design and delivery, SMCI is winning market share in the AI cluster arms race.
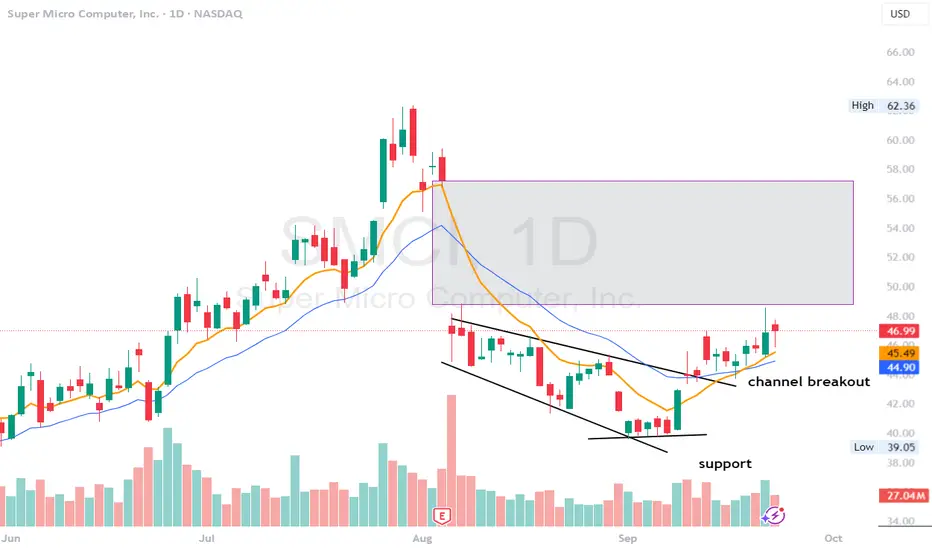
$SMCI - channel breakout hereSMCI - Stock holding channel breakout on the daily. Stock has a decent gap to fill to the upside from $48.79 to $57.16. high watch here for gap entry and fill. High watch here for breakout. Stock is decent at indicator level.
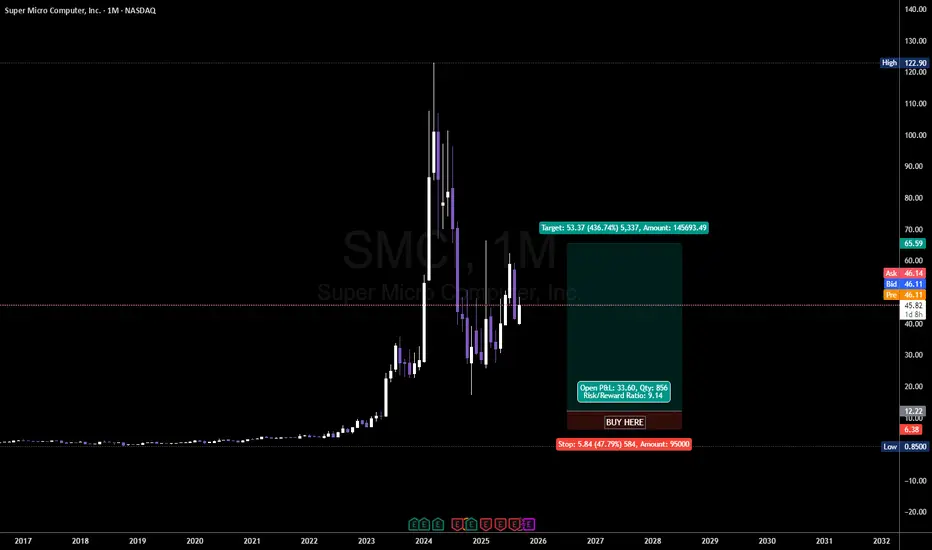
The rocket has lifted offWith Nvidia’s investment in OpenAI, Supermicro (SMCI) is expected to benefit from increased equipment purchases, which will boost its sales and help it recover the value lost due to unfounded rumors from certain fund managers. An initial recovery of 32% is projected, with a price target of up to $100 area.
Now we have a huge Symmetrical triangle pointing to 116

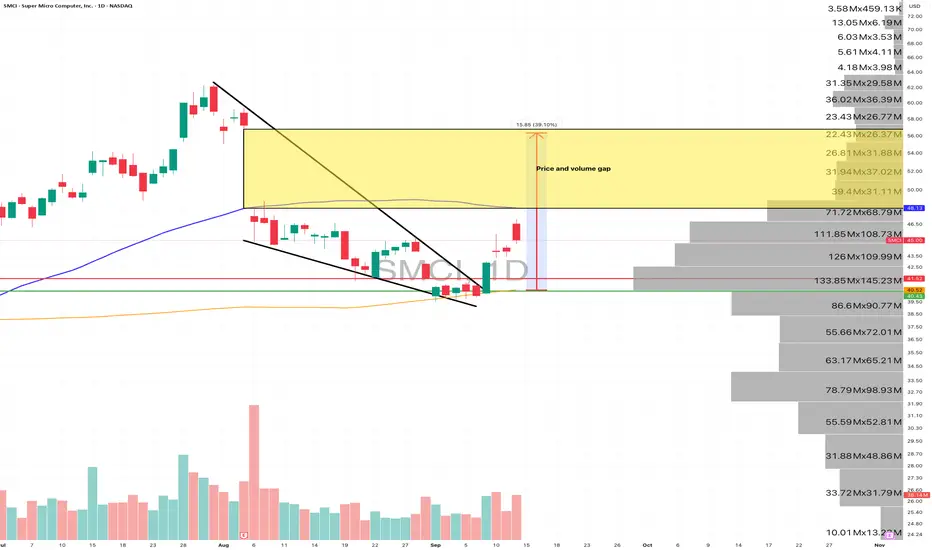
$SMCI Weekend analysis - 21st September, 2025NASDAQ:SMCI is starting to shape up an inverse head & shoulders. The neckline lines up almost perfectly with the 50D SMA around 47.7 - a pretty important level to watch. If we get a clean daily close above that, it could unlock the next leg higher toward 56.7. That target makes sense not only from the measured move on the pattern, but also because there’s a big price/volume gap sitting in that zone that often acts like a vacuum.
On the flip side, if price closes 41.5, the setup is invalidated and I’d step aside. For now, it’s all about whether SMCI can flip 47.7 into support with volume behind it.

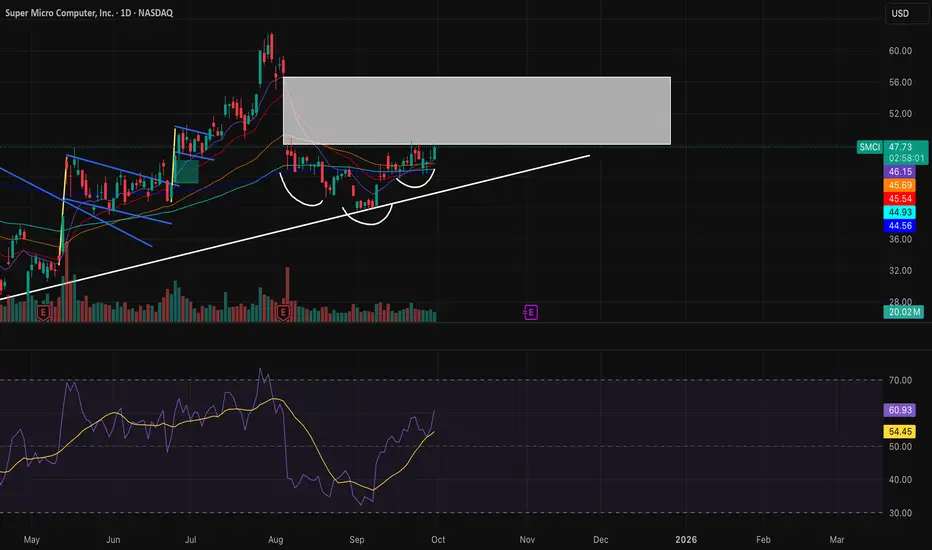
SMCI analysisEvery time price makes a fake breakdown below the 50 EMA, it quickly recovers and pushes higher.
Historically, these moves have led price to test the purple resistance zone highlighted on the chart.
Given the repeated pattern, I think the same dynamic could play out again, with price eventually making its way back to that resistance area.
🎯 Conclusion: Based on prior reactions to the 50 EMA, I expect SMCI to work its way toward the purple resistance zone. This is my professional view from the chart structure, though markets remain uncertain and no outcome is guaranteed.
👉 Stay tuned for more structured market insights — follow along for consistent expert-level analysis.

H4 trendline break + 200EMA reclaimThe heavily shorted stock - SMCI
They just can't take it down into that weekly gap below $39.50
I had massive amounts of limit buys down in that area to start an early position but the bulls held their ground and didn't allow it to trade into that area. You can see the $40 support is strong.
I don't want to go off on a Whim about the fundamentals because that's not how I trade. (Fundamentally I wanted it below $40 because I know it's an excellent long term play to own this stock under these discounted prices.
Now that we held that ground it's time for SMCI to break into the $50+ range.
Praying FOMC doesn't kill this momentum, if it does then I will keep my limit buys open below $40 and average down there in that weekly gap.
I can see SMCI running to $70-$80 by the end of year if we can break this previous high on the last rally.
I entered this trade a few days ago on the breakout with leap options and shares to give me some wiggle room on this play.
I set up a long and short tool on the chart if you want to attempt this as a scalp with stop losses, just understand with stop losses under $40 you could become stop raid liquidity.
Stop losses should be daily and weekly closes under $35, at that point I'm still going to be holding. Thats just my conviction on this for long term.

SMCI: It's time ......SMCI:
It's time!
Necessary swing for obsorbing supply demand and confirming bottom. Now it's time to load and go up!
.
US STOCKS- WALL STREET DREAM- LET'S THE MARKET SPEAK!

$SMCI Weekedn Analysis - 14th September, 2025Broke out of the wedge last week and made a solid move up. Next stop looks like $48 (50D SMA).
If that level flips into support, I’m looking at $56.8 in the coming month or two - mainly because of the big price/volume gap left after earnings and the wedge target lining up around the same zone.
A close below $40.52 would kill this setup.
NFA.
SMCI - LongSMCI is looking good on the daily. This next week will be a telling sign of where it wants to go. Reasoning for going long here: EMA’s curling up on larger time frame, B-Xtrender is showing momentum and curling up. This one is lagging behind the market, so I feel like this one could be a waiting game or the time has come.
Concerns: Weekly Chart looks like its not ready, but the histogram looks like bears are fading.
Target: $66.40 (targeting the high that didn’t get tested), this will push us back into the low that happened on 19 April. Bullish indicator would be an impulse leg through there. If it wicks the high, I'm taking profit and looking for an entry on liquidity (FVG’s, etc.).

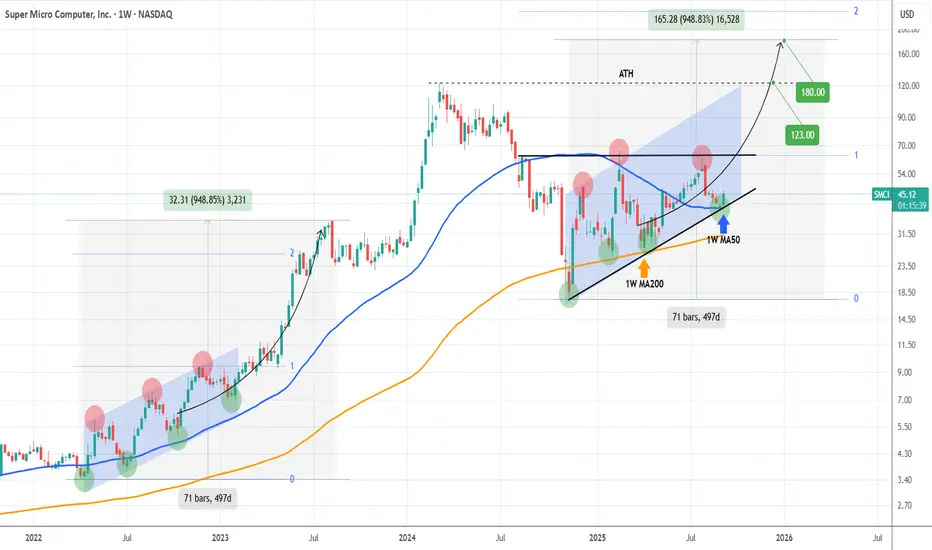
SMCI Rebounding on its 1W MA50 and targeting the ATH.Super Micro Computer Inc (SMCI) hit last week its 1W MA50 (blue trend-line) and this week posts a strong 1W candle. This rebound comes on the Higher Lows trend-line (bottom) of the 1-year Ascending Triangle.
It may not be exactly like the Channel Up of 2022 but it looks like a similar Accumulation pattern that preceded the massive 2023 rally. The Triangle typically breaks to the upside and technically targets the 2.0 Fibonacci extension. This time that would be even higher than the 2023 rise of +948.85%.
In any case that would be our over-extended Target ($180.00), with a more 'reasonable' one being the All Time High (ATH) of $123.00.
-------------------------------------------------------------------------------
** Please LIKE 👍, FOLLOW ✅, SHARE 🙌 and COMMENT ✍ if you enjoy this idea! Also share your ideas and charts in the comments section below! This is best way to keep it relevant, support us, keep the content here free and allow the idea to reach as many people as possible. **
-------------------------------------------------------------------------------
💸💸💸💸💸💸
👇 👇 👇 👇 👇 👇
Levels to trade $SMCIMargin Pressures and Market Dynamics
• Pricing wars driven by Dell and HPE compress gross margins.
• Supply-chain cost volatility from component shortages impacted FY2024 revenue timing.
• Surge in low-margin GPU pass-through sales dilutes overall profitability.
Differentiation Strategies
• Building Blocks Architecture enables custom configurations and faster validation cycles, meeting full customer specs versus off-the-shelf alternatives.
• Liquid-cooled server designs (e.g., DLC-2 series) deliver up to 40% power savings in AI workloads.
• Close integration with NVIDIA’s GB200/300 and Blackwell GPU platforms secures first-mover advantage on next-gen AI contracts.