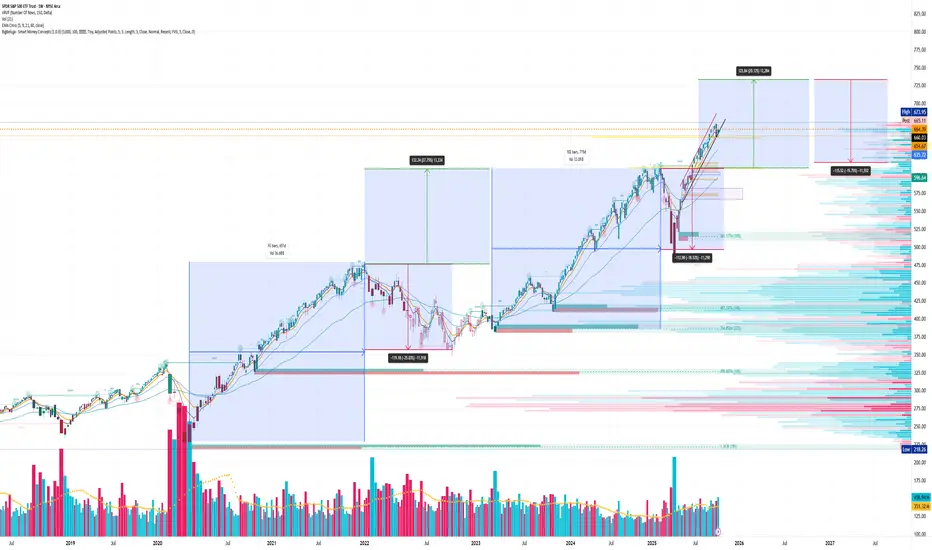
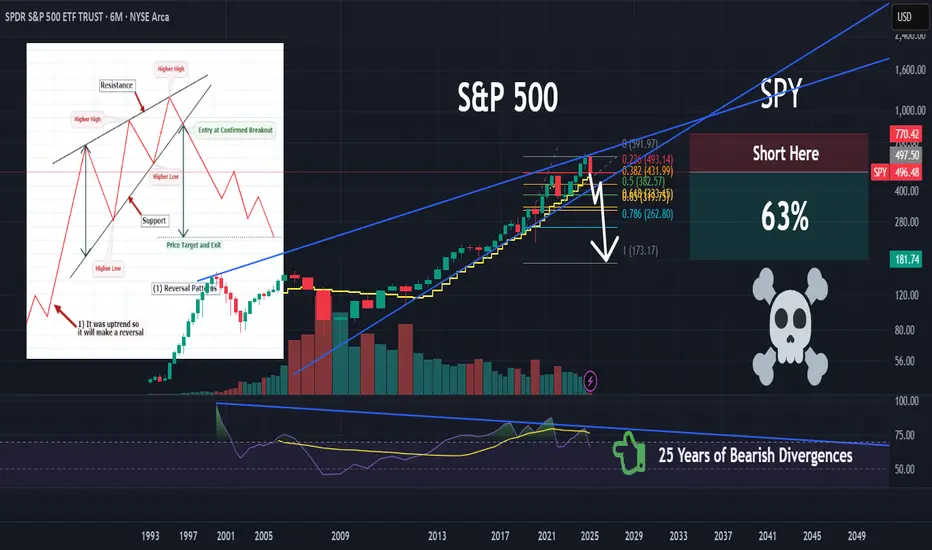
Blow Off Top Simulation SPY (Bearish with Hedges)We now have our first 1Week chart with a red candle since April which is a big deal and will probably lead to a regime change.
I wanted to see what the worst case scenario would look like blow off top. totally possible i used the price action since April to mirror the same pattern.
The reason why i think a blowoff top is that we broke the trend line we've been in for a few years so the structure is off and we'll need to find a new trend, this give price action the excuse to continue especially with all this liquidity. ultimately i think the liquidity isn't rally cash but exit liquidity and a window for the institutions to hand out bags.
we also need to keep in mind there will be tax loss harvesting coming up some are already in that mode.
Trade ideas

HOW-TO: Trade-o-Scope Plot Custom Data v2This is a short HOW-TO on using the Trade-o-Scope "Plot Custom Data v2" indicator

$SPY chart patternsTake a good look at this fellow traders. I didn't put a lot of time into this, so excuse my lack of numbers. You could call me a visual learner to simplify what already feels like a complicated day if you know what i mean.
October 17th 2025 - All time high res on S&P 500 SPY held ...S&P 500 SPY put in all time high at 673.95 on October 9th 2025. Now watching 673.95 resistance and support at around 652.84. Expecting some consolidation now ....

Signs and SignalsSP500 bounced from overnight lows. Do we get a ramp up to all time highs? It's hard to tell. A little more squeezing of late shorts may be all that is needed for the bigger players to step in and sell it. Watch 6550, if it breaks we likely breakdown. Over the 18ma at 6677 and we are likely rallying into next week at the least.

Position Sizing and Risk ManagementThere are multiple ways to approach position sizing. The most suitable method depends on the trader’s objectives, timeframe, and account structure. For example, a long-term investor managing a portfolio will operate differently than a short-term trader running a high-frequency system. This chapter will not attempt to cover all possible methods, but will focus on the framework most relevant to the active trader.
Equalized Risk
The most practical method for position sizing is known as equalized risk per trade. This model ensures that each trade risks the same monetary amount, regardless of the stop loss distance. The position size will be calculated based on the distance between the entry price and the stop loss, which means a closer stop equals more size, where a wider stop equals less size. This allows for a more structured and consistent risk control across various events.
Position Size = Dollar Risk / (Entry Price − Stop Price)
Position Size = Dollar Risk / (Entry Price × Stop in %)
For example, an account size of $100,000 and risk amount of 1% will be equivalent to $1,000. In the scenario of a $100 stock price, the table below provides a visual representation of how the position size adapts to different stop loss placements, to maintain an equalized risk per trade. This process can be integrated into order execution on some trading platforms.
The amount risked per trade should be based on a fixed percentage of the current account size. As the account grows, the dollar amount risked increases, allowing for compounding. If the account shrinks, the dollar risk decreases, which helps reduce the impact of continued losses. This approach smooths out the effect of random sequences. A percentage-based model limits downside exposure while preserving upside potential.
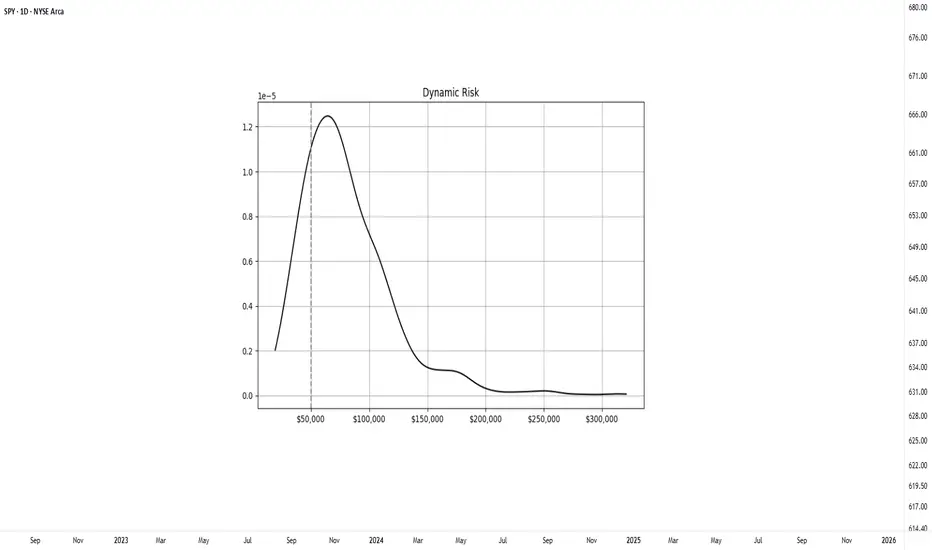
To better illustrate how position sizing affects long-term outcomes, a controlled simulation was conducted. The experiment modeled a system with a 50% win rate and a 1.1 to 1 average reward-to-risk ratio. Starting with a $50,000 account, the system executed 500 trades across 1000 separate runs. Two position sizing methods were compared: a fixed dollar risk of $1000 per trade and a dynamic model risking 2% of the current account balance.
Fixed-Risk Model
In the fixed-risk model, position size remained constant throughout the simulation. The final outcomes formed a relatively tight, symmetrical distribution centered around the expected value, which corresponds to consistent variance.
Dynamic-Risk Model
The dynamic-risk model produced a wider and more skewed distribution. Profitable runs experienced accelerated increase through compounding, while losing runs saw smaller drawdowns due to self-limiting trade size. Although dynamic risk introduces greater dispersion in final outcomes, it allows scalable growth over time. This compounding effect is what makes a dynamic model effective for achieving exponential returns.
A common question is what percentage to use. A range between 1–3% of the account is generally considered reasonable. Too much risk per trade can quickly become destructive, consider that even profitable systems may experience a streak of losses. For instance, a series of five consecutive losses at 10% risk per trade would cut the account by roughly 41%, requiring over a 70% return to recover. In case catastrophic events occur; large position sizing makes them irreversible. However, keeping position size and risk too small can make the entire effort unproductive. There is no such thing as a free trade, meaningful reward requires exposure to risk.
Risk Definition and Stop Placement
Risk in trading represents uncertainty in both the direction and magnitude of outcomes. It can be thought of as the potential result of an event, multiplied by the likelihood of that event occurring. This concept can be formulated as:
Risk = Outcome × Probability of Outcome
This challenges a common assumption that using a closer stop placement equals reduced risk. This is a common misconception. A tighter stop increases the chance of being triggered by normal price fluctuations, which can result in a higher frequency of losses even when the trade idea is valid.
Wide stop placements reduce the likelihood of premature exit, but they also require price to travel further to reach the target, which can slow down the trade and distort the reward-to-risk profile. An effective stop should reflect the volatility of the instrument while remaining consistent with the structure of the setup. A practical guideline is to place stops within 1–3 times the ATR, which allows room for price movement without compromising the reward-risk profile.
When a stop is defined, the distance from entry to stop becomes the risk unit, commonly referred to as R. A target placed at the same distance above the entry is considered 1R, while a target twice as far is 2R, and so on. Thinking in terms of R-multiples standardizes evaluation across different instruments and account sizes. It also helps track expectancy, maintain consistency, and compare trading performance.
In summary, risk is best understood as uncertainty, where the outcome is shaped by both the possible result and the probability of it occurring. The preferred approach for the active trader is equalized risk per trade, where a consistent percentage of the account, typically 1–3%, is risked on each position regardless of the stop distance. This allows the account to develop through compounding. It also reinforces the importance of thinking in terms of sample size. Individual trades are random, but consistent risk control allows statistical edge to develop over time.
Practical Application
To simplify this process, the Risk Module has been developed. The indicator provides a visual reference for position sizing, stop placement, and target definition directly on the chart. It calculates equalized risk per trade and helps maintain consistent exposure.
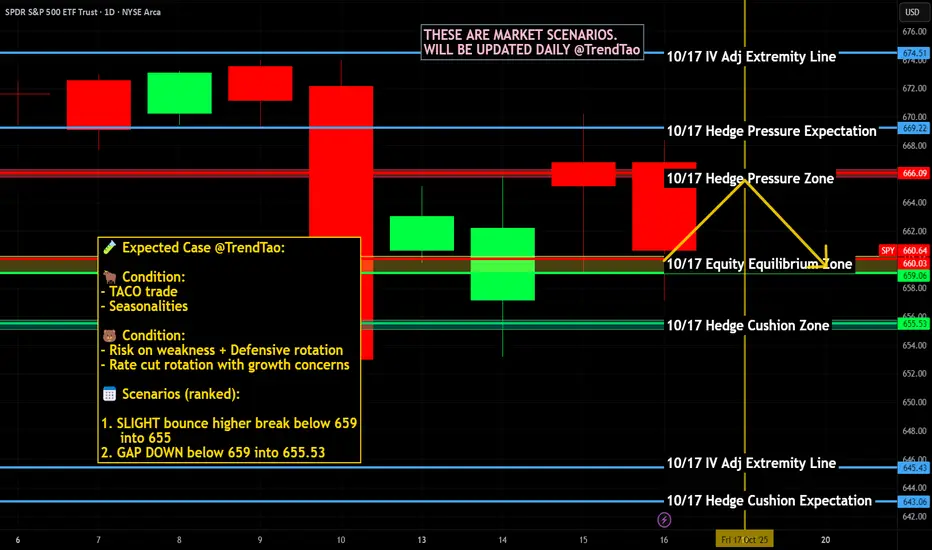
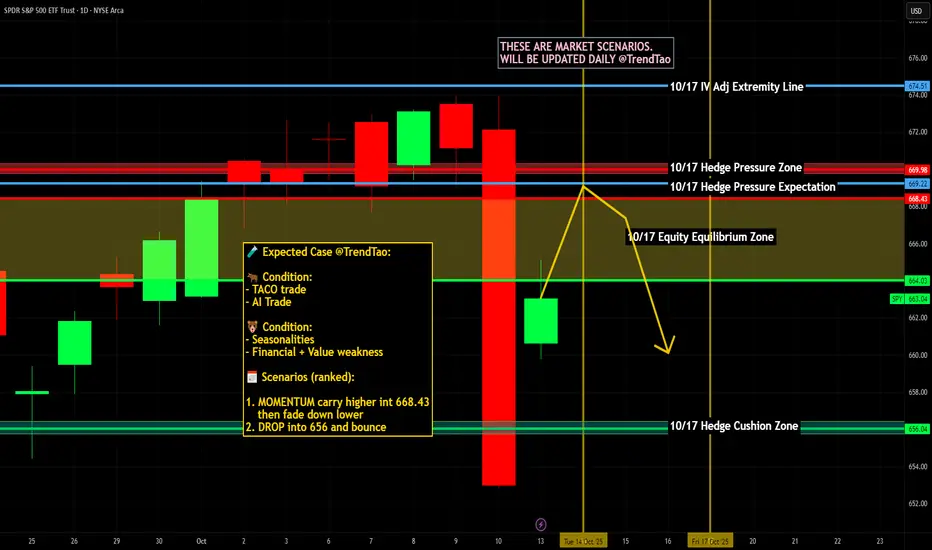
$SPY / $SPX Scenarios — Friday, Oct 17, 2025🔮 AMEX:SPY / SP:SPX Scenarios — Friday, Oct 17, 2025 🔮
🌍 Market-Moving Headlines
🚩 Data blackout risk: Friday was set for key housing and production reports — but the ongoing shutdown means most prints (Housing Starts, Industrial Production, Import Prices) may not be released.
📉 Macro vacuum: With no confirmed data, traders lean on positioning and bond moves to gauge growth sentiment into the weekend.
💬 Earnings carry the weight: Corporate results take the spotlight as macro inputs dry up.
💻 Technical tone: AMEX:SPY and NASDAQ:QQQ watchlist rotation continues — watch volatility pockets if liquidity fades mid-session.
📊 Key Data & Events (ET)
⏰ 8:30 AM — Housing Starts & Building Permits (Sept) — scheduled but may not print
⏰ 8:30 AM — Import Price Index (Sept) — scheduled release
⏰ 9:15 AM — Industrial Production & Capacity Utilization (Sept) — scheduled but may not print
⚠️ Note: Friday wraps a quiet macro week dominated by missing data and Fed commentary. Expect a headline-driven close with limited participation ahead of weekend risk.
⚠️ Disclaimer: Educational / informational only — not financial advice.
📌 #trading #stockmarket #SPY #SPX #housing #IndustrialProduction #ImportPrices #Fed #bonds #economy #shutdown #yields #equities
SPY Friday Setup – Bears Take Control Below $662. Oct. 17SPY Friday Setup – Bears Take Control Below $662 as Gamma Turns Negative ⚠️”
📊 Multi-Timeframe Breakdown
🕒 1. Daily Chart – Macro Structure (“The Why”)
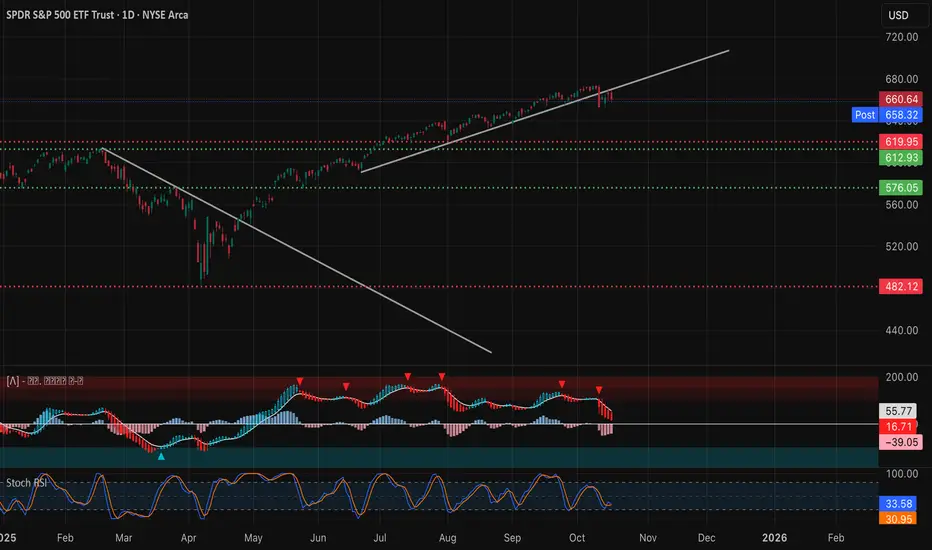
SPY continues to lose grip at the upper trend channel, printing its third consecutive red daily candle and officially breaking below the short-term rising trendline that’s guided price since April.
The breakdown below $662–$665 confirms a near-term shift in momentum from bullish to neutral-bearish.
MACD shows a clear bearish crossover, with histogram momentum building to the downside. Stoch RSI sits near the lower band, but not yet oversold — implying more room for a grind-down before a proper bounce.
Macro Bias: Momentum fading; corrective wave likely unfolding toward key supports at $650 → $620 unless bulls reclaim $665.
Key Levels:
* Resistance: $662 → $670 → $682
* Support: $658 → $650 → $620
⏰ 2. 1-Hour Chart – Active Market Structure (“The Setup”)
The 1H structure highlights a CHoCH confirmation near $662, with a decisive BOS to the downside that opened a new lower-low pattern.
Price retested the underside of the broken channel around $662–$664, rejected cleanly, and now trades below the intraday trendline — a bearish continuation setup.
MACD remains deep in negative territory, while Stoch RSI has reset near zero, suggesting sellers still control short-term momentum.
A recovery into $662–$664 may offer a fade setup if buyers fail to break above that zone with volume.
Key Levels:
* Resistance: $662 → $665 → $670
* Support: $655 → $650 → $645
💹 3. 15-Minute Chart – Intraday Execution (“The How”)
On the 15-minute timeframe, SPY shows a tight descending channel with multiple CHoCH → BOS prints confirming lower-high structure.
The MACD histogram has slightly flattened near zero, indicating short-term indecision after extended downside. Meanwhile, Stoch RSI is curling upward from oversold — suggesting a brief relief bounce before sellers step in again.
If price holds below $662, every rally into $660–$663 remains a short opportunity zone.
Scalp Plan:
* Bearish Scenario: Enter below $658, target $654 → $650, stop above $662.5
* Bullish Scenario: Flip long only on confirmed reclaim above $665, target $670, stop below $661
Volume spikes show heavy positioning around $660 — a battle zone likely to dictate the next leg.
📈 4. GEX (Gamma Exposure) Chart – Dealer Positioning (“The Fuel”)
Gamma flow data shows a bearish dealer setup, with highest negative NETGEX and PUT support now anchored near $660.
Dealers are short gamma — meaning volatility expansion can accelerate in either direction, but the bias is currently to the downside.
* Gamma Flip Zone: $662
* Highest Negative GEX / Put Wall: $660 (active support magnet)
* Second Put Wall: $656 → $654
* Call Resistance: $662 → $665
* IVR: 36.3 | IVx avg: 24.3 | Put flow: 145.1% dominant
The gamma structure implies dealers are hedging aggressively below $660, which can amplify intraday drops if $658 fails.
Until SPY reclaims $662+, market makers’ hedging flows remain bearish.
🎯 Final Outlook
SPY’s technical structure and gamma setup both favor a bearish-to-neutral bias heading into Friday.
The key battleground sits between $658–$662 — a zone where intraday liquidity repeatedly flips.
If $662 holds as resistance, expect continued downside toward $654–$650, where gamma exposure may stabilize.
A sharp reclaim of $665 would invalidate the short setup and shift sentiment back toward range recovery.
Watch for a fake breakout above $662 early Friday followed by rejection — a classic “trap and drop” scenario that aligns with the current gamma map.
Disclaimer:
This analysis is for educational purposes only and not financial advice. Always do your own research and manage your risk carefully.
$SPY / $SPX Scenarios — Thursday, Oct 16, 2025🔮 AMEX:SPY / SP:SPX Scenarios — Thursday, Oct 16, 2025 🔮
🌍 Market-Moving Headlines
🚩 Big macro day — if it happens: Retail Sales & PPI headline the morning, but both reports may be delayed under the ongoing shutdown. Markets will trade on expectation and reaction instead of prints.
📈 Consumer + price pulse: These two data points were expected to test the “soft-landing” narrative — inflation vs. spending resilience.
💬 Fed-speak heavy: Barkin, Waller, Bowman, and Miran dominate the lineup; tone on inflation stickiness may shape yields.
🏠 Housing check: Homebuilder Confidence offers a softer read on the real-economy drag from higher mortgage rates.
📊 Key Data & Events (ET)
⏰ 8:00 AM — Tom Barkin (Richmond Fed) remarks
⏰ 8:30 AM — Retail Sales (Sept) & PPI (Sept) — scheduled but may not print
⏰ 8:30 AM — Initial Jobless Claims (Oct 11) — scheduled release
⏰ 9:00 AM — Stephen Miran & Christopher Waller (Fed Govs) speeches
⏰ 10:00 AM — Michelle Bowman (Fed Gov) remarks + Homebuilder Confidence (Oct)
⏰ 12:45 PM / 4:30 PM — Tom Barkin (Richmond Fed) speeches
⚠️ Disclaimer: Educational / informational only — not financial advice.
📌 #trading #stockmarket #SPY #SPX #RetailSales #PPI #Fed #Barkin #Waller #Bowman #Miran #inflation #bonds #shutdown #economy #yields #housing

The Magic Show continuesMore tricks and traps tomorrow are possible.
The rsi and price action is concerning to me, and it tells me to stay cautious. We may see another fast move up to take out stops above the all time high, even if there is a sell off first with the numbers tomorrow at 8:30. Vix may have a similar "false breakout" and reversal back to it's breakout zone. Be very careful if there are fast moves down which seem to be bearish.

SPY | Things Could Get Ugly | ShortSPDR S&P 500 ETF Trust seeks to provide investment results that, before expenses, correspond generally to the price and yield performance of the S&P 500 Index. The Trust seeks to achieve its investment objective by holding a portfolio of the common stocks that are included in the index (the "Portfolio"), with the weight of each stock in the Portfolio substantially corresponding to the weight of such stock in the index.
Objective short on SPYAt resistance, slightly over the 18ma. Stops probably taken out but structure looks like it could drop from here. Also covering gold, bitcoin and the vix

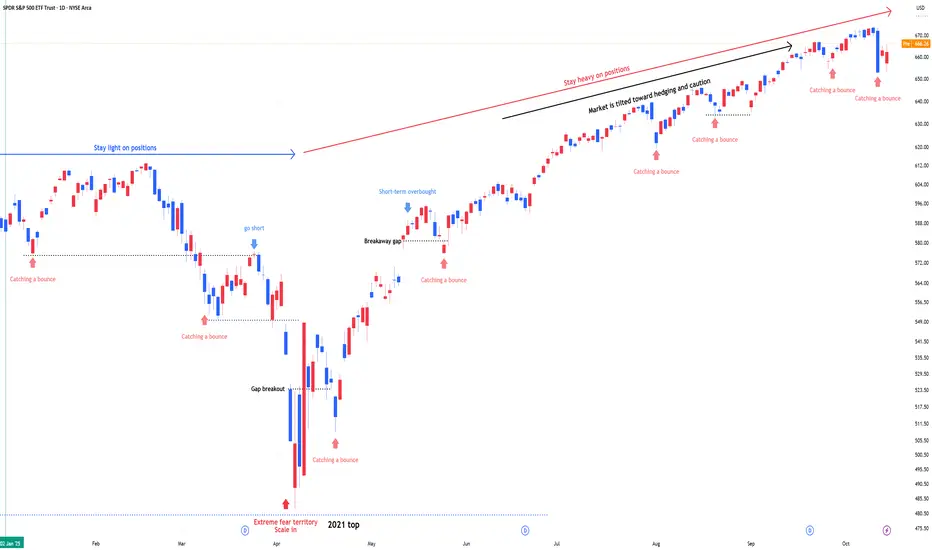
SPY : Stay heavy on positionsSPY : Stay heavy on positions (2x leverage)
Entering a risk-on, high-volatility zone.
In stay light on positions zones, I hold SPY(+QQQ) and reduce exposure.
In stay heavy on positions zones, I increase allocation using a mix of SSO(+QLD) and TQQQ.
** This analysis is based solely on the quantification of crowd psychology.
It does not incorporate price action, trading volume, or macroeconomic indicators.
$SPY / $SPX Scenarios — Wednesday, Oct 15, 2025🔮 AMEX:SPY / SP:SPX Scenarios — Wednesday, Oct 15, 2025 🔮
🌍 Market-Moving Headlines
🚩 Growth pulse check: The Empire State Manufacturing Survey kicks off the day — a real-time test of factory sentiment post-summer slowdown.
📘 Fed Beige Book afternoon drop: Key read on regional activity and inflation anecdotes — markets often reposition after release.
💬 Fed parade continues: Bostic, Miran, and Waller keep rate-cut expectations in focus ahead of Thursday’s data risk.
⚠️ Shutdown overhang: Broader data (CPI/PPI/Retail) still paused — traders key off qualitative signals like Beige Book tone.
📊 Key Data & Events (ET)
⏰ 🚩 8:30 AM — Empire State Manufacturing Survey (Oct)
⏰ 12:10 PM — Raphael Bostic (Atlanta Fed) speech
⏰ 12:30 PM — Stephen Miran (Fed Gov) speech
⏰ 1:00 PM — Christopher Waller (Fed Gov) speech
⏰ 🚩 2:00 PM — Fed Beige Book
⚠️ Note: Shutdown continues to delay most federal data releases. Beige Book offers the only official economic snapshot this week — high read-through for inflation, wages, and business conditions.
⚠️ Disclaimer: Educational / informational only — not financial advice.
📌 #trading #stockmarket #SPY #SPX #Fed #BeigeBook #EmpireState #Waller #Bostic #Miran #bonds #yields #inflation #shutdown #economy
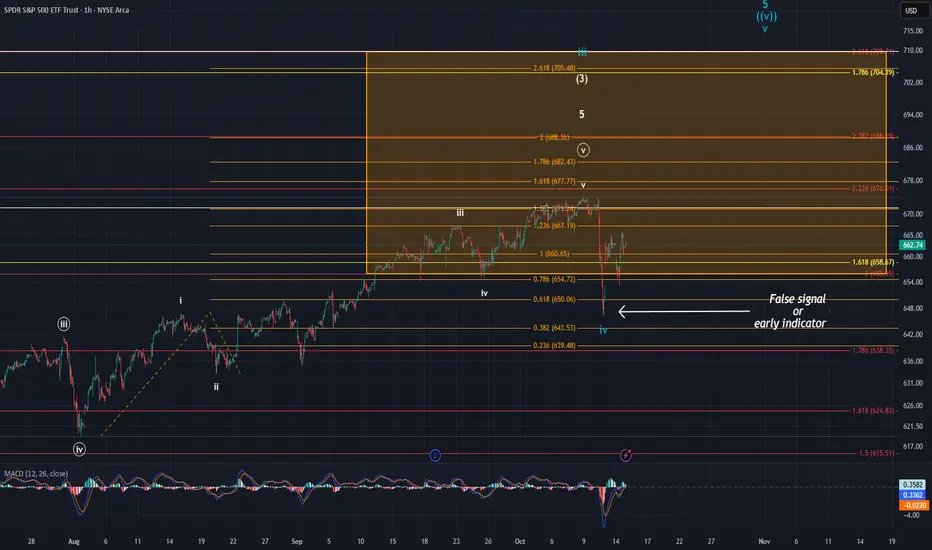
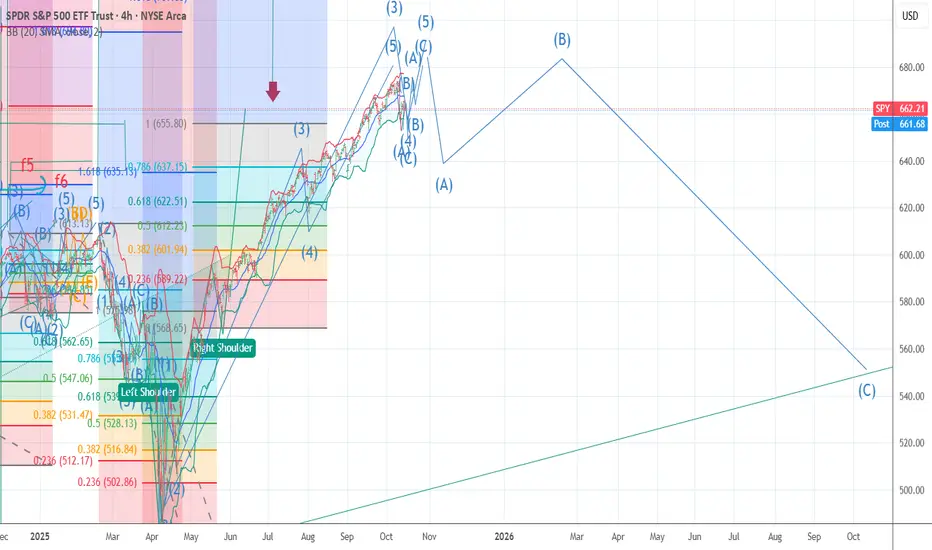
SPYThere is a lot to unpack with SPY. We have been searching for the intermediate wave (3) for some time now. The drop on Friday is what complicated things. I was originally thinking that we needed another wave iv and v to finish off this move higher. In the SPY ETF, however, the drop in price overlapped the wave i high made on 15 August. This would obviously rule out another high being made and would suggest that wave (4) kicked off pointing us lower. When you look at the SPX & ES though, price did not overlap with the wave i high. SPY is a derivative of the S&P and could be sending a false signal. On the flip side of that, it could be an early indicator that the SPX will only get a slight high before kicking off wave (4).
The simplest way I can explain this, is the overlap in SPY could potentially be looked at like an error. If this is the case, then the turquoise labeling on the chart should come to pass and we should ideally see price target the $680 - $710 area. If it is an early indicator that the SPX is all but done, it may not get another high and begin moving lower very soon.
I fall on the false signal side of things personally. I think price is destined to hit the $705-$710 price range to cap off the wave (3). However, every chart stands on their own, and the overlap cannot and should not be overlook and outright dismissed. Time will tell, but either way, I believe this larger move higher is nearing an end.
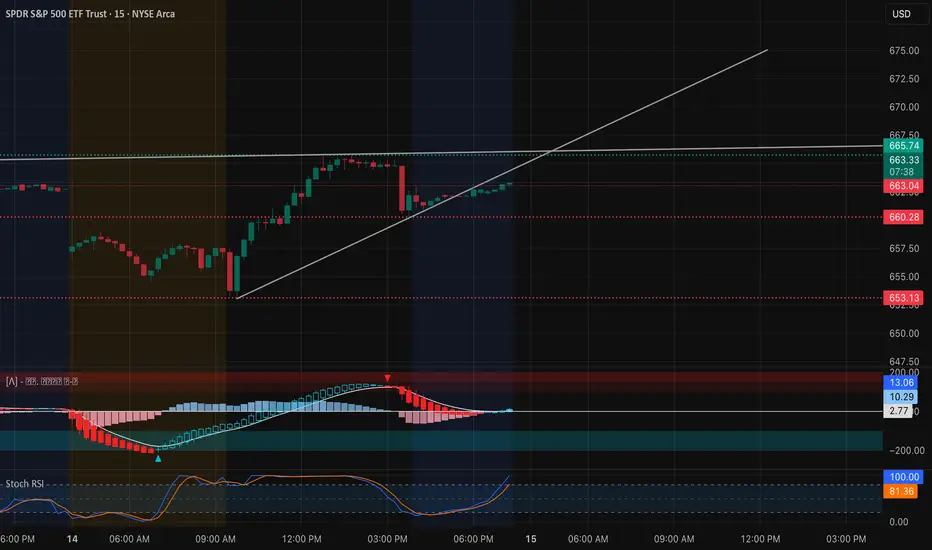
SPY: Key Inflection Point — Bulls or a Trap Ahead?SPY had a clean bullish run early today with consecutive CHoCH → BOS confirmations, pushing toward 665–667 before sellers reacted sharply. That rejection created a fresh CHoCH to the downside while price is now retesting the broken structure near 663–665. The ascending trendline from the morning impulse is still intact, but momentum is fading. MACD histogram shows weakening bullish pressure with a soft cross, and Stoch RSI has cooled from overbought. This suggests indecision before the next leg.
If SPY fails to reclaim 665.7, expect another CHoCH down targeting 660.3 to 658.9.
On the 1-hour chart, we’re seeing a classic compression pattern between 662 and 666. Bulls tried to break 666 twice but met rejection near the 2nd and 3rd Call Walls (670). Volume dropped on each push, confirming supply above. If price loses 662–660, the next liquidity pocket sits near 657 (the highest negative Net GEX zone). Conversely, a clean hourly close above 666 opens 670–672.5 for a possible short squeeze.
GEX and Options Sentiment
The options data reinforces the chart story.
Call walls cluster at 665 and 670, while put walls sit at 660 and 657. GEX remains negative, and dealers appear short gamma below 662 — meaning volatility could expand sharply if price dips.
The Options Oscillator shows PUTs at roughly 103% and IVR around 23%, which indicates hedging and caution heading into macro catalysts.
Dealer positioning hints at a neutral-to-bearish bias unless SPY reclaims 666+ with strength. Below 662, PUT delta hedging could accelerate selling toward 657–655.
Intraday Trading Thoughts
Bullish plan:
If SPY reclaims 665.8 with volume, ride the move toward 667.5–670. Stop below 662.8. Favor short-dated CALLs (0DTE or 1DTE) with momentum confluence.
Bearish plan:
If price breaks and retests 661.8, aim for 658.9 → 657 → 653.1. Stop above 665.5. PUTs with 660 strike for 1DTE or 2DTE fit the structure.
Neutral idea:
If volatility stays muted, an iron condor or credit spread between 660–670 could work, taking advantage of low IVR and likely chop.
Key Context
670–672 is the extreme bullish gamma zone that could trigger a squeeze if volume floods in.
666–667.5 remains the main decision level where either side could take control.
662–660 acts as a pivot — lose it, and momentum flips bearish fast.
657–655 is the magnet if downside accelerates, aligning with deep negative GEX and dealer hedging pressure.
Outlook for Tomorrow
SPY is coiled tightly between 662–666. If we open above 663 and hold over 665 with MACD flipping green again, bulls could attempt a push toward 670. However, another rejection at 665–666 with a CHoCH down on the 15-minute is a clear PUT setup — especially with negative GEX tilt below 662. Expect volatility spikes around 10 a.m. ET when direction confirms.
💬 If you want me to TA any stock I don’t regularly post, DM me and I’ll give it the same deep multi-timeframe + GEX treatment.
Disclaimer: This analysis is for educational purposes only and not financial advice. Trade responsibly and manage your risk.
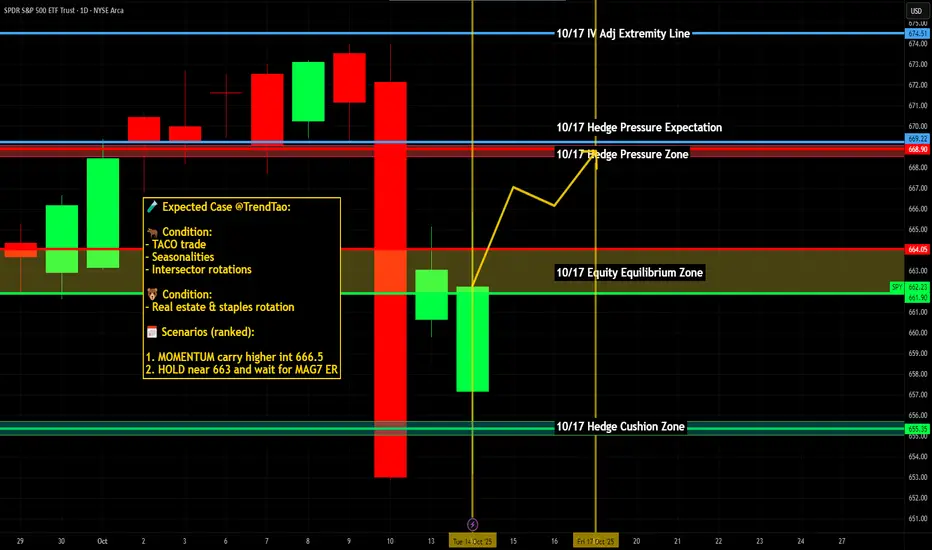
Time for the UPDATE form only !! Well it is time to upload my view since the April 7 low for wave 4 . As most know back on april 7 t=when we were at 4835 I called the bottom is in , the drop of 1312 sp points matched the 2022 drop in wave 2 and that the drop on a PCT basis was exactly .786 as well . I have also stated that this top will be similar to 11/29 /12/6 to 2/18/19 topping so far so good . the low at 6551 was .618 of wave 2 and now we have a e 3 wave rally in the form of an ABC up into .618 . . i think we will see a new record rather soon . in fact odds are high by friday close. but I see rotation and still see the mag 7 leading us into that last pop . I have traded in and out and made some ok $ . . I will now tell you they are going to look to chop up alot of traders in the next 2 weeks .
Warning Signs Flashing: SPY May Plunge After Earnings SeasonAfter the recent rollercoaster in equities and crypto, markets are entering a critical period: earnings season. While the initial rebound after last Friday’s selloff has restored some optimism, the broader picture suggests potential downside for SPY in the weeks ahead.
Earnings Season: A Stress Test for Stocks
The third-quarter earnings season kicks off with major banks and tech companies reporting this week. Expectations are high: analysts project around 8% EPS growth for S&P 500 constituents.
However, several factors indicate that this season could reveal underlying weaknesses:
High expectations and valuation pressure – Companies that fail to meet earnings or guidance could see outsized declines, creating ripple effects across the index.
Sectoral stress – Technology, finance, and industrials are exposed to higher input costs, slowing consumer demand, and margin compression. Misses in these sectors often drive SPY lower more than average.
Macro headwinds – High interest rates, slowing GDP growth, and trade tensions with China could exacerbate negative reactions.
Historically, SPY tends to be vulnerable after earnings seasons that reveal cracks in corporate performance, especially when macro uncertainty is elevated.
Geopolitical and Macroeconomic Pressures
Trade tensions: The U.S.-China conflict over rare earth metals and tariffs adds uncertainty to corporate supply chains. Even if earnings beat expectations, investor sentiment can remain fragile.
Recession risk: Economists from J.P. Morgan and S&P Global highlight a 30–40% chance of a U.S. recession by year-end 2025. Weak economic indicators can amplify post-earnings selloffs.
Volatility spikes: The VIX has started creeping higher after last week’s recovery, signaling that investors are hedging against downside risks. Historically, spikes in VIX correlate with short-term SPY declines.
Conclusion: Post-Earnings Risk for SPY
Traders and investors should watch for:
Missed earnings or cautious guidance from major banks and tech companies.
Rising VIX and fear-driven flows into protective options.
Breaks of critical technical support levels in SPY.
In this environment, positioning for a modest correction or increased volatility in SPY could be prudent until the earnings season clears and market sentiment stabilizes.
$SPY / $SPX Scenarios — Tuesday, Oct 14, 2025🔮 AMEX:SPY / SP:SPX Scenarios — Tuesday, Oct 14, 2025 🔮
🌍 Market-Moving Headlines
🚩 Powell returns: The Fed Chair’s midday remarks anchor Tuesday — traders watch tone shifts after a light Columbus Day tape.
💬 Fed-heavy lineup: Bowman, Waller, and Collins fill out the day — policymaker divergence could move yields and risk assets.
📈 Small biz sentiment: NFIB optimism opens the day, giving early insight into Main Street labor and inflation pressures.
⚠️ Shutdown overhang: Broader data flow still limited — markets key off Fed speak and earnings momentum.
📊 Key Data & Events (ET)
⏰ 6:00 AM — NFIB Small Business Optimism (Sept)
⏰ 8:45 AM — Michelle Bowman (Fed Gov) speech
⏰ 🚩 12:20 PM — Fed Chair Jerome Powell speech
⏰ 3:25 PM — Christopher Waller (Fed Gov) speech
⏰ 3:30 PM — Susan Collins (Boston Fed) speech
⚠️ Note: No high-tier macro data releases due to shutdown effects — Fed communication and earnings dominate the tape.
⚠️ Disclaimer: Educational / informational only — not financial advice.
📌 #trading #stockmarket #SPY #SPX #Powell #Fed #Waller #Bowman #Collins #NFIB #yields #bonds #shutdown #economy #megacaps
SPY 2010 Flash CrashJust for peoples reference, on May 6, 2010 there was a flash crash. The dynamics may be helpful for today.

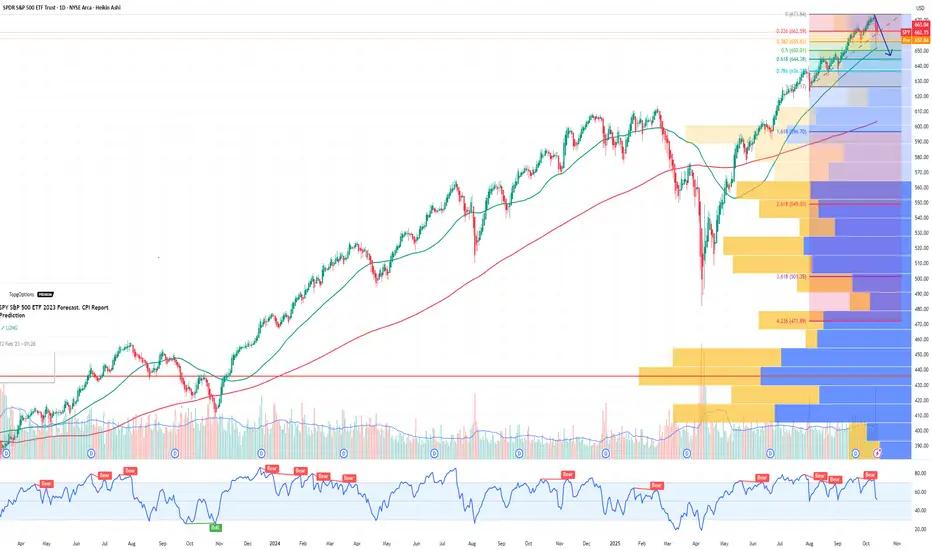
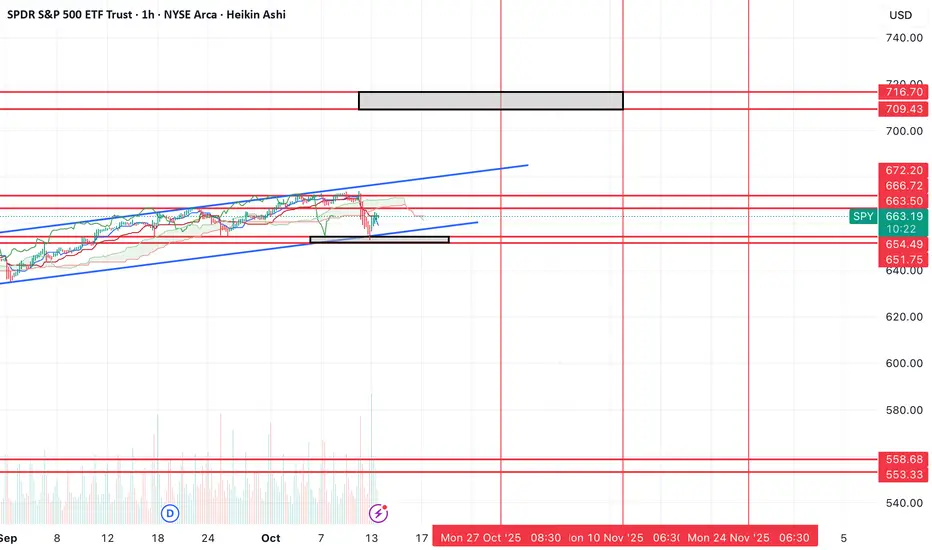
$SPY over $700 in the next ~2 weeks? A 9% move from low?Now that the downside target in SPY hit last week, I think it's time for the blow off top to take place.
I favor a move from here that brings us to the two upper resistance levels.
The next key date that I have on the chart is October 27th, as of now, I think it's possible that we see at least one of the two levels to the upside get hit prior to that for a final move in SPY.
The marked box is the resistance level and I don't really see price exceeding those levels.
If those levels are tagged, then I think that sets up a move lower to the bottom supports, but let's focus on the upside first.
The Market Crash Friday was NOT what you have been told.The stock market crash was blamed on many things but NONE are true.
The reason why the stock market had a huge run down on Friday was due to
a VOID of BUYERS.
Who were the buyers???
You will never guess.
It was the 436 of the SP 500 companies that have buybacks underway, newly created, or open ended. Corporations have been supporting their own individual stock price.
WHY? To maintain their Market Cap during stressed market times.
To improve their dividend yield for the Buy Side Institutions who many 145 trillion dollars of assets and who own the bulk of those companies stock.
To keep their stock from dropping further on retail news.
Why did the corporations stop buying their stock on Friday?
Because the Earnings Season is getting underway this week and they stop buybacks to avoid a conflict of interest or other regulatory situations from buyin back shares during or before their CEO reports.
The corporations are likely to resume their accumulation a week or so after their CEO guidance and reports.

Cash is a positionSPY looks like it may test it's 18ma at 665, if it gets over the 18ma again - it's bullish. There may be some false downmoves before a further upmove, so you have to be careful either way. Gold may be topping very soon.
