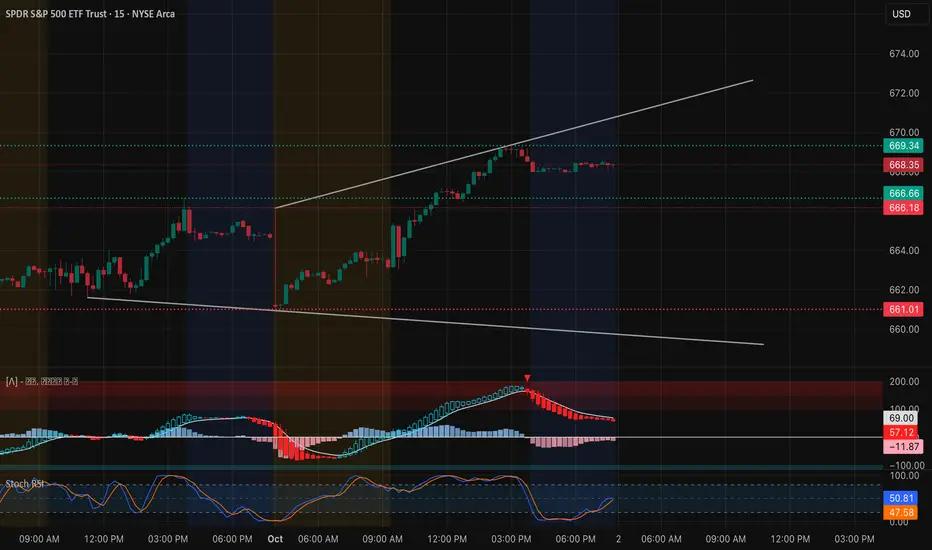
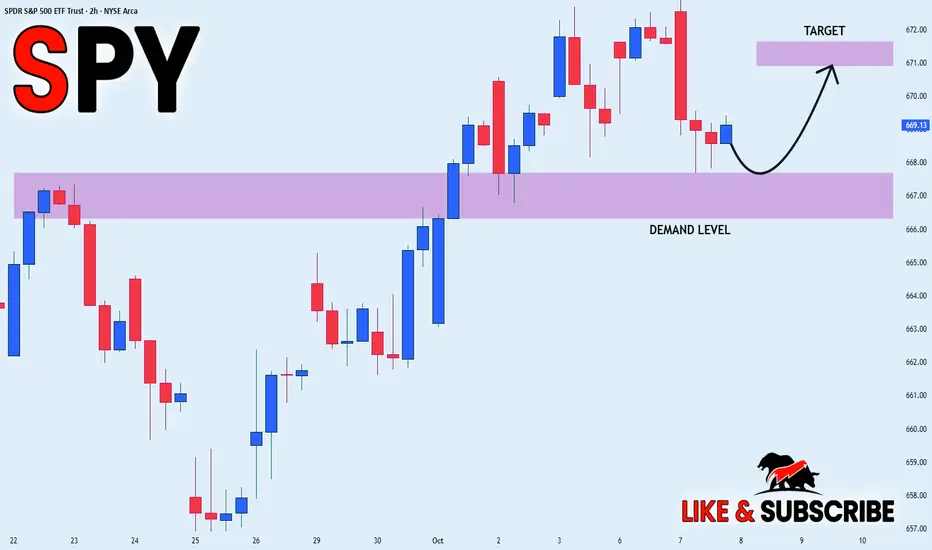
SPY STRONG UPTREND|LONG|
✅SPY showing a strong bullish structure with clear rejections from the demand level. Price continues to form higher lows, confirming institutional support and momentum toward the 671$ target zone. Time Frame 2H.
LONG🚀
✅Like and subscribe to never miss a new idea!✅
Trade ideas
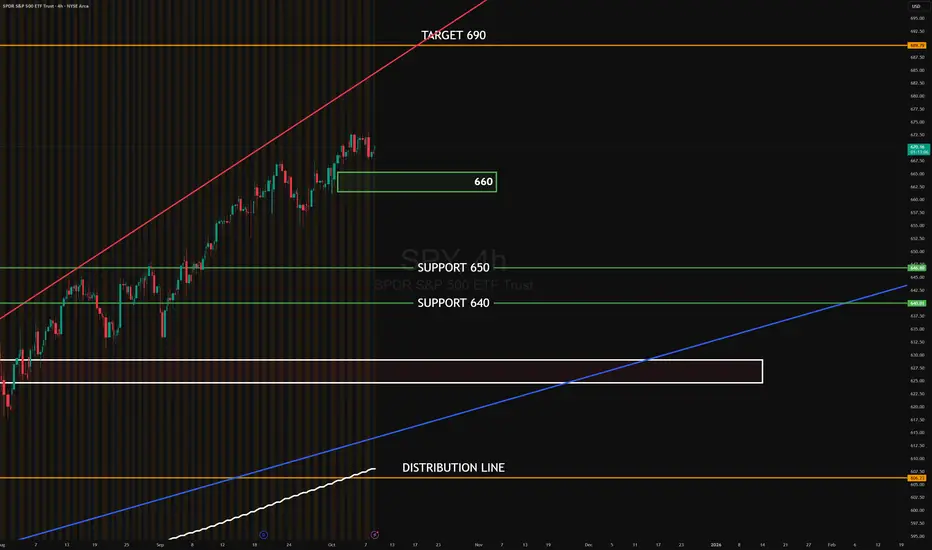
SPY OCT 2025SPY 4H — After the latest push, price is pausing below recent highs. Buyers keep absorbing dips into 660, while sellers are distributing near 675–680. Above 660, the structure still favors continuation toward the upper channel.
Target to the upside: 690
Target to the downside: 660 first; if lost, 650 → 640
#SPY #globaltrade #investment #investing #stockmarket #wealth #realestate #markets #economy #finance #money #forex #trading #price #business #currency #blockchain #crypto #cryptocurrency #airdrop #btc #ethereum #ico #altcoin #cryptonews #Bitcoin #ipo
$SPY / $SPX Scenarios — Wednesday, Oct 8, 2025🔮 AMEX:SPY / SP:SPX Scenarios — Wednesday, Oct 8, 2025 🔮
🌍 Market-Moving Headlines
🚩 FOMC Minutes drop: Traders zero in on the Fed’s tone around balance sheet runoff and rate-cut timing clues.
📉 Macro sentiment reset: Bond yields + USD volatility remain key — equities tracking real-rate shifts post-minutes.
💬 Fed chorus continues: Barr, Kashkari, and Goolsbee headline a dense speaker lineup shaping policy narrative.
💻 Tech leadership check: Mega-caps face another liquidity test as macro dominates tape action.
📊 Key Data & Events (ET)
⏰ 9:20 AM — Alberto Musalem (St. Louis Fed) remarks
⏰ 9:30 AM — Michael Barr (Fed Governor) speech
⏰ 🚩 2:00 PM — FOMC Minutes (September Meeting)
⏰ 3:15 PM — Neel Kashkari (Minneapolis Fed) speech
⏰ 5:45 PM — Michael Barr (Fed Governor) remarks
⏰ 7:15 PM — Austan Goolsbee (Chicago Fed) speech
⚠️ Disclaimer: Educational/informational only — not financial advice.
📌 #trading #stockmarket #SPY #SPX #FOMC #Fed #Powell #Barr #Kashkari #Goolsbee #minutes #bonds #Dollar #economy #megacaps

$SPY Near Term Downtrend Confirmed
The Sell signal that we got on Friday was confirmed resistance.
Keep an eye on 671 for resistance / bear call spreads - and look to 30min 200 for support for now

SPY : Stay heavy on positionsSPY : Stay heavy on positions (2x leverage)
Entering a risk-on, high-volatility zone.
In stay light on positions zones, I hold SPY(+QQQ) and reduce exposure.
In stay heavy on positions zones, I increase allocation using a mix of SSO(+QLD) and TQQQ.
** This analysis is based solely on the quantification of crowd psychology.
It does not incorporate price action, trading volume, or macroeconomic indicators.

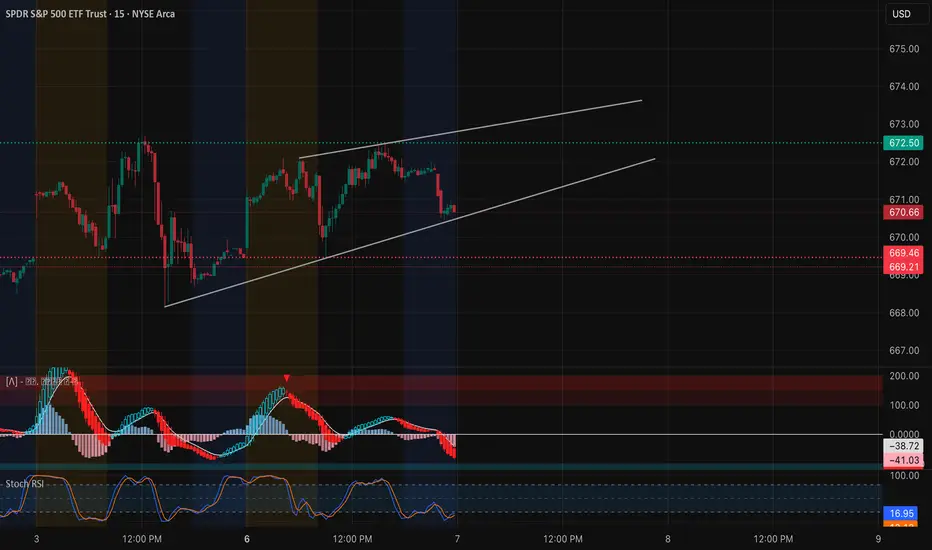
SPY Oct 7 – Bulls Defending the Channel! Watch $672 for Confirm15-Min Chart Analysis (Intraday Trading Setup):
SPY is holding a clean ascending channel structure, consolidating near $670.66 after a mild pullback from the upper resistance zone around $672.50. This intraday pattern shows controlled bullish momentum with shallow retracements — a healthy signal for trend continuation if buyers hold the lower channel.
The MACD is cooling off with red histogram bars, indicating a short-term correction phase rather than full reversal. Stoch RSI near 17 suggests oversold territory, implying potential for a bounce from lower trendline support around $669–$670.
If SPY defends $669, it sets up a possible intraday rebound toward $672.50–$674.00. A breakout above $674 could trigger momentum buying toward $676–$678, completing the next leg of the channel.
However, if SPY loses $668 with volume, it may retest $665–$664 where the next liquidity and minor gamma support reside.
1-Hour GEX Confirmation (Options Sentiment Insight):
The 1-hour GEX landscape reinforces this short-term bullish bias:
* Highest positive NETGEX / CALL wall sits at $674–$675, forming a strong gamma magnet above current price.
* Major PUT walls are clustered around $664–$665, providing sturdy downside defense.
* GEX distribution shows balanced positioning, with dealer exposure slightly net positive, suggesting controlled bullish momentum and lower volatility.
This alignment indicates a likely range expansion to the upside if SPY maintains the $669–$670 base. The gamma structure continues to compress volatility while gradually pulling price toward the $674–$675 region.
My Thoughts:
SPY remains technically constructive above $669, with buyers absorbing every minor dip inside the rising channel. The setup favors a continuation play rather than breakdown — unless there’s a high-volume rejection at $672.
A sustained reclaim above $672.50 would signal that bulls are ready to retest the gamma magnet zone at $674–$675. Conversely, breaking below $668 would be the first warning of weakness, especially if accompanied by rising volume and a MACD crossover.
Momentum and gamma both point to a slightly bullish-to-neutral environment — ideal for disciplined scalps and controlled call positions rather than aggressive swings.
Options Outlook (Oct 7–11):
* Bullish setup: Consider 672C or 675C (Oct 11 expiry) if price holds above $670 and reclaims $672.50 with bullish momentum.
* Bearish setup: Consider 668P if SPY breaks below $668 with confirmed volume spike and MACD crossover.
* IV insight: IVR 15.4, IVx 13.9 — both low, making options relatively cheap for directional trades this week.
Conclusion:
SPY’s trend remains orderly and bullish as long as $669 holds. Watch for a breakout above $672.50 to confirm a run toward $674–$676, with gamma levels acting as the next resistance. A drop below $668 would flip sentiment short-term bearish. Stay patient and let price action confirm the breakout direction.
Disclaimer: This analysis is for educational purposes only and does not constitute financial advice. Always do your own research and manage your risk before trading.
$SPY / $SPX Scenarios — Tuesday, Oct 7, 2025🔮 AMEX:SPY / SP:SPX Scenarios — Tuesday, Oct 7, 2025 🔮
🌍 Market-Moving Headlines
🚩 Shutdown overhang: The U.S. Trade Deficit release remains at risk; traders lean on Fed commentary for macro tone.
📉 Rates + dollar watch: Treasury yields stay elevated ahead of FOMC Minutes (Wed); AMEX:SPY sensitivity to TVC:DXY remains high.
💬 Fed parade: Five speakers on deck — market parsing for any shift in post-Powell narrative.
💻 Tech + liquidity: $AAPL/ NASDAQ:MSFT flows continue driving AMEX:XLK rotation amid tightening liquidity backdrop.
📊 Key Data & Events (ET)
⏰ 🚩 8:30 AM — U.S. Trade Deficit (Aug)
⏰ 10:00 AM — Raphael Bostic (Atlanta Fed) speech
⏰ 10:05 AM — Michelle Bowman (Fed Vice Chair for Supervision) remarks
⏰ 10:45 AM — Stephen Miran (Fed Governor) speech
⏰ 11:30 AM — Neel Kashkari (Minneapolis Fed) speech
⏰ 3:00 PM — Consumer Credit (Aug)
⚠️ Disclaimer: Educational/informational only — not financial advice.
📌 #trading #stockmarket #SPY #SPX #Fed #Powell #Bostic #Bowman #Kashkari #Miran #tradebalance #shutdown #bonds #Dollar #megacaps #economy
October 6 - October 10 2025For this week, my bias is neutral/leaning bearish, however I will not fight the trend if my technical indicators give clear bullish signals. I believe the government will stay shut down for a while, as both parties are at an impasse and the administration will use the shutdown as an opportunity to advance its agenda against the federal workforce and non-aligned spending programs, rather than make concessions early on. Unless the opposition is willing to abandon its position with little to no gain, the possibility of this ending soon remains low in my view. Official economic data is currently on hold, so for the time being the stock market is operating with little fundamental basis and as a result, technicals could carry more weight.
1. Macro
Data from the Federal Reserve is currently delayed or on an indefinite hold, making the Real Yield of bonds ambiguous. Regardless, not much has changed since last week. The Dollar is starting out slightly above average but still flat - which should continue since there will be no policy changes or inflation data during the shutdown.
Yields have remained relatively flat but the 10Y yield is rising at a faster pace than the 3M yield, which can be seen on the bottom left chart that shows the spread. I’m not reading into the technicals too much here, however it will be important to see if this makes a higher high (spread widening, 10Y rising and/or 3M falling) or a lower low (spread tightening/inverting). Neither would be a particularly good sign but the former would likely be better received than the latter when it comes to stocks. As with the dollar, I think yields will remain relatively flat for the same reasons, which will prevent bond-market moves from being a driver.
My sentiment on commodities is roughly the same. Gold continues to rally, Oil may be in a downtrend, Copper ripped higher, and Corn stayed flat. Aside from Gold, I do not see anything on the charts of these commodities to provide a clear indication of a change in the growth or inflation outlook.
2. FX
Nothing new and worthy of note here. Yield spreads in the US and Britain (Black, Red) remain tight compared to elsewhere, but the higher yield may be a tailwind keeping the dollar steady. Over the past three months, the dollar has performed sightly better proportionately compared to other currencies, however it is still down significantly on the Year.
3. Risk
The top left chart is the option-adjusted spread of High Yield and Investment Grade corporate bonds indexed to 100. I’m not seeing an upside movement developing here yet (risk-off signal). On the middle chart, S&P Futures continue to significantly underperform Gold, fueled by the Gold rally and S&P making incremental gains. On the top right, I am starting to track the $NQ1!/YM1! spread to see how the mega caps are performing against companies in more traditional industries. Here it is clear that ever since the market bottomed in April, Nasdaq has been significantly outperforming the Dow Jones, however it appears this spread is set to tighten - either by Dow rising while Nasdaq stays flat/falls or Nasdaq falling proportionately more than Dow.
Notice how the Nasdaq/Dow curve started to flatten around the same time that Gold started to significantly outperform the S&P. I think this is an indicator that growth stocks will see pressure in the near future, and that we may currently be seeing rotation into safer sectors . This is evident in the outperformance of Industrials, Financials, Healthcare, and Utilities compared to growth sectors like Tech last week.
4. Options Chain
Gamma flip-flopped last week, making options data a misleading indicator unless you’re really in the know. With little fundamental backing, I expect dealers will assert more control than what is typical. Friday ended with most of the calls on volume getting taken out while paying some puts. Heading into this week, gamma on AMEX:SPY should keep the price from rising above $672 or falling below $665 on Monday .
5. Bias
I’m going to split these screenshots up to make it easier to see what I’m looking at.
On my technical indicator chart, last week’s Weekly CVD (black) did not see a strong directional movement, although it remained below the zero line for most of the week, suggesting order flow favored the sell side despite the price reaching new ATHs.
Anchored OBV also suggests that last week was a battle between both sides.
Line break is great as a momentum indicator and has been flipping between both sides since October 1st. CME_MINI:ES1! will need to make a new ATH and break above the resistance and close on the 1h timeframe to print a bullish bar, so right now I think the momentum is more to the downside.
On Renko, which is my main chart, taking a purely technical read using the Wyckoff Method, I think this structure is bullish overall unless we see a swift move to the bottom of the range. Otherwise, it is fairly likely that we will at least see a pull back into the range. VWAP is set to Monthly to show we’re still above but could see a trend shift in the monthly frame of reference by breaking below it. How the price respects this range will be important to watch.
Lastly, when looking at the 4h chart on VIX, it appears to be coiling although it has remained mostly flat. VIX is outperforming its on volatility and the volatility of bonds, suggesting that any spikes are not part of larger risk-off positioning yet.
——————
My overall interpretation for this week is that although the Macro side remains roughly unchanged, I still retain my bias that the market is positioning for disappointing growth and clearly continues to show a preference for gold over stocks (heavy hedging). The absence of data reports due to the shutdown that could have validated these concerns (notably payrolls) have allowed dealers to assert more control over the price. For this reason, I will keep a close eye out for any changes and will adjust if the technicals on my Bias chart support a bullish position, but for now my near-term short target is to move back down to $666 .
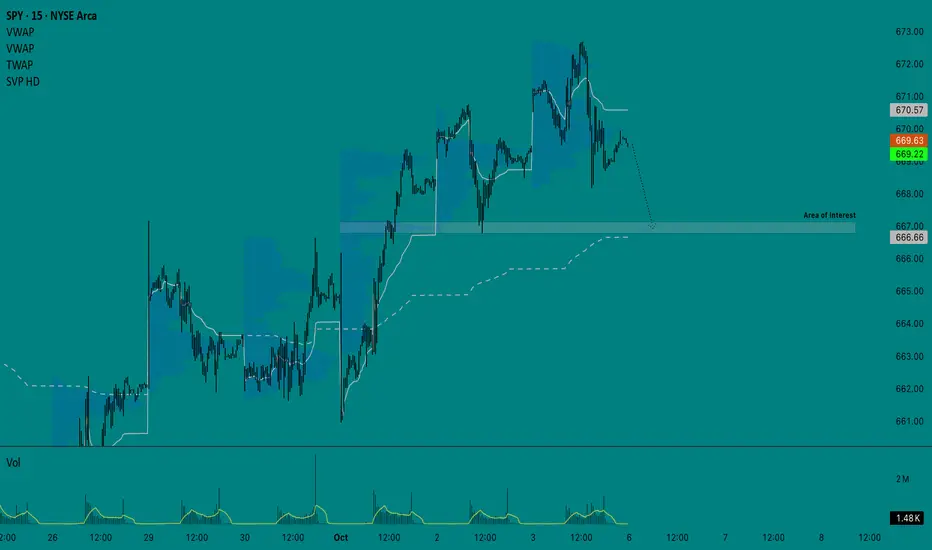
SPY Coiling Below Gamma Wall — Volatility Loading Into Oct. 6 Market Overview (15-Min Chart)
SPY finished Friday consolidating within a tight descending channel after a strong early session rejection from $672.60–$673, forming a potential bullish flag structure. Price action shows a short-term base developing near $669, with visible liquidity defense and lower wicks suggesting buyers are absorbing pressure.
The MACD histogram is starting to flatten after a deep red phase, while both MACD lines are curling upward — a subtle momentum shift hinting at possible recovery attempts early in the session. Meanwhile, the Stoch RSI is elevated, indicating SPY may attempt another push toward the upper trendline before confirming direction.
This setup paints a picture of compression after expansion, with price resting right below key gamma resistance — a classic sign that the next impulse move could define the week’s tone.
GEX Confirmation (1H Chart Insight)
The 1-hour Gamma Exposure (GEX) data adds crucial institutional context: the highest positive NET GEX and CALL resistance sits near $672–$673, precisely where SPY faced rejection. This confirms that dealers are currently hedging defensively, making that zone a strong ceiling unless sustained volume breaks through.
Below, the PUT support wall is dense between $666–$667, marking the key gamma floor. Dealers’ short gamma positioning means a sharp move below could trigger delta-hedge selling, accelerating volatility.
With IVR at 15.8 and IVX avg 13.6, implied volatility remains low — signaling a potential volatility expansion ahead. Notably, PUT positioning at 64.2% suggests sentiment is still cautious, but this imbalance could amplify a short-cover rally if bulls reclaim momentum above $670.
Trade Scenarios for the Week (Oct. 6–11)
Bullish Case:
If SPY breaks and sustains above $671, it may unlock a clean run toward $673.20 and potentially $676, where the 3rd Call Wall aligns.
* Entry: Above 671
* Target 1: 673.2
* Target 2: 676
* Stop-Loss: Below 668
Bearish Case:
If SPY fails to reclaim 671 and breaks below $667, the path opens toward $665, the next major gamma pocket. Watch for accelerated selling if that level gives way.
* Entry: Below 667
* Target 1: 665
* Target 2: 662
* Stop-Loss: Above 670
Option Insights
The GEX structure shows compression between 667–672, signaling that SPY is coiling before a breakout. With PUT dominance, a short squeeze scenario becomes possible if price holds above $670 and dealers unwind short delta exposure.
Traders could look at call spreads (671–676) for upside momentum confirmation or put spreads (667–662) if downside pressure persists. The low IVR supports directional debit plays with defined risk.
My Thoughts
SPY is sitting at the crossroads of gamma and structure. The $669–$672 zone defines this week’s battlefield — a breakout above could spark a quick volatility pop toward $676+, while a rejection and break below $667 reopens the path to $665 support.
Momentum indicators are neutralizing, suggesting a larger move is imminent. I’ll be watching Monday’s open for a decisive candle: a clean break outside the channel will likely set the trend for the rest of the week.
This is one of those “calm-before-the-storm” setups where positioning and timing will matter more than prediction.
Disclaimer:
This analysis is for educational purposes only and does not constitute financial advice. Always perform your own due diligence and manage risk responsibly before trading.

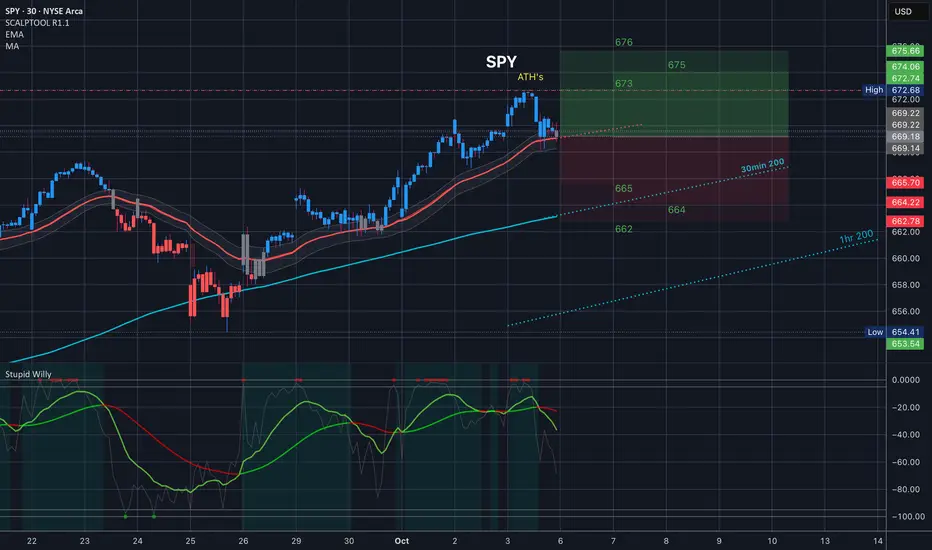
$SPY Tomorrow's Trading range 10.6.25
We closed right at the 35EMA so that is righ in the middle and will be a key level. 30min 200MA is just underneath the bottom of the implied move so if for whatever reason we come near it look to it as a support to pop us back into the implies move. And of course above us we have ATH's.
Just .5% implied tomorrow so don't get crazy...
SPY – Liquidity Flow & Macro Context🧭 SPY – Liquidity Flow & Macro Context
Bias: Cautiously Bullish | VolanX DSS
SPY continues to respect the ascending channel — structure intact.
Each pullback toward the midline (660–654) offers liquidity-based entries within a healthy bullish trend.
Volume Context:
Rising volume confirms participation during expansions, while pullbacks show lighter volume → suggesting absorption, not reversal.
Macro Alignment:
Fed remains dovish 🕊️ → easing bias supports risk assets
U.S. government shutdown adds noise but hasn’t broken liquidity confidence
Rate-cut expectations remain elevated
Global rotation favoring Tech + Pharma → underpins SPY strength
Technical Map:
Support: 660 / 654
Pivot Zone: 667–675
Target 1: 688.5
Target 2: 701.5 (extended Fibonacci confluence)
Strategy:
Wait for controlled pullback into 660–654 liquidity zone → monitor volume fade & RSI reset → re-enter for next expansion leg.
💡 Any healthy pullback = opportunity, not exit.
#SPY #VolanX #Liquidity #SMC #Macro #BuyTheDip #Fed #TradingView #VolumeProfile

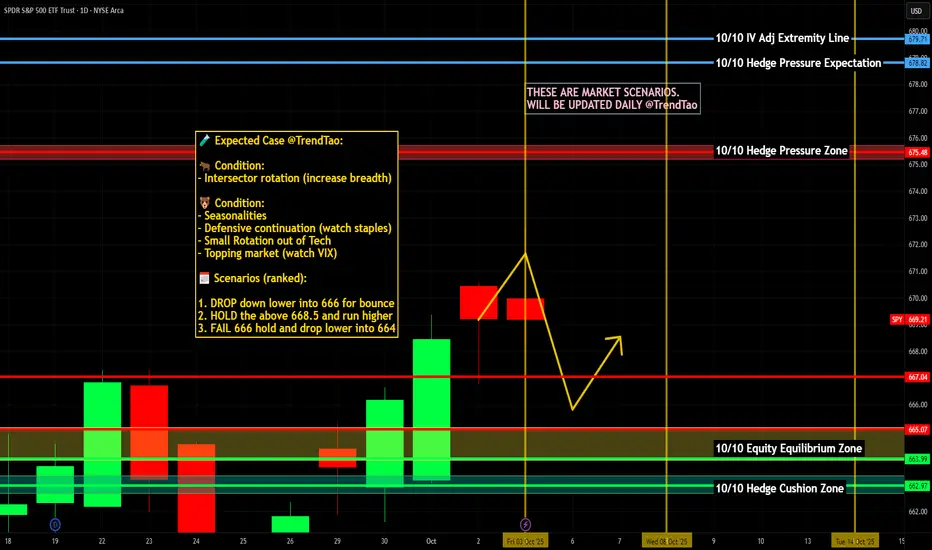
$SPY / $SPX Scenarios — Week of Oct 6 → Oct 10, 2025 🔮 AMEX:SPY / SP:SPX Scenarios — Week of Oct 6 → Oct 10, 2025 🔮
🌍 Market-Moving Headlines
🚩 Shutdown overhang: Some data (Trade, Jobless Claims, Budget) remain at risk of delay; markets lean on Fed tone instead.
📉 Fed-heavy week: Nearly every regional president and governor is on deck — tone from Powell (Thu) + FOMC Minutes (Wed) = the core catalyst.
💻 Earnings prep: Q3 pre-announcements begin — NASDAQ:AAPL NASDAQ:MSFT NASDAQ:NVDA remain leadership barometers.
💵 Rates & positioning: 10Y yields and USD remain key drivers into mid-month CPI/PPI stretch.
📊 Key Data & Events (ET)
Mon 10/6
⏰ 5:00 PM — Jeff Schmid (Kansas City Fed) speech
Tue 10/7
⏰ 🚩 8:30 AM — U.S. Trade Deficit (Aug)
⏰ 3:00 PM — Consumer Credit (Aug)
🗣️ Fed Speakers — Bostic (10:00), Bowman (10:05, 8:35, 8:45), Miran (10:45, 4:05), Kashkari (11:30)
Wed 10/8
⏰ 🚩 2:00 PM — FOMC Minutes (September Meeting)
🗣️ Fed Speakers — Musalem (9:20), Barr (9:30, 5:45), Kashkari (3:15), Goolsbee (7:15)
Thu 10/9
⏰ 🚩 8:30 AM — Initial Jobless Claims (Oct 4)
⏰ 🚩 8:30 AM — Fed Chair Powell remarks (opening keynote)
⏰ 10:00 AM — Wholesale Inventories (Aug)
🗣️ Fed Speakers — Bowman (8:35, 8:45, 3:45), Kashkari + Barr (12:45), Daly (4:10, 9:40 PM)
Fri 10/10
⏰ 🚩 10:00 AM — Consumer Sentiment (Prelim, Oct)
⏰ 2:00 PM — U.S. Federal Budget (Sept)
🗣️ Fed Speakers — Goolsbee (9:45)
⚠️ Disclaimer: Educational/informational only — not financial advice.
📌 #trading #stockmarket #SPY #SPX #Powell #FOMC #Fed #joblessclaims #tradebalance #consumerconfidence #shutdown #bonds #Dollar #megacaps #economy
Stock Market Forecast | TSLA NVDA AAPL AMZN META MSFTStock Market Forecast | CME_MINI:NQ1! SP:SPX NASDAQ:NDX CME_MINI:ES1!
Mag 7 | TSLA NVDA AAPL AMZN META MSFT GOOGL

SPY Buyers In Panic! SELL!
My dear subscribers,
My technical analysis for SPY is below:
The price is coiling around a solid key level - 669.20
Bias - Bearish
Technical Indicators: Pivot Points Low anticipates a potential price reversal.
Super trend shows a clear sell, giving a perfect indicators' convergence.
Goal - 663.47
About Used Indicators:
By the very nature of the supertrend indicator, it offers firm support and resistance levels for traders to enter and exit trades. Additionally, it also provides signals for setting stop losses
Disclosure: I am part of Trade Nation's Influencer program and receive a monthly fee for using their TradingView charts in my analysis.
———————————
WISH YOU ALL LUCK

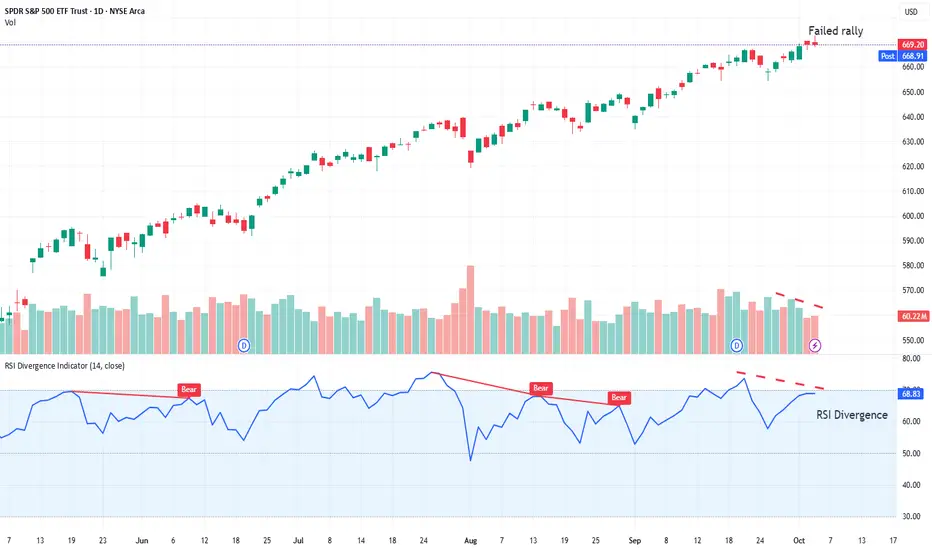
Bulls less confident, Weak setup for next weekRSI divergence with new highs. QQQ looks even worse. This is a weak setup for next week. Looks for a sell-off, unless some miracle happens.
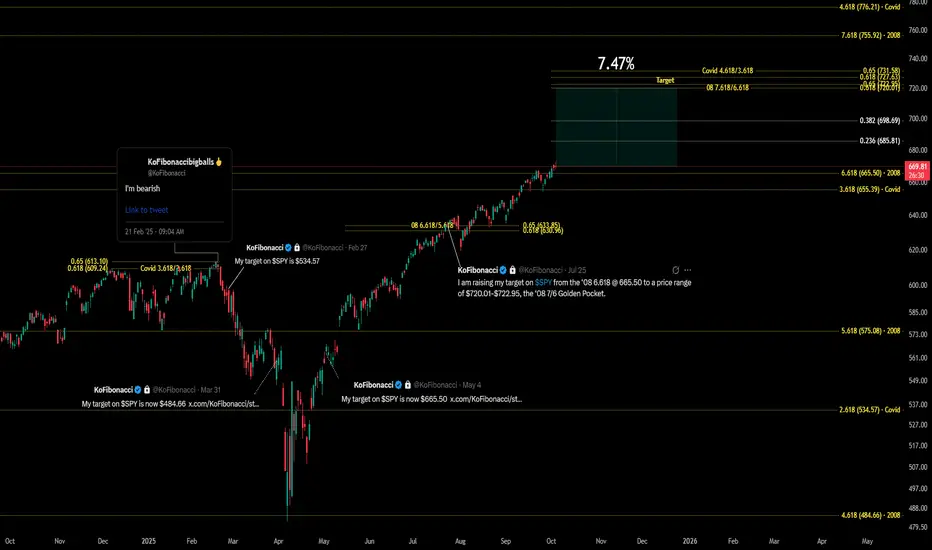
So complex, yet so simple. Only about 7.5% to go. $SPYAMEX:SPY Daily Historical Golden Ratio (9/24-Present)
SPY on daily - trend still up but with fading volumeShows anchored vwap from April Lows around ~600 and has a gap on the same price.
SPY Currently at the lows of April channel and slightly outside.
I have also added volume profile to show where SPY bounced from the thick volume around 635.
If you want more finer charts like these with channels and vwaps / volume profile and at 3 different timeframes then message me on X - vickg81.
Spy idea This disgrace will not go much higher 675 680 at most near resistance , huge Macd divergence . no economic data for the next two weeks . Market is going up on nothing rate cuts priced in already . I expect the market to correct soon and very quickly . Not an advice
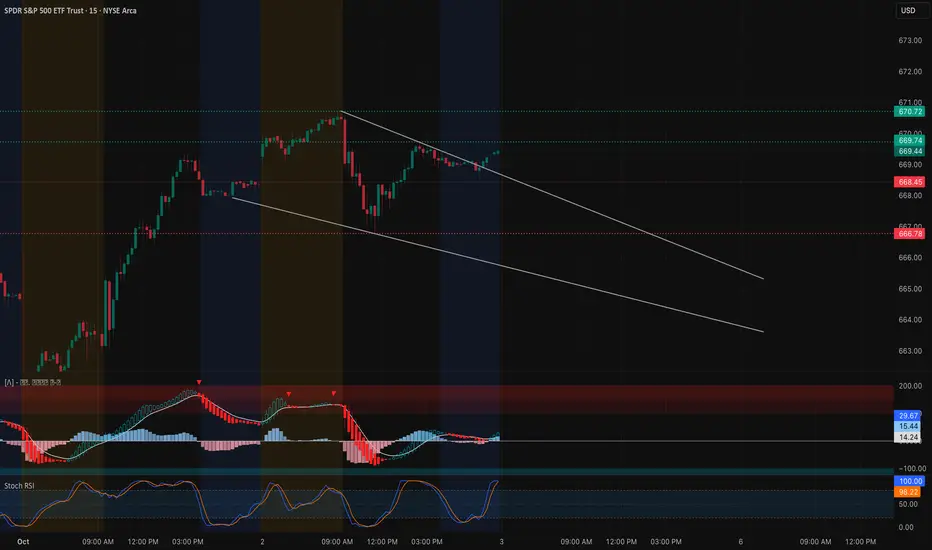
SPY Coiling Before the Move – Gamma Walls Set the Stage - Oct3 Intraday Technical Outlook (15m Chart)
SPY closed near $669.44, consolidating inside a falling wedge pattern. On the 15-minute chart, price is testing downtrend resistance after holding support earlier in the session:
* MACD: Curling back upward from bearish territory, hinting at momentum recovery.
* Stoch RSI: Back at extreme overbought, suggesting buyers are active but may face short-term exhaustion.
* Key Levels: Support sits at $668–666.7, with further downside pressure toward $663.2. Resistance sits at $670.7–671.0, the wedge top and breakout zone.
Intraday takeaway: A breakout above $671 could ignite upside momentum toward $673+. Failure to reclaim $670 risks a fade back toward $666–663.
Options Sentiment & GEX Outlook (1H Chart)
Options flow shows dealers are heavily positioned around key gamma levels:
* Gamma Walls:
* $670–673: Major call wall cluster and highest positive GEX — key resistance ceiling.
* $668: Gamma pivot level where dealers may defend.
* $663–660: Heavy put wall zone that can act as a downside magnet if $668 breaks.
* Implications:
* Holding above $668 keeps SPY pinned toward the $670–673 gamma wall.
* Losing $668 could trigger dealer hedging flows to drag price toward $663–660.
* Volatility Context: IVR at 15.7 is very low, while options skew shows 61.7% puts — indicating hedging remains defensive. Cheap premiums may favor straight directional calls/puts instead of spreads.
My Thoughts & Recommendation
For Oct 3 trading, SPY is tightening for a breakout:
* Intraday (scalping/trading): Watch $670–671 closely. A breakout here favors longs into $673+. If SPY rejects at $671 and breaks $668, expect a pullback toward $663.
* Options trading (swing/0DTE): Calls only make sense if SPY clears $671 with conviction. If SPY fails at $670 and breaks $668, puts toward $663–660 offer better risk/reward.
Bias heading into Oct 3: Neutral with breakout watch — $668 support vs $671 resistance will decide.
Disclaimer:
This analysis is for educational purposes only and does not constitute financial advice. Always do your own research and manage risk before trading.
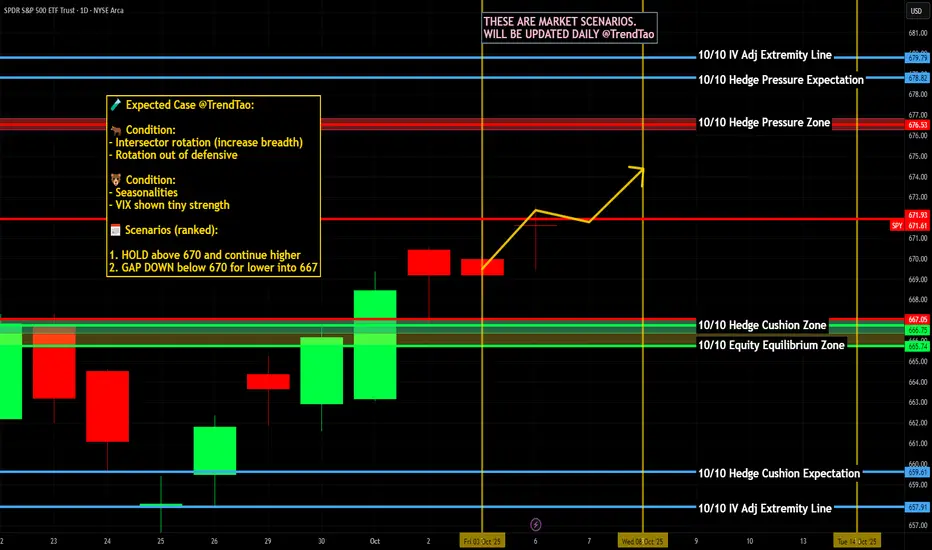
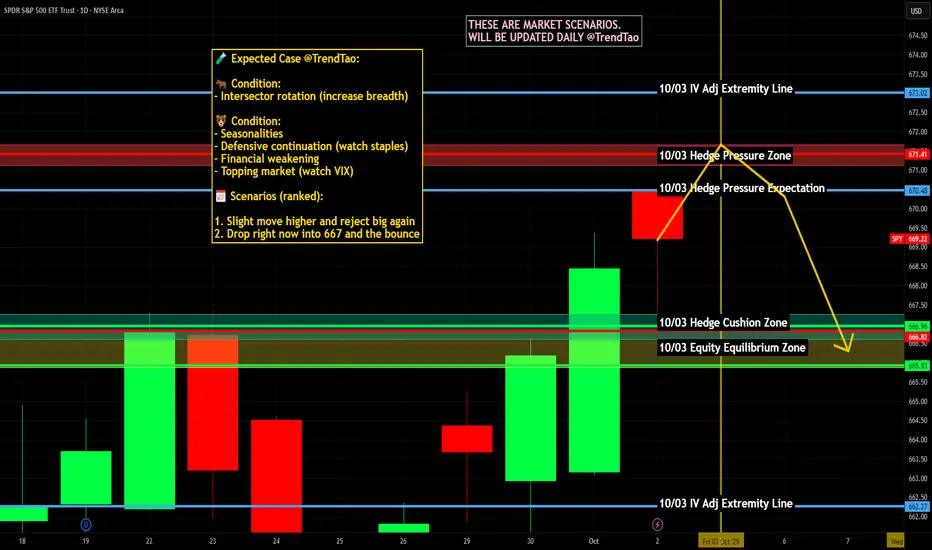
$SPY / $SPX Scenarios — Friday, Oct 3, 2025🔮 AMEX:SPY / SP:SPX Scenarios — Friday, Oct 3, 2025 🔮
🌍 Market-Moving Headlines
🚩 NFP risk — but delayed: September Employment Report, unemployment rate, and wages won’t publish if shutdown continues. Markets will run on positioning + PMIs instead.
📉 Labor vacuum: Absence of NFP could amplify volatility as traders trade on speculation.
💬 Fed-heavy Friday: A parade of Fed speakers guides tone into weekend positioning.
📊 Key Data & Events (ET)
⏰ 6:05 AM — John Williams (NY Fed) speech
⏰ 8:30 AM — Austan Goolsbee (Chicago Fed) TV appearance
🚩 At Risk of Delay (shutdown):
• 8:30 AM — Employment Report (Sep): Nonfarm Payrolls, Unemployment Rate, Avg. Hourly Earnings
✅ Still Publishing:
⏰ 9:45 AM — S&P Final Services PMI (Sep)
⏰ 10:00 AM — ISM Services (Sep)
🗣️ Fed Speakers:
• 9:30 AM — Stephen Miran (Fed Gov, TV)
• 1:30 PM — Lorie Logan (Dallas Fed)
• 1:40 PM — Philip Jefferson (Fed Vice Chair)
• 3:30 PM — Stephen Miran (Fed Gov, TV)
⚠️ Disclaimer: Educational/informational only — not financial advice.
📌 #trading #stockmarket #SPY #SPX #NFP #jobs #Fed #Powell #shutdown #ISM #PMI #bonds #Dollar #economy
Elliott Wave Forecast: SPDR S&P 500 (SPY)’s Path to Record PeaksThe Short-Term Elliott Wave analysis for the SPDR S&P 500 ETF (SPY), starting from August 2, indicates an ongoing impulsive rally. From the August 2 low, the ETF surged in wave ((i)) to 647.04, followed by a dip in wave ((ii)) concluding at 634.92. The ETF then climbed in wave ((iii)) to 667.34. A corrective pullback in wave ((iv)) formed a zigzag Elliott Wave pattern. From the wave ((iii)) peak, wave (a) declined to 661.98, wave (b) rallied to 664.65, and wave (c) dropped to 654.42, completing wave ((iv)).
The ETF has since resumed its upward trajectory in wave ((v)), exhibiting an impulsive structure with internal extensions. From the wave ((iv)) low, wave (i) reached 662.37, and a brief pullback in wave (ii) ended at 657.88. The ETF then nested higher, with wave i peaking at 665.8 and wave ii correcting to 660.93. Wave iii ascended to 670.74, followed by a wave iv pullback to 666.78. As long as the pivot low at 654.42 holds, the ETF should continue its upward momentum in the near term.

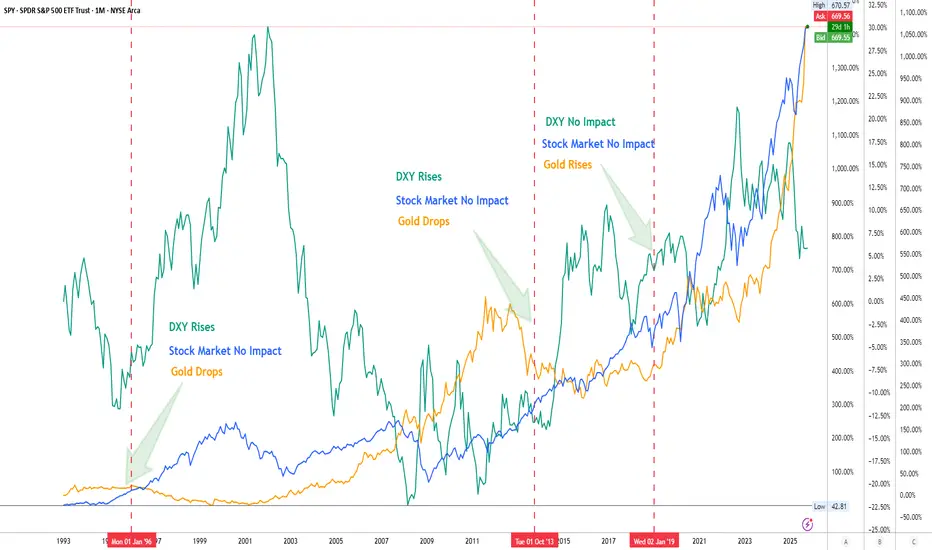
US Gov Shutdowns History: The Real ImpactLooking back at history:
-When DXY tend to rise with or after shutdowns
-Gold often drops while the stock market shows little impact.
Across 1996, 2013 & 2019 shutdowns, SP500 kept climbing, proving markets are more resilient than the headlines suggest.
Takeaway: Shutdowns = volatility noise. Long-term trend = earnings, liquidity, Fed policy.
#SPX #DXY #Gold #Trading #Markets
SPY Stalling at $669 – Gamma Ceiling in Play (Oct 2) Intraday (15-Min Chart)
SPY ripped higher into the 668–669 zone, testing the upper channel before momentum started cooling. On the 15-min chart, MACD has rolled over into red, while Stoch RSI is mid-range after pulling back from overbought.
* Immediate resistance: $669.3 intraday high.
* Support zones: $666.6 first, then $662 (gap fill and prior pivot).
* Upside trigger: A breakout over $669.5 opens the door toward 671–673 intraday.
* Downside risk: Break under $666 could trigger a pullback to $662–660.
Bias intraday: leaning bullish above 666, but momentum is stalling — buyers need to hold the line for continuation.
Options / GEX (1-Hour Chart)
Gamma positioning defines the battlefield clearly.
* Call walls: Heavy resistance at 667–671, with 669 marking the highest positive GEX level. Above 671, dealer hedging could fuel a push into 673+.
* Put walls: Key support sits at 662 and 660, with deeper protection at 655.
* Sentiment: Options flow leans bearish (≈97% puts), showing caution despite the recent rally.
This suggests SPY is pinned into a tight gamma box — 662 support vs 671 resistance. A breakout could fuel volatility, but chop is likely until one side cracks.
My Thoughts
For Oct 2, SPY is at a decision point. Scalps favor longs above 666 targeting 669–671, with tight stops if 666 fails. For option traders, a 668/671 call spread works if momentum carries higher, while a 665/660 put spread hedges downside if resistance holds.
Bias: Neutral to bullish above 666 — but until 671 breaks, SPY is capped by gamma walls.
Disclaimer: This analysis is for educational purposes only and does not constitute financial advice. Always do your own research and manage risk before trading.