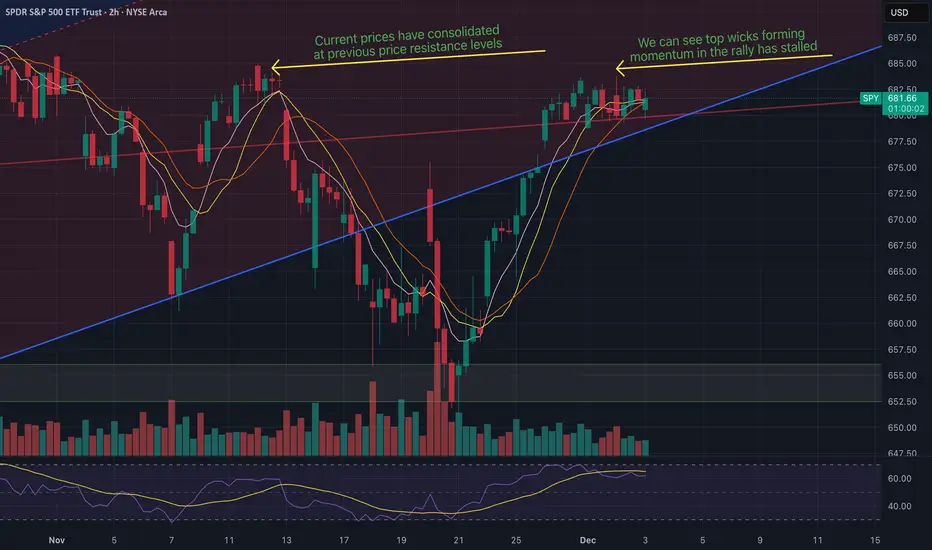
SPY reveals a market at a critical inflection pointA comprehensive multi-timeframe VPA analysis of SPY reveals a market at a critical inflection point, making a 'wait and see' approach the most prudent strategy for a trend trader.
**Weekly Chart (Long-Term View):** The primary trend is clearly bullish, defined by a strong ascending trendline active for several months. However, the price is currently stalling at a major horizontal resistance level around $685. The most recent weekly candle is a spinning top/doji with a prominent upper wick, indicating that supply is emerging at this level and sellers are rejecting higher prices. This is a sign of indecision and potential exhaustion after a long run-up.
**Daily Chart (Medium-Term View):** The daily chart confirms the consolidation below the ~$685 resistance. A key VPA signal is present: the rally from the mid-November low back to this resistance has occurred on noticeably declining volume. This is a classic 'No Demand' signal, suggesting a lack of conviction and participation from professional money to push prices through this supply zone. While the sharp sell-off in mid-November was met with very high 'Stopping Volume' (a sign of professional absorption/accumulation), the subsequent rally lacks the volume signature of strength.
**4-Hour Chart (Short-Term View):** This timeframe shows the price action coiling into an ascending triangle pattern, bounded by the ascending trendline support and the horizontal resistance. While an ascending triangle is typically a bullish continuation pattern, the volume has been diminishing throughout its formation. This confirms the 'No Demand' seen on the daily chart and indicates the market is in equilibrium, awaiting a catalyst.
**Conclusion:** Professional money showed its hand by absorbing the selling pressure in mid-November (bullish background). However, they are now showing a clear lack of interest in buying aggressively at these higher prices, right below significant resistance. The trend is mature and showing signs of weakness. A trend trader should not enter a new long position directly under a major supply level with evidence of 'No Demand'. The risk of a 'false breakout' or a breakdown is elevated. The recommendation is to wait for a decisive move: a high-volume breakout above $686 would signal a continuation and a potential buy entry, while a high-volume breakdown below the ascending trendline (approx. $680) would signal a reversal and a potential sell entry. Until then, the risk/reward is unfavorable.
Trade ideas
Traps are setA move up or down on SPY should not be taken blindly as we are likely going to get some trappy moves today. Under 6770 and it may be more bearish. Gold continues to look bullish. Oil still cannont get oer the 18ma. BTC may get to 95k but still looks corrective to me.

SPY Dual Opportunity Day: SPY Calls + Puts Both Showing Edge📢 SPY Weekly — Clean Breakdown (Calls & Puts Both Valid Today)
Here’s a simplified and community-friendly version you can post:
📊 SPY QuantSignals V3 Weekly | 2025-12-02
We have two valid angles today based on timeframe differences:
🟢 WEEKLY FRAME (Composite Score) → BUY CALLS
Direction: CALLS
Confidence: 58%
Expiry: Dec 5
Strike Focus: 680
Entry: 0.03
Target: 0.06
Stop: 0.01
Notes: Weekly momentum is neutral, but multi-timeframe alignment leans bullish.
🔻 KATY AI (Full 168-point Prediction) → BUY PUTS
Direction: PUTS
Confidence: 58%
Reason:
Katy predicts steady downside drift (-0.33%).
RSI overbought (73.8).
Weak volume (0.2× average).
P/C ratio 1.22 → bearish flow.
PUT Setup:
Entry: 0.02–0.03
Target: 0.06–0.09
Stop: 0.01
Risk: Moderate–High

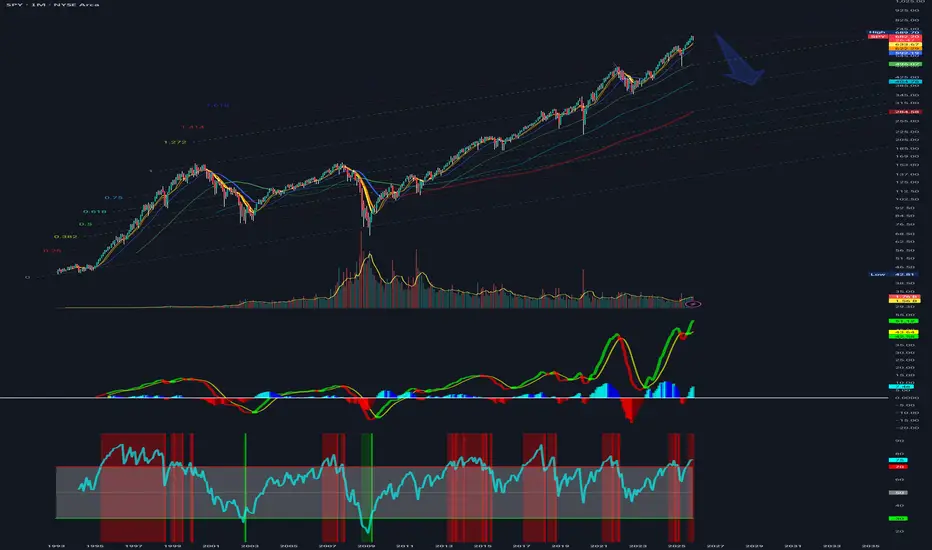
SPY’s Hidden Volatility Regimes: 30 Years, 11 Market StatesMost traders treat SPY as one continuous market. But when you analyze its volatility statistically over the last 32 years, you find something different:
SPY has moved through 11 distinct volatility regimes.
Each regime behaves like its own market — with different trend strength, risk, and strategy expectancy.
________________________________________
How the analysis was done (Python)
A full volatility-regime diagnostic was run in Python on SPY daily data from 1993–2025 using:
• EWMA Realized Volatility on log returns
• Bai–Perron Structural Break Detection → 11 statistically significant volatility segments
• ADF + KPSS Stationarity Tests per segment
• Wavelet Decomposition (db4) for multi-frequency behavior
• Gaussian HMM (3-state) to classify volatility clusters
This produces an objective, statistically robust regime map — not a visually fitted segmentation.
Note: The current indicator you are seeing on chart uses a close approximation of this Python workflow due to Pine Script limitations (no structural-breaks, wavelets, or HMMs).
________________________________________
Key Regime Shifts (and why traders should care)
2007 → 2008: Volatility expansion before the crash
• Volatility rose months before price collapsed.
• Trend-following weakens early, even when price still looks bullish.
• Volatility-selling becomes asymmetric and dangerous.
Late 2008: Hyper-unstable micro-regimes
• Extremely short-lived regimes during systemic stress.
• Trend systems fail almost immediately.
• Best edge: intraday volatility + reduced size.
• Swing systems lose reliability.
2012–2020: Longest low-vol regime in SPY history
• Multi-year volatility compression.
• Cleanest period for trend-following and breakout trading.
• Volatility-selling performs consistently with low tail risk.
Feb–May 2020: Fastest regime break ever (COVID)
• Sudden volatility snap with minimal pre-signals.
• Stop-loss slippage, gap risk, failed breakouts.
• Vol-selling structurally unsafe.
• Intraday ranges exploded.
2020–Present: Structurally higher volatility
• Volatility never returned to pre-2020 levels.
• Trends break faster, false breaks increase.
• Adaptive models outperform static rules.
• Mean-reversion selectively returns.
________________________________________
Why regime awareness matters
Volatility regimes directly influence:
• trend strength
• breakout reliability
• stop-loss behaviour
• mean-reversion expectancy
• options premium
• day-range expansion
• risk sizing
Using one fixed playbook across all regimes is equivalent to trading 11 different markets with the same system.
Knowing the active volatility regime is a foundational trading edge.
________________________________________
About the indicator: I have created a simplified, real-time compatible approximation of the Python regime model. It reflects:
• regime shifts
• volatility clustering
• compression/expansion phases
…without the heavy computation of the Python workflow.
________________________________________
If you want the current active regime or the Python code breakdown, just let me know.

Carry Trade Profits in the Global Market1. Fundamentals of Carry Trade
The carry trade is essentially a form of arbitrage. Traders exploit the differences in interest rates between countries to generate profit. Typically, investors borrow money in a currency considered “cheap” — usually from countries with low-interest rates like the Japanese yen (JPY) or the Swiss franc (CHF) — and convert it into a currency with higher interest rates, such as the Australian dollar (AUD), New Zealand dollar (NZD), or emerging market currencies like the Brazilian real (BRL) or Turkish lira (TRY).
The profitability of carry trades comes in two forms:
Interest Rate Differential (Carry): The primary profit is derived from the interest rate spread between the funding currency and the target currency. For instance, if an investor borrows 1 million JPY at an interest rate of 0.1% and invests in AUD at 5%, the net interest profit before costs is substantial, particularly on leveraged positions.
Currency Appreciation: In addition to the interest rate differential, carry trade profits can be enhanced if the higher-yielding currency appreciates against the funding currency. This combination of yield and potential capital gains makes carry trade highly attractive during periods of global economic stability and low volatility.
2. Mechanics of the Carry Trade
Carry trades are typically executed through foreign exchange (FX) markets. The process involves:
Funding Position: Borrowing a currency with low-interest rates, often through short-term instruments like FX swaps, forward contracts, or interbank loans.
Investment Position: Converting the borrowed funds into a higher-yielding currency and investing in instruments such as government bonds, corporate bonds, or high-interest savings accounts denominated in that currency.
Leverage Utilization: Many carry trades employ leverage to magnify returns. Borrowing multiple times the invested capital can substantially increase profits, though it also escalates risk.
The net profit is calculated as the difference between the earned interest and the cost of borrowing, adjusted for currency fluctuations and transaction costs.
3. Historical Context and Global Examples
Historically, carry trades gained prominence in the late 20th and early 21st centuries when global financial markets became increasingly integrated. The Japanese yen became the quintessential funding currency due to Japan’s long-standing low-interest-rate policies. For example, in the early 2000s, investors borrowed cheap yen to invest in Australian and New Zealand assets, reaping significant profits from both interest rate differentials and currency appreciation.
Emerging market currencies have also been frequent targets for carry trades. High yields in countries like Brazil, Mexico, and South Africa attracted global capital inflows, driving short-term currency strength. Similarly, during periods of monetary easing in developed economies, the differential widened, boosting carry trade attractiveness.
4. Profitability Drivers
Several factors determine carry trade profitability:
Interest Rate Differentials: Larger differentials increase potential returns. Central bank policies directly impact these spreads. For example, aggressive rate hikes in emerging markets can widen the gap with developed markets’ low rates, fueling carry trade activity.
Currency Stability: Stable currencies reduce the risk of adverse exchange rate movements, making the strategy more predictable.
Global Liquidity: Ample liquidity in global markets facilitates smooth execution of carry trades, lowering transaction costs.
Investor Sentiment and Risk Appetite: Carry trades tend to thrive in risk-on environments. Investors’ willingness to seek higher returns in emerging markets or higher-yield currencies directly influences profitability.
5. Risks Associated with Carry Trades
Despite their profitability, carry trades are inherently risky due to leverage and exposure to multiple market factors:
Currency Risk: A sudden depreciation of the target currency against the funding currency can quickly erase interest gains. For instance, if the Australian dollar falls against the yen, the initial investment converts back into fewer yen, causing losses.
Interest Rate Risk: Unexpected central bank decisions can reverse the interest rate advantage, reducing or eliminating carry trade profits.
Market Volatility: Financial crises or geopolitical events can trigger rapid unwinding of carry trades, leading to sharp losses. The 2008 global financial crisis exemplified this, as leveraged carry trades collapsed, causing massive currency swings.
Liquidity Risk: In times of market stress, exiting positions can be costly due to reduced liquidity, amplifying losses.
Professional traders mitigate these risks through hedging strategies, stop-loss orders, and diversification across multiple currency pairs and maturities.
6. Modern Developments in Carry Trades
In recent years, the carry trade landscape has evolved due to changes in monetary policy, technological advancements, and global market dynamics:
Low-Interest Rate Environment: Prolonged low rates in developed economies have compressed traditional interest rate differentials, reducing carry trade opportunities.
Algorithmic Trading: Automated strategies and algorithmic trading systems now dominate carry trade execution, improving efficiency but also increasing susceptibility to rapid market corrections.
Emerging Market Volatility: While high-yield currencies remain attractive, political instability and economic shocks introduce heightened risk, demanding more sophisticated risk management.
Diversification Across Asset Classes: Modern carry trades often integrate multi-asset approaches, including bonds, equities, and commodities, to enhance returns while mitigating currency risk.
7. Global Implications of Carry Trade Activity
Carry trades influence global financial markets beyond individual investor profits. Large-scale capital flows can impact exchange rates, interest rates, and liquidity conditions in emerging and developed markets alike. For example, heavy inflows into a high-yield currency can appreciate it significantly, affecting export competitiveness. Similarly, sudden unwinding of carry trades can trigger “flash crashes” in currency markets, as seen during past financial crises.
Central banks monitor carry trade activity carefully, as massive leveraged positions can exacerbate financial instability. This interplay between market participants and monetary authorities makes carry trade both a source of profit and a systemic consideration.
8. Conclusion
Carry trade profits in the global market emerge from exploiting interest rate differentials and potential currency appreciation. While historically lucrative, the strategy carries substantial risks, particularly during periods of economic uncertainty or market volatility. Successful carry trading requires a combination of careful analysis, risk management, and timely execution, often leveraging modern financial technologies.
Despite challenges, carry trades remain a vital component of the global financial landscape, influencing capital flows, currency valuations, and investment strategies worldwide. As central banks adjust monetary policies and global markets continue to integrate, carry trades will evolve, offering opportunities and risks that reflect the ever-changing dynamics of the global economy. Investors who understand these mechanisms and manage risks effectively can continue to profit from carry trades while navigating the complex landscape of international finance.
Weekly US Market Outlook – SPY, QQQ, DXY, VIX (30 NOV)Weekly US Market Outlook – SPY, QQQ, DXY, VIX
Bullet points:
Market sentiment turned bullish again as the probability of a December Fed rate cut climbed to 87%.
Fear & Greed Index recovered from extreme fear (9) to 24.
Options sentiment still signals extreme fear → room for upside continuation.
DXY remains bearish until 99, supporting risk assets.
VIX continues to decline toward 15.70–14.20, but these levels historically precede sharp corrections.
Heavy data week ahead (ADP, Jobless Claims, PCE) → major volatility drivers.
SPY targets 690 → 700 zone; QQQ targets 625 → 637 → 647.5.
Market Sentiment
Market sentiment has shifted decisively toward a bullish stance after the probability of a December rate cut surged back to 86%. Markets are now pricing in one more cut before 2026, creating a supportive macro backdrop for equities. At the same time, the Fear & Greed Index has rebounded from extreme fear levels of 9 to 24, indicating a slow but clear improvement in risk appetite.
Stronger than expected earnings from NVDA continue to reinforce the narrative that the AI cycle is intact and far from bubble conditions. Additionally, easing geopolitical tensions specifically the US–China trade agreement have reduced risk premia across global markets. Taken together, these developments support a short to mid term bullish environment and increase the likelihood of a Santa Rally.
Options Sentiment
Despite improving market sentiment, options markets remain deeply positioned in the extreme fear zone. This divergence between spot indices and options positioning typically suggests that market participants remain hedged or underexposed, allowing equities to extend higher as positioning normalizes. In other words, options sentiment indicates there is still significant room for markets to explore higher price levels.
DXY – US Dollar Index
Monitoring the DXY is essential because of its direct correlation with risk assets. A rising dollar weighs on equities, while a declining dollar supports them. The DXY was rejected at the 100.30 level and is now retracing toward the HTF Key Zone, highlighted around 99.
My base case is a move down into the 99 region, followed by short term accumulation and a potential bounce back above this level. Until DXY reaches 99, the trend remains bearish, which historically provides strong support for equities, commodities, and other USD sensitive assets.
VIX – Volatility Index
VIX, which reflects S&P 500 options based volatility expectations, has been declining since the November 21 peak, which aligned with the recent local bottom in the S&P 500. I expect VIX to continue trending lower toward 15.70 and potentially 14.20 levels previously associated with S&P 500 all time highs.
However, it is crucial to note that when VIX reaches these zones, markets often experience rapid and unexpected corrections. Therefore, while volatility compression favors short-term bullish continuation, the risk of a sharp reversal increases as VIX approaches these historically significant thresholds.
Upcoming Data Releases
A high-impact macro week is ahead, especially between Wednesday and Friday. The key releases include:
ISM Manufacturing PMI – Monday
JOLTS Job Openings – Tuesday
ADP Nonfarm Employment – Wednesday
Services PMI – Wednesday
ISM Non-Manufacturing PMI – Wednesday
Initial Jobless Claims – Thursday
PCE Inflation (September, delayed) – Friday
Michigan Consumer Sentiment – Friday
The most influential dataset will be the combination of ADP Employment, Initial Jobless Claims, and PCE Inflation. If labor data comes in stronger than expected, the Fed may interpret it as a sign of a resilient labor market reducing the need for additional cuts. Conversely, if PCE inflation comes in hotter than expected, policymakers may see it as a reason to delay cuts.
Given that this PCE print is delayed due to the U.S. government shutdown, the market reaction may be muted, but it still matters for the December policy narrative.
SPY Weekly Outlook – Prediction
In my opinion, SPY is positioned to target new all time highs early in the week. Price may first test 686, followed by a brief retracement or consolidation, and then continue higher toward 690, marking a fresh ATH. Under strong bullish momentum, SPY may extend into the 700 zone by the end of the week. These levels represent the primary upside targets I will be monitoring closely.
QQQ Weekly Outlook – Prediction
QQQ remains structurally weaker than SPY, yet it also maintains strong bullish momentum. The 617 level is a key zone for potential call entries. Price may initially target 625, where a short term rejection could occur, followed by a small pullback. Afterward, QQQ could advance toward its all time high at 637, and in a stronger continuation scenario, possibly extend to 647.5.
Conclusion
Overall, market conditions have turned constructive again. Sentiment is stabilizing, central bank expectations are supportive, volatility is compressing, and the dollar remains weak all providing a tailwind for equities. This week’s heavy macro calendar may bring volatility spikes, but unless data significantly challenges the rate cut narrative, both SPY and QQQ appear positioned to continue their upward trajectory toward new highs.
⚠️ This analysis is for educational purposes only and does not constitute financial advice. Always conduct your own research before trading or investing.

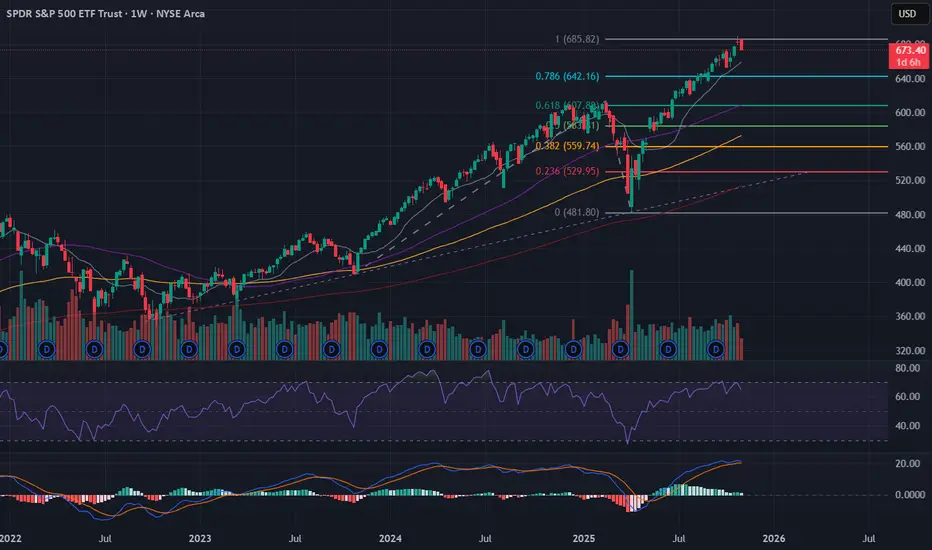
SPY Monthly Log FIB Channel👀
Patiently waiting for a ~20% correction with a confluence of buy signals from the indicators and oscillators... 😴
Funds for Future: Planning Today for Tomorrow1. Introduction to Funds for Future
The concept of "Funds for Future" revolves around strategic financial planning aimed at building a pool of resources to meet future financial goals. These funds are not just about saving but investing wisely to ensure that money grows over time. With uncertainties in economic conditions, inflation, and changing life circumstances, creating funds for the future has become a critical aspect of personal finance.
In essence, funds for the future are a combination of saving, investment, and risk management. They are designed to support various life goals such as retirement, children’s education, buying a home, or building wealth to achieve financial independence.
2. Importance of Creating Funds for Future
The primary purpose of future-oriented funds is to secure financial stability. Here are some key reasons why they are essential:
Financial Security: Life is unpredictable, and emergencies such as health issues, job loss, or economic downturns can arise. Having dedicated funds ensures that one is prepared.
Wealth Accumulation: Starting early allows investments to grow through the power of compounding. Even small monthly contributions can accumulate into a significant corpus over time.
Inflation Hedge: Simply saving cash loses value over time due to inflation. Investing in instruments that generate returns higher than inflation helps preserve and enhance purchasing power.
Goal Achievement: Different financial goals have varying timelines. Funds for future are often structured to meet these specific timelines efficiently.
3. Types of Funds for Future
Funds for future can take multiple forms, depending on risk appetite, time horizon, and financial goals:
Retirement Funds: Products like Employee Provident Fund (EPF), Public Provident Fund (PPF), and pension plans help secure income after retirement.
Education Funds: Parents often invest in child education plans, mutual funds, or fixed deposits aimed at meeting future educational expenses.
Wealth Accumulation Funds: These include mutual funds, stocks, real estate, or bonds aimed at long-term wealth growth.
Emergency Funds: Highly liquid savings that cover 6–12 months of living expenses, meant for unforeseen events.
4. Strategies for Building Funds for Future
Creating funds for the future is not just about investing but also involves careful planning:
Start Early: The earlier one starts, the greater the benefits of compounding.
Diversification: Investing in a mix of assets reduces risk. For example, a combination of equity, debt, and gold can balance returns and risks.
Regular Investments: Systematic Investment Plans (SIPs) in mutual funds help inculcate disciplined investing habits.
Monitoring and Rebalancing: Periodically reviewing the portfolio ensures alignment with changing goals and risk profiles.
Tax Efficiency: Investments should be optimized for tax savings to maximize returns. Instruments like ELSS (Equity Linked Savings Schemes) or PPF provide dual benefits of growth and tax advantage.
5. Challenges in Building Funds for Future
While the benefits are clear, there are challenges that one must navigate:
Market Volatility: Investments in equity or mutual funds are subject to market fluctuations.
Inflation Risk: Returns must outpace inflation to preserve wealth.
Liquidity Constraints: Long-term investments may be illiquid, making it hard to access funds quickly in emergencies.
Behavioral Biases: Emotional decision-making, like panic selling during market downturns, can hurt long-term growth.
Index Funds: A Simple, Efficient Investment Tool
1. Understanding Index Funds
Index funds are a type of mutual fund or exchange-traded fund (ETF) designed to replicate the performance of a specific market index, such as the S&P 500, Nifty 50, or Dow Jones Industrial Average. Unlike actively managed funds, which rely on fund managers to pick stocks, index funds passively invest in all or a representative sample of the stocks in the chosen index.
This passive investment strategy aims to mirror the performance of the broader market, rather than trying to outperform it.
2. Key Features of Index Funds
Passive Management: Minimal intervention from fund managers reduces management costs.
Diversification: By replicating an index, investors automatically hold a diversified portfolio, reducing risk associated with individual stocks.
Transparency: Investors know exactly what assets are held since they follow a predefined index.
Lower Costs: Lower expense ratios compared to actively managed funds make them cost-effective over the long term.
3. Types of Index Funds
Index funds can be classified based on the index they track:
Broad Market Index Funds: Track major indices like S&P 500 or Nifty 50.
Sectoral Index Funds: Focus on a specific sector, like technology, healthcare, or finance.
International Index Funds: Provide exposure to foreign markets by tracking global indices.
Bond Index Funds: Track bond market indices, offering fixed-income exposure with minimal active management.
4. Benefits of Investing in Index Funds
Consistent Market Returns: Since the fund mirrors the index, investors typically earn returns close to the market average, avoiding the pitfalls of underperforming active managers.
Cost Efficiency: Low expense ratios and minimal transaction costs make them attractive for long-term investors.
Tax Efficiency: Lower portfolio turnover reduces capital gains taxes compared to active funds.
Simplicity: Investors do not need to research individual stocks extensively; investing in an index fund provides instant diversification.
5. Risks and Limitations of Index Funds
Market Risk: Index funds are still exposed to market fluctuations; if the index falls, the fund value declines proportionally.
Limited Upside: Since they track the index, they cannot outperform it, limiting extraordinary gains.
Sector Bias: Some indices may overweigh certain sectors, leading to concentration risk.
6. How Index Funds Fit into Future Financial Planning
Index funds are often an ideal tool for building “funds for future” because they combine simplicity, diversification, and cost efficiency. For instance:
Retirement Planning: SIPs in broad-market index funds can grow into substantial retirement corpus over decades.
Education Funds: Long-term investment in index funds can provide sufficient growth to cover rising educational costs.
Wealth Creation: Index funds allow investors to passively participate in overall market growth, which historically outpaces inflation over the long term.
7. Comparing Index Funds and Active Funds
While active funds rely on managers to beat the market, index funds aim to match it. Studies have shown that over long periods, many active funds fail to outperform the market after adjusting for fees, making index funds a compelling long-term investment option.
Conclusion
Creating funds for the future and investing in index funds are both essential strategies for achieving financial security and long-term wealth growth. While funds for future emphasize the importance of disciplined, goal-oriented financial planning, index funds provide a practical, low-cost way to invest in the broader market without taking on excessive risk.
By combining thoughtful financial planning with efficient investment instruments like index funds, individuals can navigate market uncertainties, outpace inflation, and achieve life goals ranging from education and home ownership to a secure retirement. The synergy between forward-looking financial planning and passive, diversified investing ensures that one is not just saving but strategically growing wealth for the future.
In today’s dynamic economic environment, the key takeaway is that building funds for future and using tools like index funds is not merely an option—it’s a necessity for financial independence, security, and peace of mind.

The Energy Transition Boom: A Global Shift in PowerDrivers of the Energy Transition Boom
Climate Change and Environmental Pressures
The primary driver of the energy transition is the urgent need to combat climate change. Rising global temperatures, extreme weather events, and the growing awareness of environmental degradation have compelled governments, corporations, and societies to rethink energy production and consumption. International agreements, notably the Paris Agreement of 2015, set ambitious goals for reducing carbon emissions, pushing nations to accelerate the adoption of renewable energy sources. The global push for net-zero emissions by 2050 has fueled unprecedented investment in clean technologies.
Technological Advancements
The boom in renewable energy has been facilitated by significant technological breakthroughs. The cost of solar photovoltaic (PV) panels has dropped by over 90% in the past decade, while wind turbine efficiency has increased dramatically. Advances in energy storage, particularly lithium-ion and emerging solid-state batteries, have mitigated the intermittency issues associated with renewable energy, making it a more reliable alternative to fossil fuels. Smart grids, digital energy management systems, and artificial intelligence in energy optimization are also enabling more efficient and resilient energy networks.
Economic Incentives and Investment Flows
Governments worldwide are offering tax incentives, subsidies, and regulatory support to promote renewable energy. Simultaneously, private capital is flooding into clean energy projects. Investment in renewable energy reached over $500 billion globally in recent years, encompassing solar, wind, battery storage, and green hydrogen projects. The economic logic is compelling: renewable energy has low operational costs, scalability, and long-term price stability compared to volatile fossil fuel markets.
Energy Security and Geopolitical Factors
The energy transition is also influenced by energy security considerations. Countries seeking to reduce dependence on imported oil and gas are increasingly investing in domestic renewable energy infrastructure. Geopolitical conflicts and energy price shocks have underscored the vulnerability of traditional fossil fuel supplies. This has reinforced the urgency of diversifying energy sources to ensure stable, resilient, and locally controlled energy systems.
Key Sectors Driving the Boom
Solar Energy
Solar energy is at the forefront of the energy transition. Utility-scale solar farms and distributed rooftop installations have proliferated globally. Countries such as China, India, the United States, and Germany are leading in installed solar capacity. The combination of declining panel costs, government incentives, and the push for decentralized energy production is driving massive adoption. Innovations such as floating solar farms, solar windows, and bifacial panels are expanding the potential applications of solar technology.
Wind Energy
Wind power, particularly offshore wind, is experiencing rapid growth. Offshore wind farms offer higher and more consistent wind speeds, enabling greater energy output. Technological improvements, including larger turbines and floating platforms, are opening new regions for wind development. Europe, China, and the U.S. are investing heavily in offshore wind, with gigawatt-scale projects now feasible. Wind energy not only contributes to carbon reduction but also creates significant employment opportunities in manufacturing, construction, and maintenance.
Energy Storage and Grid Modernization
As renewable energy generation increases, so does the need for effective energy storage solutions. Batteries, pumped hydro storage, and emerging hydrogen storage technologies are essential for balancing supply and demand. Smart grid technologies, which integrate distributed energy resources, real-time monitoring, and predictive analytics, ensure efficient energy distribution. These innovations are critical to making renewable energy reliable and commercially viable.
Electric Vehicles and Electrification
The transition extends beyond power generation. Transportation, responsible for a significant share of global emissions, is undergoing electrification. Electric vehicles (EVs), supported by extensive charging infrastructure, are transforming automotive markets. Global EV sales have surged, driven by declining battery costs, government incentives, and rising consumer awareness. Electrification is also occurring in industrial processes, heating, and building systems, further boosting electricity demand from clean sources.
Hydrogen and Emerging Technologies
Green hydrogen, produced via electrolysis using renewable energy, is emerging as a key solution for decarbonizing hard-to-electrify sectors such as heavy industry, shipping, and aviation. Investments in hydrogen infrastructure, fuel cells, and storage are growing rapidly. Other emerging technologies, including carbon capture and storage (CCS) and next-generation nuclear power (e.g., small modular reactors), complement renewable energy deployment, expanding the toolbox for a sustainable energy future.
Economic and Societal Impacts
Job Creation and Industrial Growth
The energy transition boom is generating millions of jobs worldwide. Manufacturing, installation, operations, and maintenance of renewable energy assets require skilled labor. Research and development in clean technologies are fostering innovation hubs and boosting high-tech sectors. Economies embracing the transition are positioning themselves as leaders in the next industrial revolution.
Energy Access and Equity
Renewable energy offers opportunities for energy access in remote and underserved regions. Decentralized solar and wind projects can provide reliable electricity to rural communities, reducing dependence on centralized fossil-fuel grids. This contributes to socioeconomic development, education, and improved quality of life.
Market Disruption and Investment Opportunities
Traditional energy markets are being disrupted as renewable energy costs continue to fall. Fossil fuel companies are adapting by diversifying portfolios into renewables, while investors are reallocating capital toward sustainable assets. Green bonds, carbon credits, and ESG-focused investments are reshaping global finance, making sustainability a key driver of economic growth.
Challenges and Considerations
Despite its promise, the energy transition boom faces several challenges:
Intermittency of Renewable Energy: Solar and wind are weather-dependent, necessitating robust storage and grid management solutions.
Resource Constraints: The production of batteries and renewable infrastructure requires critical minerals such as lithium, cobalt, and rare earth elements, creating supply chain challenges.
Policy and Regulatory Uncertainty: Inconsistent policies and subsidies can slow investment and deployment.
Social and Environmental Concerns: Large-scale renewable projects must navigate land use, ecological impacts, and community acceptance.
The Future Outlook
The energy transition boom is expected to accelerate in the coming decades. Analysts predict that renewables could supply more than 50% of global electricity by 2050, with electrification of transport and industry driving further demand. Digitalization, artificial intelligence, and blockchain technologies will enhance grid management, energy trading, and efficiency. Investment in hydrogen, carbon removal, and advanced nuclear will provide complementary solutions for a fully decarbonized energy system.
In conclusion, the energy transition boom represents a historic opportunity for humanity to redefine how we produce, distribute, and consume energy. It is driven by environmental imperatives, economic incentives, technological innovation, and societal demand for sustainable growth. While challenges remain, the momentum is undeniable. Countries, corporations, and individuals who embrace this transformation stand to benefit from cleaner energy, economic growth, job creation, and long-term resilience. The energy transition is not just a shift in power—it is a paradigm shift that promises to reshape our economies, societies, and planet for generations to come.
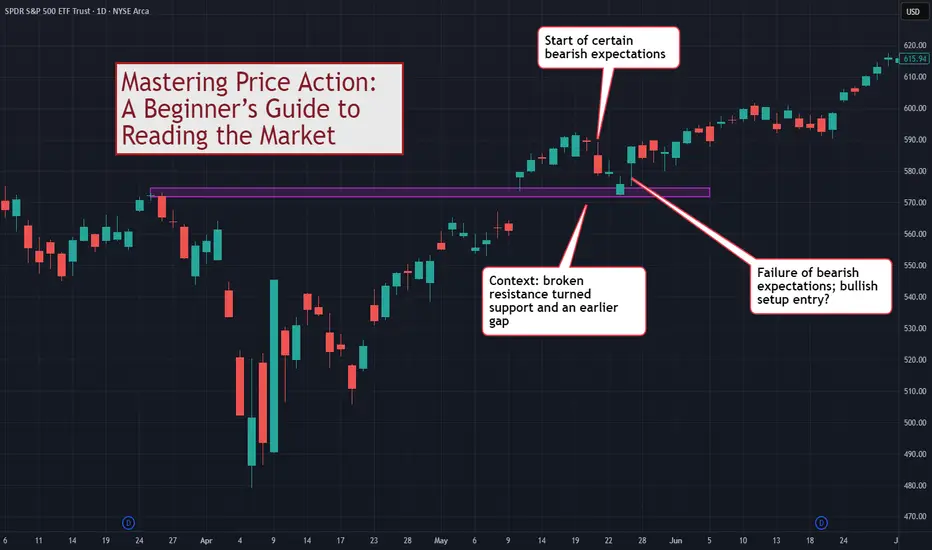
Mastering Price Action: A Beginner’s Guide to Reading the MarketThis discussion goes beyond the basic idea of "memorizing candlestick names." If you want to truly master price action as a tool for reading the market and understanding it as a basis for trading, this guide is for you.
Disclaimer:
The information provided in this tutorial is intended solely for educational purposes. Nothing in this material should be interpreted as financial, investment, or trading advice. Any strategies, methods, tools, or concepts discussed are presented for learning and demonstration only. You are responsible for evaluating your own decisions and risks. Always conduct independent research and consult a qualified professional before making financial or investment choices.
⚠️ WHY MOST TRADERS MISUSE PRICE ACTION
Most traders use price action in a simplistic way:
See a Pin Bar = Buy
See a Doji = Indecision
See an Engulfing = Reversal
The problem with this approach is that you are trading shapes instead of market dynamics.
Price action is not merely pattern recognition. It is a language.
To master price action, you must understand:
Volatility (Range)
Conviction (Body)
Buying/Selling Pressure (Shadows)
Context (Relative performance)
Expectation vs. Reality (Market Inertia)
Price action tells you the story of the battle between buyers and sellers.
📊 1. DECODING THE SINGLE BAR (THE DNA)
Before you can read a chart, you must be able to read a single bar.
Although a single bar is created from Open/High/Low/Close, it gives you critical information beyond that.
🕯️Range = Volatility
The distance between High and Low.
Wide Range: Active market, high volatility.
Narrow Range: Dead market, low volatility.
This chart shows the low volatility period transitioning to the high volatility prior to a major reversal.
🕯️Body = Conviction
Large Body: The market conquered territory. Strong conviction (Bullish or Bearish).
Small/No Body (Doji): The market is undecided. A battle with no winner.
This chart points out two bullish bars, one with weaker conviction than the other.
🕯️Shadows = Pressure
Upper Shadow: Selling Pressure. The market tried to go higher but was rejected.
Lower Shadow: Buying Pressure. The market tried to go lower but was rejected.
This chart shows how we can observe the shifting of buying/selling pressure by observing the wicks (tails/shadows) of candlesticks.
TIP: For examining shadows, focus on the shadows (wicks) that take up around at least 50% of the bar range.
📊 2. CONTEXT IS KING (TWO-BAR ANALYSIS)
Now, let’s go on to two-bar analysis.
Nothing works in isolation. A "wide" bar is only wide(r) if its range is larger than the previous bar.
The key here is to use the first bar to set the context for the second.
Volatility Check: Is the range expanding (market waking up) or contracting (market resting)?
The "Test": Every bar's High and Low are natural support and resistance levels.
- If Bar 2 breaks Bar 1's Low and closes lower → Bearish Victory .
- If Bar 2 breaks Bar 1's Low but reverses to close higher → Bullish Rejection (False Break) .
This chart focuses on one specific bar and compares it with the previous bar. Our observation produces no conclusion, only more questions.
📊 3. THE EXPECTATION GAME (THREE-BAR ANALYSIS)
This is the secret sauce of price action readers, forming expectations and observing. The market has inertia , for e.g. bullishness should follow bullishness.
This chart extends our earlier two-bar analysis. The third bar is a Doji, confirming uncertainty on the side of the bulls.
The Basic Analytical Framework For Close Price Action Analysis:
Read Bars 1 & 2: Form an expectation. (e.g., "Strong bearish bars, I expect Bar 3 to go down.")
Watch Bar 3: Does it confirm or fail your expectation?
Confirmation: Market moves as expected (Trend continues).
Failure: Market defies expectation (Potential Reversal).
📊 4. PATTERNS ARE JUST LABELS
Stop looking for "Pin Bars" or "Engulfing patterns" by name. Look for the behavior.
Pin Bar: Essentially a bar where the market tested a support/resistance level and was violently rejected (Long Shadow).
Outside Bar: A bar where volatility expanded and totally overwhelmed the previous session.
When you read the story, you don't need the labels.
📊 EXAMPLE TRADING FRAMEWORK
From the above, we can build a simple trading framework based on identifying context, forming expectations, and trading the failure of expectations . This is not the only framework but one of the many possible.
Bullish Setup
Context: Price tests a support level or previous low.
The Trigger: A bar shows a failure of bearish expectation (e.g., tries to go lower but closes high).
Bearish Setup
Context: Price tests a resistance level or previous high.
The Trigger: A bar shows a failure of bullish expectation (e.g., tries to break out but slams back down).
This chart shows a example leading to a potential long setup.
⚠️ COMMON MISTAKES
Trading in a Vacuum: Taking a "Pin Bar" signal without checking if the market is trending or ranging.
Ignoring the Body: A long shadow means nothing if the body shows the other side still has control.
Fixating on Names: Worrying if it's a "Harami" or an "Inside Bar" instead of asking "Who is winning?"
🎯 CONCLUSION
Reading price action is about knowing what the market has done and what it is doing now . It increases your chances of predicting what it will do .
Forget the fancy names.
Focus on the OHLC relationship.
Trade the failure of expectations.
Master this microscopic view, and then combine it with macroscopic market structure for the ultimate edge.
How do you read price action? Do you use patterns or read the flow? Share your approach below!
SuperWideBull. That is all.
Never going to see 630.
Btw, 335 held up surprisingly well in SMH, so that kind of killed any semblance of volatility or risk in the short term

SPY: Will Start Growing! Here is Why:
Looking at the chart of SPY right now we are seeing some interesting price action on the lower timeframes. Thus a local move up seems to be quite likely.
Disclosure: I am part of Trade Nation's Influencer program and receive a monthly fee for using their TradingView charts in my analysis.
❤️ Please, support our work with like & comment! ❤️
$BTC and $SPYCRYPTOCAP:BTC AMEX:SPY one thing of note the S&P 500 has not yet gone to a sell signal on the weekly while CRYPTOCAP:BTC has. One of these two are going to flip.

SPY on the BrinkYou can clearly see we failed to hold the central Green Trendline—a bearish signal. We are now testing the lower Pink Trend Channel.
This green line is the absolute last stand for the bulls in the short term. If it goes above and holds, we look for a rally back toward that pink line at the top. If it breaks, prepare for accelerated selling. This is our line in the sand.
What's driving the fear? Looking at our Top 10 Interest List : We saw weakness led by the Magnificent Seven, particularly NVIDIA ( NASDAQ:NVDA ) and Tesla ( NASDAQ:TSLA ), whose recent sell-offs are pulling the entire index down. Watch their reversals for the first sign of SPY momentum returning

Time to pause and ThinkNothing definitive, but we got to the 18 weekly ma and the daily BB and horizontal support. A relief rally is likely, but it could be short lived if they want to quickly break down to 6200. Vix is at resistance. Gold, probably a move up from here. BTC could drop a bit more but it's in a support zone. Oil may drop to test it's lows.
Good luck!

SPY – Melt-Up Setup After a Full Liquidity DrainVolanX DSS | Vampiric Setup Detected
The chart shows a high-timeframe liquidity purge into the 0.618–0.702 demand zone, followed by the exact structure that triggers a melt-up in our system:
1. Liquidity Drain Completed
Price swept the prior liquidity pool and tapped the deeper inefficiencies sitting under April–May structure.
This is the “vampiric phase” → smart money drains before initiating direction.
2. VolanX DSS Signals: Reversal Architecture Forming
Stop sweep confirmed
Displacement candle triggered
Breaker zone created
Liquidity reclaim expected on next impulse
This is identical to the reversal leg we study in the Vampiric Setup framework.
3. Time-Series Projection Path
Our forecast aligns with a W-shaped bottom before a parabolic leg:
First bounce → rejection
Re-test into final liquidity pocket
Acceleration phase toward the 1.618 extension at 814.84
Blow-off extension toward the 2.0 range
This projection has the same signature as past melt-up formations: low volatility, compressed order flow, and clear higher-timeframe imbalance above.
4. Macro Fits the Math
A melt-up becomes more likely when:
Liquidity returns via Treasury issuance
Fed pivots to accommodation
Volatility collapses while positioning is defensive
This creates a “vacuum rally,” which is exactly what the model is tracking.
EDGE TAKEAWAY
SPY is completing the final liquidity drain. Once the reclaim triggers, the melt-up leg toward 815 becomes the base case.
The real crash comes after the blow-off, not before.
— WaverVanir • VolanX DSS

How to Identify Stocks Uptrends and Downtrends to Gain a TradingHow to Identify Stocks Uptrends and Downtrends to Gain a Trading Edge and understand the psychology behind the patterns

Every Time the Market Falls… Gold Crushes BTC. Are We Here AgainThe setup is repeating.
When the S&P 500 sits at shallow drawdowns while the Gold/BTC spread spikes higher, the same thing has happened every single time:
📉 Equities correct
🥇 Gold outperforms Bitcoin
🔒 Liquidity tightens
🔍 What the chart is signalling now
• The S&P 500 drawdown is compressing near 0% — historically a fragile point.
• Gold/BTC is turning up sharply, just like before major volatility spikes (2018, 2020, 2022, 2025).
• BTC tends to lag hard when liquidity cracks.
🧩 Why this matters
A rising Gold/BTC spread =
• Flight to hard collateral
• Stress in risk assets
• Lower risk appetite
• Early warning of equity weakness
This relationship hasn’t failed in almost a decade.
⚠️ If the pattern repeats…
We could be looking at another risk-off rotation, with gold outperforming BTC and stocks struggling to hold highs.
TVC:GOLD & AMEX:SPY & BINANCE:BTCUSDT

$SPY - running out of steam?Macroeconomic backdrop:
Fed uncertainty: Hawkish Fed speak as of this morning and post-Fed interest rate decision overall, the market’s confidence in continuing rate cuts is fading.
Labour market cracks: Ongoing job-cut headlines from large-caps hint at weakness, and continued signs of a cooling job market could weigh on consumer sentiment.
Momentum factor losing strength: High-beta speculative names such as NYSE:IONQ , NYSE:OKLO , NYSE:JOBY , and NASDAQ:KTOS have begun to roll over before the weakness in AMEX:SPY - often an early sign that the broader momentum is weakening.
Technicals:
The rally failed to sustain a breakout above the $685 resistance zone, showing exhaustion near prior swing highs.
Volume divergence and flattening short-term moving averages support the idea that upside momentum is waning.
If macro sentiment stays negative, the next logical retracement target sits near the $642 Fib support, aligning with prior consolidation levels.
Stop-loss: $692 - just above the all-time high, to protect against a renewed momentum leg higher.
Thesis:
After an extended move with minimal pullback, SPY looks vulnerable to a short-term correction. Macro indecision, fading momentum, and sector-wide complacency all point to a market that could start pricing in overvaluation relative to fundamentals.
Maximize Your Gains: Latest QS V3 AI Trade AlertsSPY 0DTE Signal (2025‑11‑20)
Direction: Buy PUTS (Short)
Strike Price: $650.00
Entry Range: $0.02 – $0.03 (mid ~$0.03)
Target 1: $0.06 (~+200% gain)
Target 2: $0.09 (~+350% gain)
Stop Loss: $0.01 (~‑50% from entry)
Expiry: 2025‑11‑20 (same-day)
Confidence Level: 60% (Low-Moderate)
Position Size: 2% of portfolio
📊 Market / Signal Analysis
Katy AI Prediction: Bearish trajectory with price expected to decline to $670.84 (~‑0.48% from current price). 390 prediction points show consistent downward momentum despite neutral summary.
Technical Factors:
Current Price: $674.09
VWAP: $672.77 (price slightly above)
Session Range: $662.62 – $674.70 (support near lower bound)
Volume: 9.1× average → strong participation, direction uncertain
News / Sentiment: Mixed geopolitical developments (Russia oil sanctions, China-US trade) create risk-off sentiment; no strong bullish catalysts
Options Flow: Neutral PCR 0.79, unusual activity at $691 call, max pain ~$668 → mild downward pressure
⚠️ Risk Considerations & Strategy
0DTE trade → extreme time decay and rapid price swings.
Katy AI shows bearish signal, but confidence moderate → low conviction trade.
Tight stop-loss and small position size recommended.
Trade aims to capture intraday downward momentum, especially afternoon acceleration as predicted.

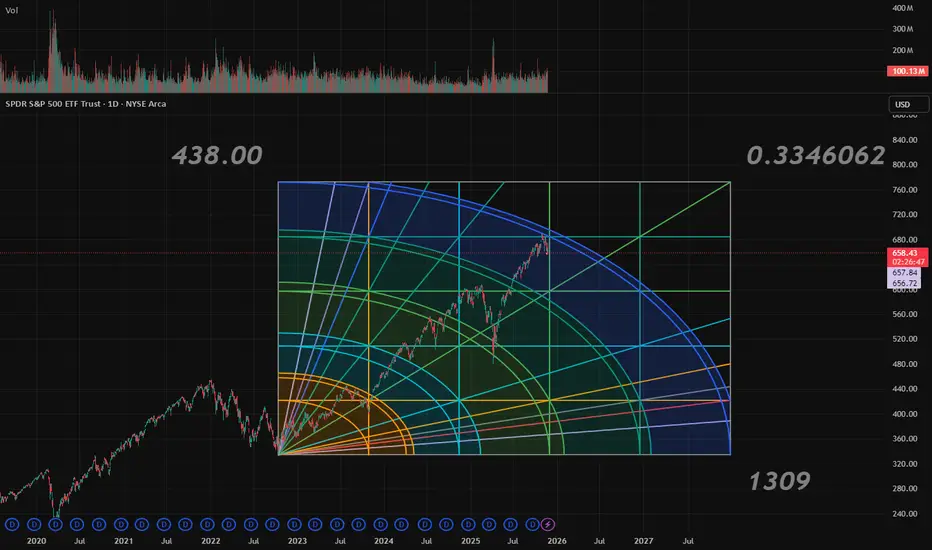
$SPY analysis that was made by me in april of 2024in the picture you can see how spy hit the tool i perfected after a year and a half of wait, i believe we are about to experience a really big drop, speaking from a long term view of the stock market
SPX at support, a break gets it to 6500All in the video, we are at support but the momentum is firmly pointing down. If they break 6600, 6500 would likely be next.

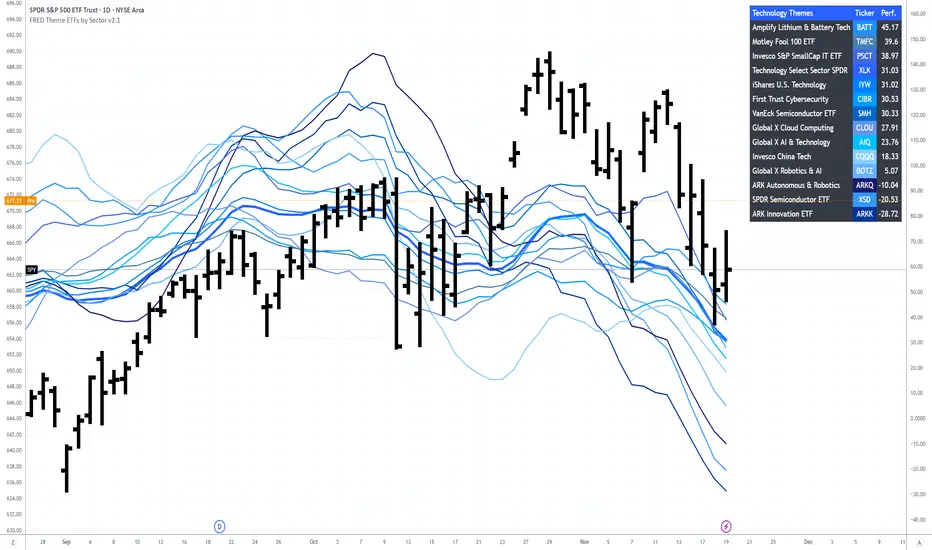
SP500 Navigator Public Rotation Theme ETFThis indicator compares the performance of multiple Theme ETFs and presents their relative movements on a single chart. It helps visualize rotation flows, leadership changes and the evolution of ETF groups over time. Useful for understanding how different investment themes behave in various market environments.