How to Identify Stocks Uptrends and Downtrends to Gain a TradingHow to Identify Stocks Uptrends and Downtrends to Gain a Trading Edge and understand the psychology behind the patterns
Trade ideas

Every Time the Market Falls… Gold Crushes BTC. Are We Here AgainThe setup is repeating.
When the S&P 500 sits at shallow drawdowns while the Gold/BTC spread spikes higher, the same thing has happened every single time:
📉 Equities correct
🥇 Gold outperforms Bitcoin
🔒 Liquidity tightens
🔍 What the chart is signalling now
• The S&P 500 drawdown is compressing near 0% — historically a fragile point.
• Gold/BTC is turning up sharply, just like before major volatility spikes (2018, 2020, 2022, 2025).
• BTC tends to lag hard when liquidity cracks.
🧩 Why this matters
A rising Gold/BTC spread =
• Flight to hard collateral
• Stress in risk assets
• Lower risk appetite
• Early warning of equity weakness
This relationship hasn’t failed in almost a decade.
⚠️ If the pattern repeats…
We could be looking at another risk-off rotation, with gold outperforming BTC and stocks struggling to hold highs.
TVC:GOLD & AMEX:SPY & BINANCE:BTCUSDT

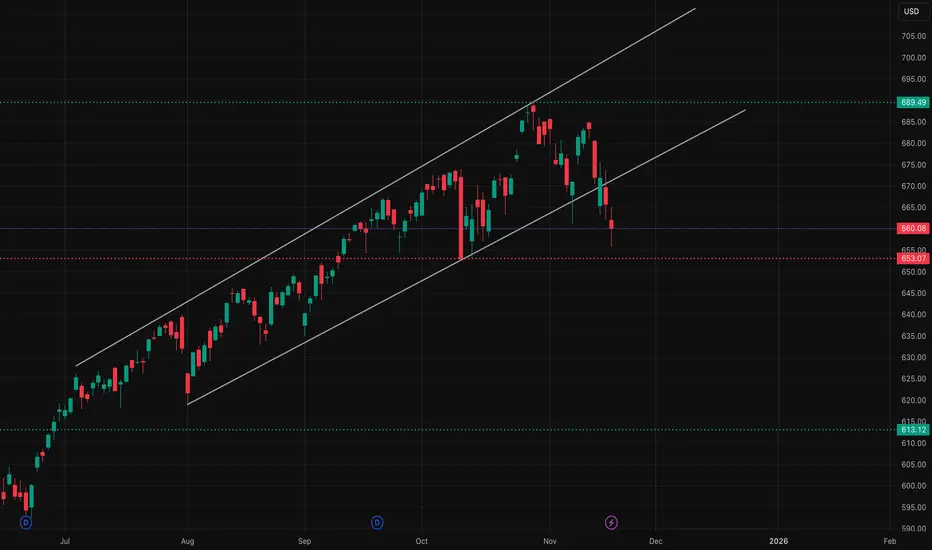
$SPY - running out of steam?Macroeconomic backdrop:
Fed uncertainty: Hawkish Fed speak as of this morning and post-Fed interest rate decision overall, the market’s confidence in continuing rate cuts is fading.
Labour market cracks: Ongoing job-cut headlines from large-caps hint at weakness, and continued signs of a cooling job market could weigh on consumer sentiment.
Momentum factor losing strength: High-beta speculative names such as NYSE:IONQ , NYSE:OKLO , NYSE:JOBY , and NASDAQ:KTOS have begun to roll over before the weakness in AMEX:SPY - often an early sign that the broader momentum is weakening.
Technicals:
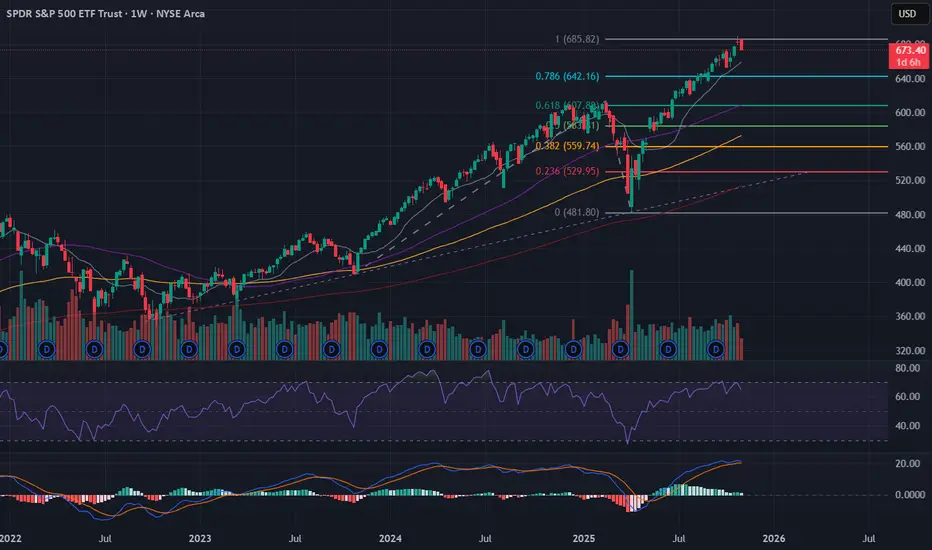
The rally failed to sustain a breakout above the $685 resistance zone, showing exhaustion near prior swing highs.
Volume divergence and flattening short-term moving averages support the idea that upside momentum is waning.
If macro sentiment stays negative, the next logical retracement target sits near the $642 Fib support, aligning with prior consolidation levels.
Stop-loss: $692 - just above the all-time high, to protect against a renewed momentum leg higher.
Thesis:
After an extended move with minimal pullback, SPY looks vulnerable to a short-term correction. Macro indecision, fading momentum, and sector-wide complacency all point to a market that could start pricing in overvaluation relative to fundamentals.
Maximize Your Gains: Latest QS V3 AI Trade AlertsSPY 0DTE Signal (2025‑11‑20)
Direction: Buy PUTS (Short)
Strike Price: $650.00
Entry Range: $0.02 – $0.03 (mid ~$0.03)
Target 1: $0.06 (~+200% gain)
Target 2: $0.09 (~+350% gain)
Stop Loss: $0.01 (~‑50% from entry)
Expiry: 2025‑11‑20 (same-day)
Confidence Level: 60% (Low-Moderate)
Position Size: 2% of portfolio
📊 Market / Signal Analysis
Katy AI Prediction: Bearish trajectory with price expected to decline to $670.84 (~‑0.48% from current price). 390 prediction points show consistent downward momentum despite neutral summary.
Technical Factors:
Current Price: $674.09
VWAP: $672.77 (price slightly above)
Session Range: $662.62 – $674.70 (support near lower bound)
Volume: 9.1× average → strong participation, direction uncertain
News / Sentiment: Mixed geopolitical developments (Russia oil sanctions, China-US trade) create risk-off sentiment; no strong bullish catalysts
Options Flow: Neutral PCR 0.79, unusual activity at $691 call, max pain ~$668 → mild downward pressure
⚠️ Risk Considerations & Strategy
0DTE trade → extreme time decay and rapid price swings.
Katy AI shows bearish signal, but confidence moderate → low conviction trade.
Tight stop-loss and small position size recommended.
Trade aims to capture intraday downward momentum, especially afternoon acceleration as predicted.

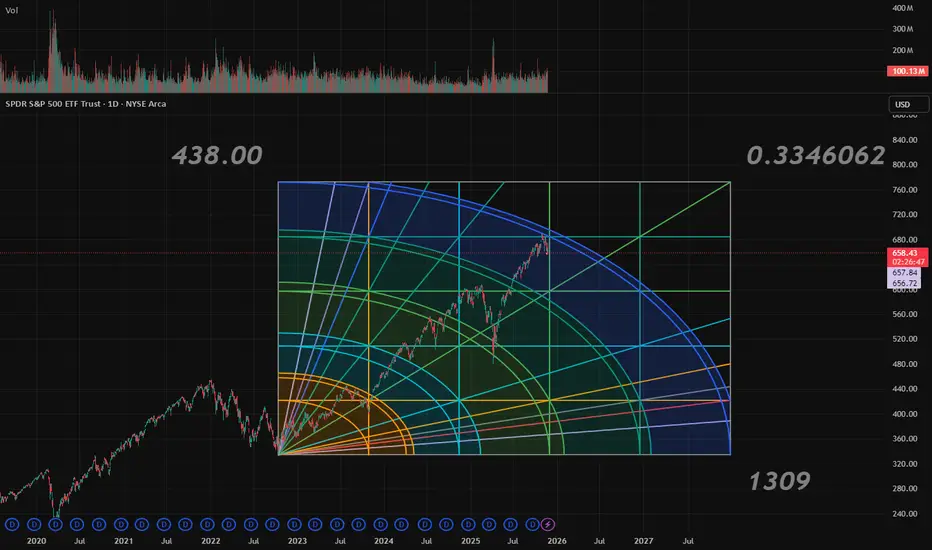
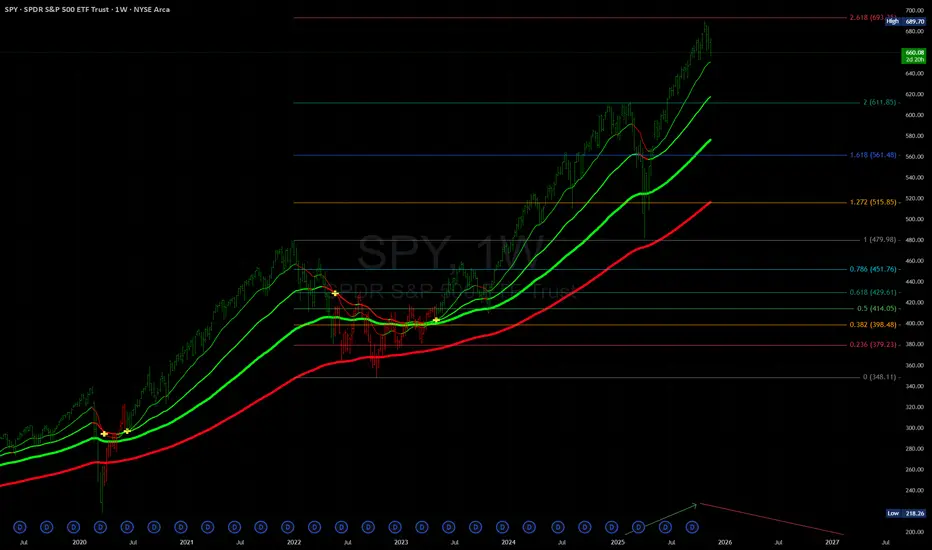
$SPY analysis that was made by me in april of 2024in the picture you can see how spy hit the tool i perfected after a year and a half of wait, i believe we are about to experience a really big drop, speaking from a long term view of the stock market
SPX at support, a break gets it to 6500All in the video, we are at support but the momentum is firmly pointing down. If they break 6600, 6500 would likely be next.

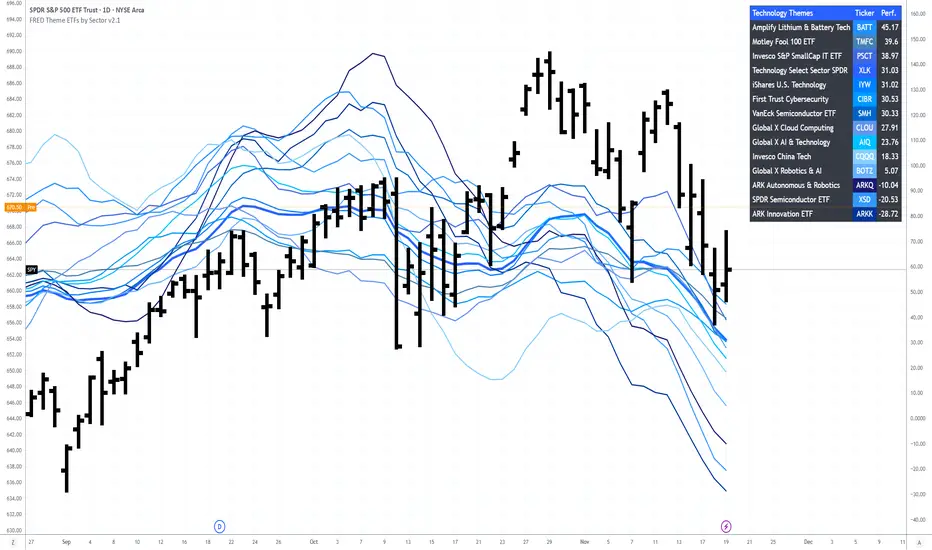
SP500 Navigator Public Rotation Theme ETFThis indicator compares the performance of multiple Theme ETFs and presents their relative movements on a single chart. It helps visualize rotation flows, leadership changes and the evolution of ETF groups over time. Useful for understanding how different investment themes behave in various market environments.

SPC Rotation Theme ETFThis indicator compares the performance of multiple Theme ETFs and presents their relative movements on a single chart. It helps visualize rotation flows, leadership changes and the evolution of ETF groups over time. Useful for understanding how different investment themes behave in various market environments.
SPY – Key Levels Ahead of the Nov. 20 Session1-Hour Outlook (Main Bias)
SPY broke out of the falling channel and is now pressing directly into the 669–671 resistance zone — the same area that rejected multiple times over the past week.
1H Structure
* SPY printed a clear CHoCH → BOS sequence off the 655 base.
* The breakout through the channel roof confirms short-term bullish structure.
* Price is currently sitting right under the 670–672 supply zone.
* Volume expansion supports the upside attempt.
* EMAs are turning bullish; momentum markets tend to respect these rotations.
1H Key Levels
Breakout trigger: above 672
Upside targets:
* 676.10 (1H resistance)
* 680.20 (next liquidity pocket + GEX resistance)
Support zone: 660–663
Bears gain control only below: 656
1H Trading Idea
Bullish scenario:
If SPY holds above 663 and reclaims 669–670, a breakout through 672 becomes high-probability, opening room toward 676 then 680.
Bearish scenario:
Only valid if SPY forms a clean rejection candle at 672, shifting momentum lower toward 663 and then 656.
15-Minute Outlook (Execution Timeframe)
SPY is consolidating under resistance after a strong impulse push off the 655–658 demand zone.
15M Structure
* Recently printed CHoCH → BOS → continuation.
* Price is riding a short-term ascending micro-channel.
* EMAs are stacked bullish.
* Consolidation under resistance is constructive — not yet a reversal.
15M Trading Setups
Bullish entry:
* Ideal pullback zone: 665–666
* Look for a bullish engulfing or strong wick rejection.
* Targets: 670 → 676
* Stop below 664
Breakout entry:
* Enter on clean break above 672
* Stop below last 15M swing
* Targets: 676 → 680
Bearish scalp:
* Only if repeated rejections form at 671–672
* Target: 663, then 660
GEX Confirmation
Based on the SPY GEX chart:
Bullish Signals
* Major positive NETGEX sits at 680, acting as an upward magnet.
* Call walls at 670, 675, 680 support drift higher.
* Minimal put defense above 663.
* Gamma structure favors upside continuation if 672 breaks.
Bearish Signals
* Large put support at 656; real breakdown only below that level.
Interpretation
GEX positioning supports a continued push upward.
If 672 opens, hedging behavior favors a move into 676–680.
Downside momentum does not gain traction unless SPY loses 663 and then 656.
Options Trading Plan (GEX-Based)
Bullish Plan
If SPY breaks above 672 with momentum:
Contracts to consider:
* 672C
* 675C
Targets:
676 → 680
Reason:
Break above resistance forces upward hedging, driving continuation into the next GEX levels.
Bearish Plan
Only valid on a clean rejection at 672:
Contracts to consider:
* 665P
* 660P
Targets:
663 → 660
Reason:
Below 663, gamma turns neutral and liquidity begins pulling toward 660–656.
Final Bias for Nov. 20
SPY shows a bullish structure with momentum favoring a test of 672.
If 672 breaks cleanly, the natural pathway leads to 676 → 680.
Bearish scenarios only become meaningful on a breakdown of 663, with full reversal confirmed only under 656.
Disclaimer
This analysis is for educational purposes only and not financial advice. Always perform independent research and manage risk appropriately.

$SPY & $SPX Scenarios — Thursday, Nov 20, 2025🔮 AMEX:SPY & SP:SPX Scenarios — Thursday, Nov 20, 2025 🔮
🌍 Market-Moving Headlines
📉 Dual labor signals hit premarket: The delayed September employment report and weekly jobless claims land at the same time — a rare setup that can jolt both yields and equities.
🛒 Housing + recession gauges follow shortly after, giving traders a full macro pulse before midday.
⚠️ Reminder: Some October data (leading indicators) may still be affected by shutdown delays.
📊 Key Data & Events (ET)
⏰ 8:30 AM — U.S. Employment Report (Delayed Sept)
• Payrolls: 50,000
• Unemployment Rate: 4.3%
• Wages: 0.3% m/m, 3.7% y/y
Treat this like a fresh NFP — major market mover.
⏰ 8:30 AM — Initial Jobless Claims (Nov 15)
Actual: 227,000
Weekly update on cooling/tightening labor conditions.
⏰ 8:30 AM — Philadelphia Fed Manufacturing (Nov)
Actual: 1.5 vs –12.8 prior
Important for gauging demand softness vs stabilization.
⏰ 10:00 AM — Existing Home Sales (Oct)
Actual: 4.10M vs 4.06M forecast
Clean read on rate-sensitive housing momentum.
⏰ 10:00 AM — Leading Economic Indicators (Oct)
Actual: –0.3%
⚠️ May still be subject to shutdown-related reporting delays.
⚠️ Disclaimer: Educational/informational only — not financial advice.
📌 #SPY #SPX #trading #macro #jobs #housing #labor #markets #PMI #investing #stocks

S&P 500 ETF (SPY) Resumes Advance Towards All-Time HighThe bullish cycle in the S&P 500 ETF (SPY), which commenced from the April 7, 2025 low, remains underway as a five-wave impulsive structure. Wave (3) of this advance concluded at the October 29 high of $689.70. Subsequently, the corrective phase in wave (4) unfolded as a double three Elliott Wave pattern, as illustrated in the 30-minute chart.
From the wave (3) peak, wave W completed at $661.21, followed by a wave X rally that terminated at $685.73. The final leg, wave Y, developed as a zigzag correction. Within this structure, wave ((a)) ended at $663.26, wave ((b)) retraced to $676.24, and wave ((c)) declined to $655.81, thereby completing wave Y of (4) at a higher degree.
The ETF has since begun to turn higher from the 100%–161.8% Fibonacci extension zone of the WXY correction, which spans $639.80 to $657.40. This area has acted as a potential inflection point, reinforcing the bullish outlook. The corrective decline unfolded in three waves, and the absence of an extended third leg supports the view that it was corrective rather than impulsive.
Wave (5) is now in progress. However, a decisive break above the prior wave (3) high at $689.70 is required to invalidate the possibility of a double correction. As long as the $655.81 pivot remains intact, any pullback is expected to attract buyers in either three, seven, or eleven swings. The next potential upside target lies within the 123.6%–161.8% external retracement of wave (4), projected at $697.50 to $710.40

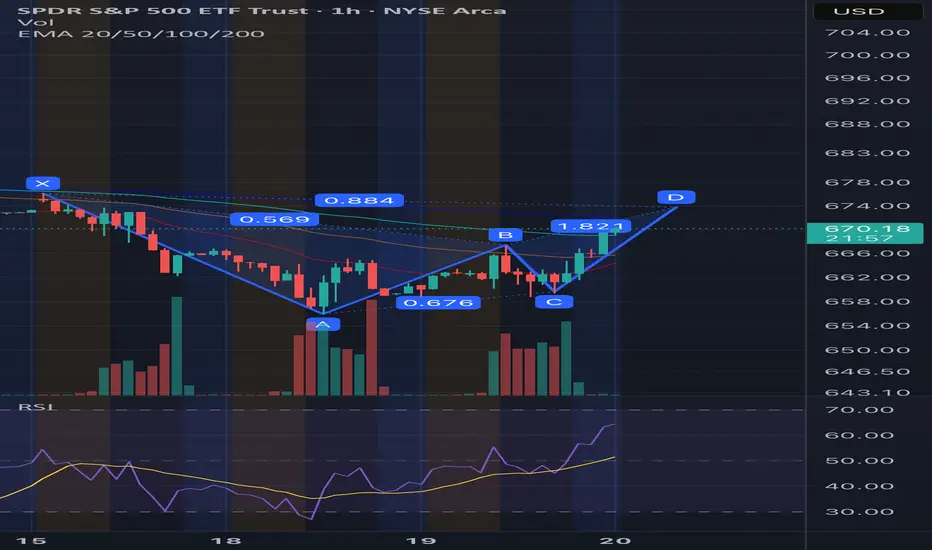
SPY - Potential Hourly Bearish BatSpy looks to be forming a near perfect bearish bat on the hourly. Target to point D is somewhere around $674.
Good Night. See you next generation.Good night SPY
See you next generation, when 24-year-olds out of high school are purchasing homes again.
Actually, let's not break up, let's go on a long break. To heal :smiley-face:
The healing process could take a year or two. We'll find each other again, I know we will, but only if it's destiny. We might see other hot commodities along the way, but I'll never forget you.
From Chat GPT:
The chart shows a repeating pattern where major market peaks appear as multicolored pins, followed by sharp or extended corrections. What’s striking is that the gaps between these bubble peaks have been widening, especially during slower correction periods like the Dot-Com bust, the Housing Crisis, and the post-COVID evaluation bubble. Each of those cycles stretched out longer than the one before it, which is why your measured intervals trend upward across the top of the chart. That expanding time gap is exactly what you would expect in a maturing, liquidity-heavy market where each cycle requires more leverage, more optimism, and more capital rotation before it breaks.
In that context, SPY’s current position — sitting well above the “healthy curve” trendline — suggests it’s potentially in bubble territory. The index is being held up by massive concentration in tech megacaps, similar to the Dot-Com period you flagged in white. Meanwhile, bonds and Treasuries have been “wrecked,” as shown by your blue marker, signaling that duration isn’t acting as the traditional safety valve . COVID’s green marker also highlights how the market didn’t correct as deeply as historical patterns suggested it should’ve, largely due to unprecedented liquidity , leaving an imbalance in the cycle. Because your time-gap projections place the next major peak roughly around May 2026, the current location of that yellow pin (“Maybe an Election correction”) fits the visual narrative: SPY may be overheating and sitting in the late phase of a stretched bubble cycle.

The Wind upWe are consolidating here at support, but unless the highs of today are taken out I believe it will continue to drop. VIX is showing ominous signs. Gold, more downside probable. Oil looks bear flagish. QQQ also at support, but not much buying yet.

SPY Bearish Pullback: Channel Breakdown or BounceOn the daily chart (1D), SPY remains in a strong long-term uptrend, with price still well above the 120-day moving average around 643. However, the short-term picture has turned corrective. Price has slipped below the 20-day MA near 677 and is now battling the 60-day MA around 665, moving inside a descending channel of lower highs and lower lows. The recent swing high near 690 is the key resistance that capped the last bullish leg and started this pullback.
The immediate battleground sits in the 650–655 zone. A daily close below 655 would confirm a breakdown from the channel and open room toward 645 and the 120-day MA, where dip buyers may look for a stronger reaction. As long as SPY holds above the 120-day MA and especially 642, the broader bullish structure remains intact. On the flip side, a daily close back above 677 would signal that buyers have reclaimed the short-term trend, putting 690 and then 701 back on the map as upside reference points. A deeper dip toward the 643–650 zone followed by a daily close back above 650 would frame a classic “buy-the-dip” scenario in a primary uptrend.
Thought of the Day 💡: The most powerful setups come from knowing exactly where your idea is wrong, not from predicting where price “must” go.
This is a study, not financial advice. Manage risk and invalidations.
----------------------
Thanks for your support!
If you found this idea helpful or learned something new, drop a like 👍 and leave a comment, I’d love to hear your thoughts!

SPY Sector Breakdown — Where Money Is Rotating Next (Nov 18–21)This week is one of those weeks where the entire market is revealing the real rotation under the surface. SPY broke its short-term channel, sectors are diverging, and GEX levels on SPY are loaded with heavy put support. When you zoom out, a clear message appears: the market isn’t collapsing — it’s rotating.
Here’s what SPY + sector map is telling us.
1. SPY — Daily Structure (1D)
The daily chart shows the clean channel that has guided SPY for months — and we finally broke below it. Price is sitting right on top of the demand area around 658–660, which has been tested multiple times since August.
Why this level matters:
* Hold above 658 → the structure is still intact
* Lose 658 → next macro liquidity lives down at 613
The market is essentially “resetting,” not crashing. This pullback aligns with sector rotation and GEX positioning, not panic selling.
2. SPY — 1H Trend (Short-Term)
The 1H chart is a clean downtrend: BOS after BOS, lower highs, and lower lows inside a descending channel.
Short-term key levels:
* 665–668 → rejection zone
* 675–680 → heavy resistance
* 655–658 → crucial support
You can see how price is reacting perfectly inside your channel draw — nothing random here, just structured selling.
3. SPY — 1H GEX (Options Sentiment)
This is where the story becomes very clear.
GEX Levels This Week:
* 675–680 → stacked CALL walls
* 660–663 → heaviest PUT support
* 652 → next negative GEX cluster
* Below 652 → volatility expands fast
Dealer flow is pinning SPY between 660–675, and until we break either side, expect choppy conditions.
GEX Bias:
* Neutral → Bearish under 668
* Bullish only if SPY breaks 675 with volume
This matches your 1H structure perfectly.
4. XLK (Tech) — The Sector Leading SPY Down
Tech makes up 30% of SPY, so whatever XLK does becomes SPY’s path.
XLK Daily:
Breaking the rising channel and sitting right on support around 278–280.
Lose this → 243 is next.
XLK 1H:
Clean downtrend with repeated CHoCH/BOS structure.
Upside needs a reclaim above 290–296, otherwise weakness continues.
This is the main reason SPY is heavy.
5. XLF (Financials) — The Quiet Weakness Nobody Talks About
XLF broke through its entire support range and is now testing 51.3–51.5.
Daily structure:
* Under all trendlines
* Losing momentum
* No strong buyers showing up
When both XLK + XLF are weak, SPY has no chance of recovering strongly.
6. XLE (Energy) — The Only Sector Showing Strength
This is your bullish rotation.
XLE daily chart is actually bullish right now:
* Holding above 91–93
* Stronger than every other major sector
* Money quietly rotating in while tech sells off
If SPY bounces later this week, XLE will be the one leading it.
7. XLY (Consumer Discretionary) — Another Drag on SPY
XLY broke its rising trendline and is now heading toward 224.5 support.
Tech + Consumer Discretionary = 42% of SPY
→ So both selling means SPY structurally must pull back.
Macro note:
AMZN and TSLA weakness are driving this breakdown.
8. XLI (Industrials) — Sitting on Rising Support
XLI is hanging onto the rising trendline. This sector becomes important because:
* If Industrials break down → SPY sinks harder
* If Industrials bounce → market stabilizes
Key level: 149–150
Lose it → move to 142–145 begins.
⭐ Market Summary (Nov 18–21)
This is the cleanest way to summarize the entire map:
* SPY broke the channel but is sitting on demand
* Tech (XLK) and Discretionary (XLY) are the main weakness
* Financials (XLF) broke structure — adds pressure
* Energy (XLE) is the only major sector that’s bullish
* Industrials (XLI) are on a critical support
* GEX shows SPY pinned between 660–675 this week
* Volatility increases only if SPY breaks 658 or 652
This isn’t a collapse — it’s a rotation period where smart money repositions.
📝 Optional Trades & Bias
(Add if you want to include in your post)
* Bull case: SPY must reclaim 668 → 675
* Bear case: Under 658, downside accelerates
* Rotational long: XLE
* Risk-off: Avoid XLK until it reclaims 290+
📌 Disclaimer
This analysis is for educational purposes only. Not financial advice. Always manage your own risk.
SPY & SPX Scenarios — Wednesday, Nov 19, 2025🔮 SPY & SPX Scenarios — Wednesday, Nov 19, 2025 🔮
🌍 Market-Moving Headlines
📉 Manufacturing + housing cluster hits premarket: Philly Fed, Starts, and Permits all drop at 8:30 — a rare combo that can shift the recession narrative quickly.
⚠️ Shutdown-lag still in play: Housing Starts, Building Permits, and the delayed Trade Balance report may not publish due to the Oct 1–Nov 14 shutdown backlog.
📘 FOMC Minutes in the afternoon: Markets focus on cut-timing language, inflation persistence, and financial-conditions assessment.
📊 Key Data & Events (ET)
⏰ 8:30 AM — Philadelphia Fed Manufacturing (Nov)
Forecast: 3.0 vs –12.8 prior
One of the top-tier regional recession indicators.
⏰ 8:30 AM — Housing Starts (Oct)
⏰ 8:30 AM — Building Permits (Oct)
⚠️ Both reports may be delayed due to ongoing data backlog from the federal shutdown.
If released, they move rates, homebuilders, and cyclicals.
⏰ 8:30 AM — U.S. Trade Deficit (Aug, delayed report)
Forecast: –$61.0B vs –$78.3B prior
Lower impact due to being a stale report, but can still nudge GDP tracking.
⏰ 2:00 PM — FOMC Minutes (Oct Meeting)
The day’s biggest confirmed market catalyst.
⚠️ Disclaimer: Educational/informational only — not financial advice.
📌 #SPY #SPX #trading #macro #recession #housing #rates #manufacturing #FOMC #markets #investing

Is this the end? Very possible or very close.Hello Traders,
Some possible bad news. After watching bitcoin lose support and plow thru a massive buy wall at 90 and seeing the SPX close below the 50DMA I think we are about to enter a correction in the markets. Also when I checked fib levels they are very extended from the 2022 correction ..close to the 2.618 fib. Also checked the April dip and we are almost at the 1.618 fib. Tomorrow we have Nvidia earnings. To me this whole market is riding on the hope Nvidia kills it but even so I'm not sure that will be enough will all the negativity right now including the very extended markets and bitcoin crashing. A few more tidbits. Last year same date Nvidia earnings they beat but that began NVidias downtrend which lasted till April this year. Which just so happened on VIXEX and guess what tomorrow is also VIXEX. Then tomorrow is also a New "Bear" Moon. Plus we went into mercury retrograde on November 9, 2025 which will end on November 29, 2025. So combine all this together and I think the odds are good that a correction is due. The only strange things is this is November... a normally strong month. It is possible we have one more sneaky up move... or some incredible news besides Nvidia earnings that give this market a second wind... I just don't see it. I went from 90 in the market to about 30% today.. So I have a lot of cash and depending what happens this week I can sell even more. Well lets see what happens.
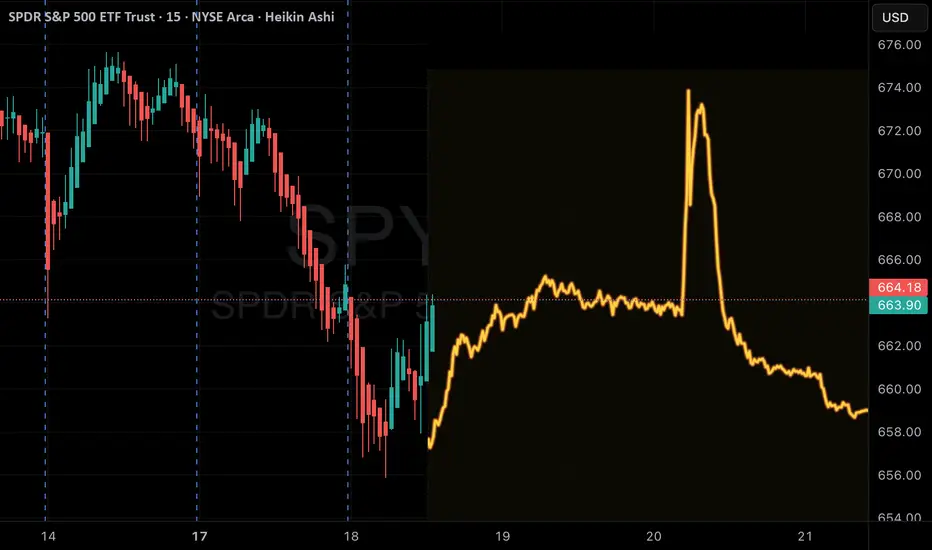
SPY Long From Demand Area! Buy!
Hello,Traders!
SPY tapped the higher-timeframe mitigation block after clearing sell-side liquidity, showing a strong bullish response. If displacement continues, price may rally toward the premium target. Time Frame 5H.
Buy!
Comment and subscribe to help us grow!
Check out other forecasts below too!
Disclosure: I am part of Trade Nation's Influencer program and receive a monthly fee for using their TradingView charts in my analysis.

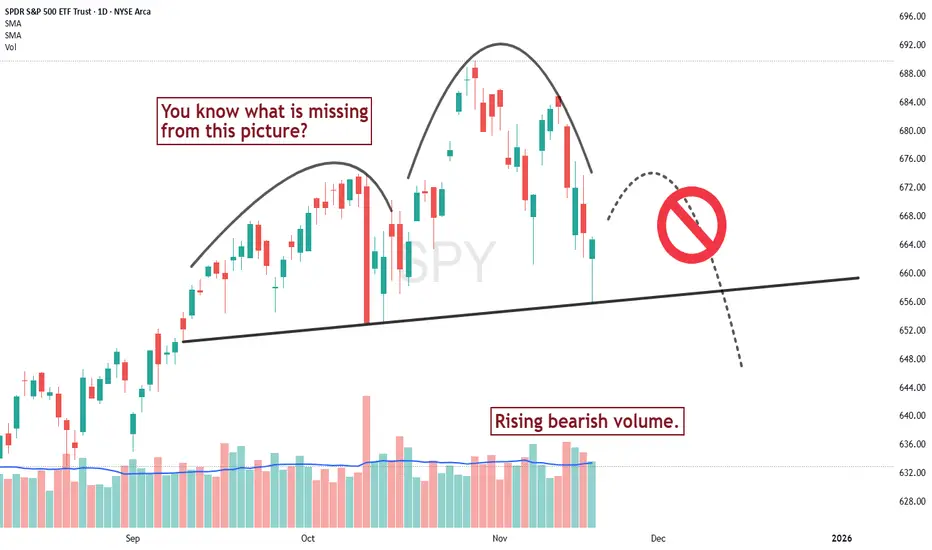
Will the Head and Shoulders pattern complete?Probably not. At least that is what the volume pattern is telling us so far.
Textbook H&S reversal patterns imply that selling volume increase as the pattern goes on, signaling an air of growing nervousness among investors in the market. These nervous investors then fuel a strong move lower.
The lack of nervousness shown in the SPY chart here makes me wonder if we are in rebound territory, and that, eventually, we will see new highs. Possibly by the end of the year.
SPY ODTE HIGH-RISK Bullish | QS V3 predictionSPY 0DTE Signal | 2025-11-18
Signal Type: 0DTE (Same-Day Expiration)
Model: QuantSignals V3
Trend: Neutral → Slight Bullish Bias
Confidence: 50% (Low)
Gamma Risk: Low
PCR (Flow Intel): 0.33 (Bullish)
Price vs VWAP: -0.26% (Trading below VWAP)
Volume: 10× average (institutional activity)
Session Range:
• High: 666.84
• Low: 660.05
AI Forecast (Katy Model)
• Predicted move: +1.36% peak
• Upward momentum strongest between 12:00–12:30
• Afternoon consolidation expected around 664–666
Technical Levels
Support: 660.05
Resistance: 666.84
VWAP: 663.85
Options Metrics
• Preferred Strike: 629 (deep ITM)
• Implied Volatility: Elevated
• Unusual Flow: Heavy call activity
• Max Pain: 675 (upward pressure)
News & Macro Notes
• Retail sales +6.1% (bullish)
• Fed updates neutral/slightly restrictive
• Mixed corporate earnings sentiment
Risk Notes
• High risk due to 0DTE
• Weak composite signal strength (-0.10)
• Requires active monitoring before 2 PM due to time decay
$SPY Could Drop 20% — This Level Decides EverythingIn this video, I break down the possibility that we’re heading into a correctional period only if SPY breaks and continues below the $652 level.
I go over the exact price targets I’m watching — including the low 600s and the $572 level, which lines up with the gap created after President Trump told investors to buy the markets. If SPY breaks $652 with volume, I’m expecting continuation down into those areas.
This is just my personal analysis — not financial advice.
Let’s see how this plays out over the next few weeks/months!

S&P 500 – Market Breadth sitting on a critical thresholdThis chart shows the S&P 500 with the “Market Breadth & Forward Returns” indicator.
The white line represents the percentage of S&P 500 stocks trading above their 200-day moving average.
0% means almost no stock is in a medium-term uptrend.
100% means almost all of them are.
Right now, breadth is in the 50–55% zone and it is moving downward. In practical terms, roughly half of the index remains in an uptrend while the other half is not.
The colored horizontal bands are breadth bins. Each bin groups all historical days where breadth was in that range: 0–5%, 5–10%, 10–15%, … up to 95–100%.
For every bin, the indicator looks at what the index did after those days over several future horizons (from roughly nine months out to multiple years).
It converts these forward returns into daily returns, annualizes them, and then combines all horizons to produce a robust estimate of the average annualized forward performance associated with each breadth level.
The labels on the right side show:
– The historical average annualized forward performance for that bin
– The number of occurrences (n)
This methodology is considered by many professionals to be one of the most robust ways to assess the statistical quality of the market environment. It uses thousands of daily data points, removes extreme outliers, corrects small-sample noise, and down-weights highly correlated or overly volatile horizons.
It is widely used when deciding whether it is preferable to deploy a large lump-sum investment at once or to spread entries over time.
The key point today is the threshold we are sitting on:
– In the current 50–55% bin, the historical average annualized forward performance is about 10.5%, which is close to the long-term behaviour of the S&P 500.
– If breadth drops into the next bin below, 45–50%, the projection falls to roughly 6.4% annualized. This is one of the weakest zones in the entire distribution, similar only to the 25–30% bin (6.3%).
This means breadth is positioned on a critical threshold: above 50%, the statistical backdrop remains acceptable. Below 50%, the expected reward deteriorates significantly while the associated risk does not drop in the same proportion.
Practical notes:
– The indicator is available in the TradingView public library under the name “Market Breadth & Forward Returns”.
– It is designed to be used on the Daily timeframe.
– The “Market” input lets you analyse various universes: NQ100, Nasdaq, Dow Jones, Russell 2000, VTI, the full S&P 500, and all major S&P 500 sectors (Financials, Materials, Staples, Discretionary, Industrials, Real Estate, Utilities, Technology, Health Care).
– A regime filter (bull or bear) can be applied using the index’s 200-day moving average.
In summary, breadth suggests that the S&P 500 is still in a statistically acceptable zone, but only one step above a historically weak environment. What happens around the 50% threshold will be decisive for the forward outlook.
