TTD: AdTech Giant Amid #Altseason Buzz? $72 in Sight?TTD: Undervalued AdTech Giant Amid #Altseason Buzz? $72 in Sight? Price at $49.64 (+4.33%), tied to Q2 earnings beat and crypto ad surge on X/Reddit, undervalued with 53% upside to targets, questioning if data growth sparks rally.
Fundamental Analysis
EPS $0.83 TTM, revenue growth 23.18% TTM, expected EPS growth 40.25% 5Y, P/E 56.12; Graham formula IV $74.76, PEG 1.39 (near 1, undervalued per Lynch on growth), DCF suggests moat in programmatic ads; incentives align management with revenue beats, inversion highlights competition risks.
Positive:
18.2% 5Y revenue forecast.
Strong cash $1.69B.
Negative:
Volatility 7.2%.
Short-term sell signals.
SWOT Analysis
Strengths: Leading platform, high moat via data.
Weaknesses: High beta 1.08.
Opportunities: #Crypto ad expansion.
Threats: Market slowdowns.
Technical Analysis
Rebound from lows, neutral rating. Price: $47.14, VWAP N/A. Key indicators: RSI: 35/selling pressure.
MACD: Level (12,26) N/A.
Moving Averages: 5-day DMA 44.84.Support/Resistance: 43.79/45.27. Patterns/Momentum: Buy signal short-term. Bullish | Bearish. Scenarios and Risk Management Bullish: Break $45, DCA for $72 on earnings; second-order thinking sees ad surge amplifying gains.
Bearish: Below $43.79.
Neutral: Range trading.Risk Tips: Stops 5-10% below, diversify 5%, DCA dips.
Conclusion/Outlook
Bullish if growth sustains, lollapalooza from #Altseason boosts upside. Watch Q3 earnings. Fits adtech theme with #Crypto upside. Take? Comment!
TTD trade ideas

bullish on $ttd, potential bottom inbullish on NASDAQ:TTD , potential bottom in
- price fall down to 2020 level, 5 year of chips wiped out
- in key multi-year support zone
- weekly volume surging
- RSI/MACD bullish divergence

TTD | Reversal Setup in PlayTTD – Reversal Setup in Play
Seeing a triple bottom pattern forming on the charts, with strong divergence on the daily/weekly and price sitting in oversold territory. Technically this looks like a solid reversal zone.
Fundamentals also line up:
Digital ad spend & programmatic growth remain strong tailwinds.
Earnings momentum and improving margins support upside.
Risks (macro headwinds, gov. shutdown, ad-spend cycles) still exist — but if markets hold steady, I expect a move higher from here.

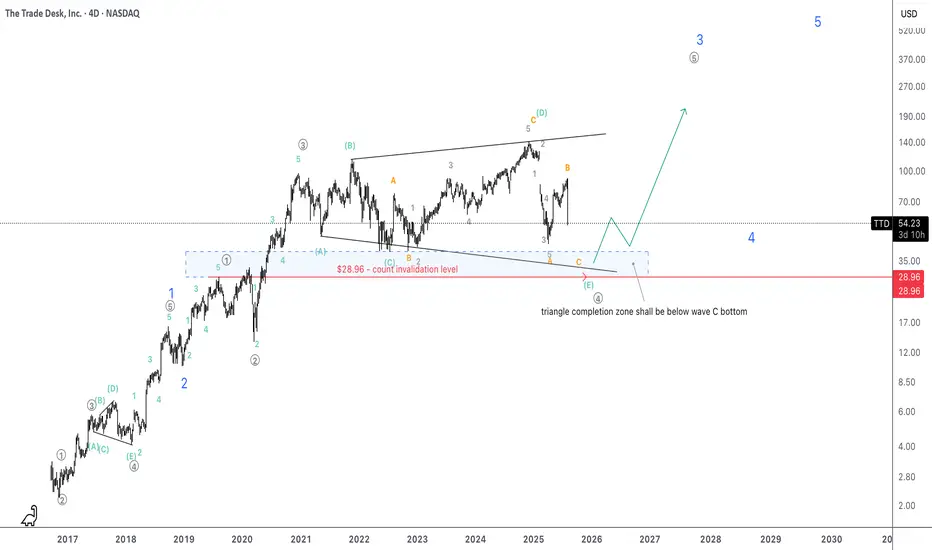
TTD poised to take off as expanding triangle completesIt is magnificent how the current triangle proves EW fractal aspect since there was an expanding triangle at the same wave degree within blue wave 1.
I'd put SL at around $29 where grey 4 (with the current triangles wave E) would overlap grey wave 1.
Magnitude of the unfolding grey wave 5 might be immense if this count is correct.
Short term, TTD, obviously goes further down to complete wave E and I will start buying in the blue area and in the mean tome will monitor 5 wave structure of C of E.
Trading $TTD to the trendline with 50c exp 11.21Support and Resistance Zones
Next Week (Short-Term)
Immediate Support : The most critical support zone is between $43.10 and $46.20. This is the low from March/April and the current price level. Holding this area is paramount for any bullish case.
Immediate Resistance : The first level of resistance is the breakdown area around $55.00. A move back above this level would be the first sign of stabilization.
Next Month (Medium-Term)
Major Support : If the $43.10 level fails to hold, there is little visible support on this chart, suggesting a potential for a significant further decline.
Major Resistance : The primary resistance is the long-term descending trendline, which will be approximately $85-$90 in the coming month. The August peak of $94.90 also serves as a major horizontal resistance.

TTD crashIn the long term, this stock is in a side cycle and after seeing the top, it starts moving towards the bottom and goes through the natural market cycle, but very fast and intense.
The first support area for this stock is $48-50 and if it encounters strong buyers, it will move towards $69 and after correction to $125-127.
But if the bottom area is broken correctly, the target of this big and fast drop will be a price return to 19.
Be with me to enter and exit on time
Every boost and follow is a double motivation to continue

TTDGap range between $56.95 and 87.39. mid target around 0.5 fib level. High target at gap close. RSI at 33.57 marking an under valued stock price. Entry at 46.08 rebound.

A TTD Trade for the Long-Term BullCore Thesis: The Open Internet's Champion
The bull case for The Trade Desk is centered on its position as the leading independent demand-side platform (DSP) in a digital advertising landscape that is rapidly consolidating into "walled gardens" controlled by tech giants like Google, Meta, and Amazon. As advertisers demand greater transparency, control, and performance from their ad spend, The Trade Desk's open, data-driven platform is a highly differentiated and increasingly essential solution.
The recent stock price decline, triggered by news of the Amazon-Netflix partnership, is seen by bulls as an overreaction that has created a generational buying opportunity. It has obscured the company's fundamental strengths and its long-term growth trajectory.
Key Pillars of the Bull Case
1. Leadership in High-Growth Advertising Channels
Connected TV (CTV) Dominance
Pioneering Retail Media
2. A Superior and Differentiated Technology Platform
UID2.0 as the New Open Standard
AI-Powered Optimization
3. Strong Financial Health and Analyst Consensus
Robust Financial
Positive Analyst Sentiment
Trade Idea:
Strategic Averaging Trade Idea for TTD
This strategy is for a long-term bullish investor who believes the current price is an overreaction and wants to buy at key support levels to lower their average cost. The new price points you provided—$36.58 and $29.62—align with deeper support levels on a chart.
Green Arrow 1 (Entry): If the price continues to fall place a buy order at a lower historical support level. This is a level where the stock has previously found a bottom. Your provided price fits well as a key support level.
Price: $36.58
Green Arrow 2 (The Average Down): This is the buy at maximum fear. This is the final and largest portion of your position, placed at a deeply discounted price point that would signal a severe market capitulation. Your provided price is a perfect fit for this level, as it would be below any recent lows.
Price: $29.62
Red Arrow (Exit Points) 🔴
The "red arrow" is where you exit the position to take profits. This point is a major resistance level where the stock's rally is likely to face significant selling pressure.
Exit Strategy: Your exit is a major resistance level where the stock previously traded before the recent sharp decline.
Price: $54.00 - $83.00

TTD could return 200% in the next yearsThe Trade Desk is this big American tech company that basically helps advertisers buy digital ads in a super smart, automated way. They run a platform (called a DSP, or Demand Side Platform) where brands and agencies can set up, manage, and optimize their ad campaigns across tons of channels—like websites, mobile apps, streaming TV, audio, you name it. They’re pretty much the biggest independent player in this space, competing with giants like Google and Amazon.
Now, about the stock crash ,things have been rough lately. Their share price tanked, and here’s why:
First off, their latest financial results were kind of a letdown. For the first time in over eight years , they didn’t hit their own revenue targets. Investors hate surprises like that, so the stock dropped hard, almost 30% in a single day.
On top of that, they’ve been rolling out a new AI-powered platform called Kokai, but apparently, there were some hiccups with the launch. The company admitted they messed up a bit on execution, which didn’t help investor confidence.
Another thing: their stock had gone up a ton last year, it more than doubled at one point. So when the results disappointed, people freaked out and started selling. The valuation was super high, and the market just corrected itself, wiping out a huge chunk of their market cap.
There’s also some bigger-picture stuff going on.
The ad industry is getting more competitive, with Google and Amazon pushing hard, and there are worries about the economy slowing down. Plus, new privacy rules and regulations are making things trickier for digital ad companies in general.
All this led to a bit of a panic, with people selling off their shares and the price dropping even more because of technical trading stuff.
Fortunately, the price stopped near the previous lows where there is a major support and this could be a masive opportunity for mid to long term investors seeking a low risk entry with a +200% returns opportunity. A Stop Loss under the supports would be fine to keep your money safe.
In short, The Trade Desk is still a major player in digital ads, but they hit a rough patch because of disappointing results, some mistakes with their new tech, and a reality check on their sky-high stock price. Some people still think they’ll bounce back if they fix these issues, but for now, it’s been a wild ride!

$TTD Bears in Control, Can Bulls Defend Support?Trend: Weekly chart shows a strong downtrend since the 2024 peak. Price is struggling below major moving averages (EMA cluster overhead).
Support: 44- $45 is key structural support. A deeper breakdown opens risk toward $30.
Resistance: Upside hurdles at $55 and $63 before any trend reversal can be considered.
Momentum: RSI near 38, hovering above oversold but weak. No clear bullish divergence yet.
Bias: Stock needs to reclaim $63.74 for a sustainable bounce. Failure to hold $43-45 support could accelerate downside.
For now, bearish bias remains dominant, with risk of lower lows if support cracks. Bulls need a strong bounce above $55+ to confirm reversal potential.

$TDD calls? Bounce to $50-60+?I bought some TDD calls as it looks like this stock has finally bottomed. The stock has been falling since early August, and fell another 12% yesterday which to me looks like capitulation.
I could see a move from here back up to the 50 - $60 range or so (and can potentially go higher).
I've marked off key levels on the upside.
Let's see how it plays out.

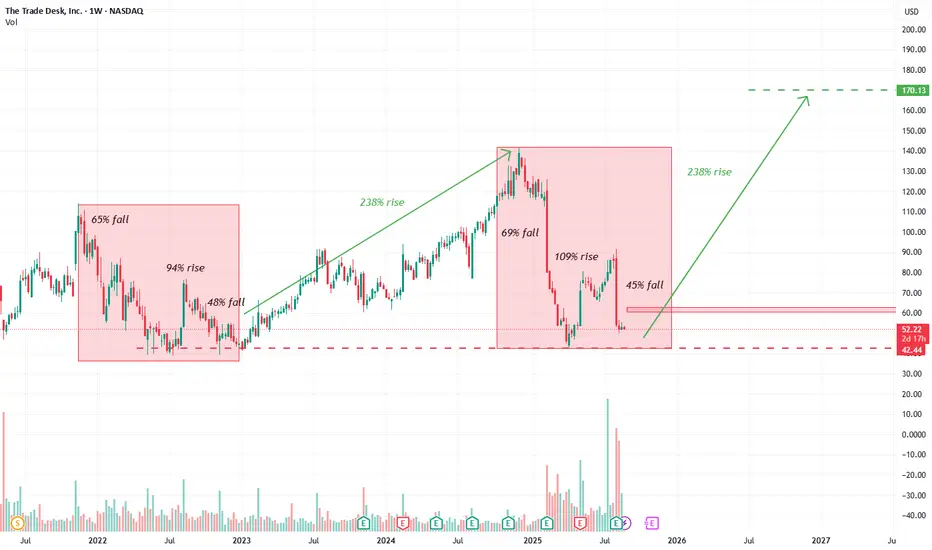
TTD seems to be following its historic pattern. TTD had followed the drop of 69% followed by 90% share rise and 38% drop in 2020 . Following with that we are experiencing similar pattern in 2025. If TTD Follows the historic pattern we can anticipate a more than 200% rise in the price with new ATH in TTD with price $170.
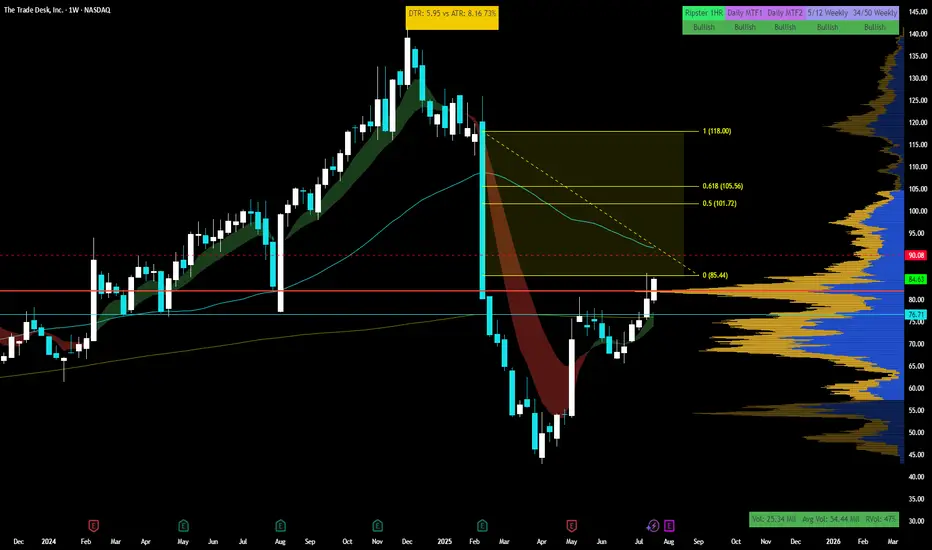
$TTD is ready to move into triple digits - Lock n load Pretty straight forward in the face setup.
Here are pros-
+Got added to s&p500
+massive volume shelf from multi year above 80 which we are above
+beautiful gap from q1 2025 to ride from $85 to $120
++Relative strength strong vs spy for 55 period(thats what I use)
+++ $100 Psych level is a MAGNET - it will pull !!
cons-
-200sma above that cleanlu aligns with a multi month resistance and 0.5 fib from ATH to bottom in april 25
-- If software earnings are poopy then definitely bumpy ride up but all software names and cybersecurity names are all having good chart pattenrs meaning earning is good for q2 and all want to pop
How to play-
+Sized up and risk that gap below neat 21ema
+take 60% off at 200sma + watch behavior if flags next day add back in else ride to the 0.5 fib in the gap
+take 30% off at $100
+ride the rest to $120 or untill 21 breaks
(IF IF IF 9ema holds steady then keep runners)
Today is 7/23/2025 so lets see what tomorrow brings- Good luck if get on the train but manage risk first everything else later !
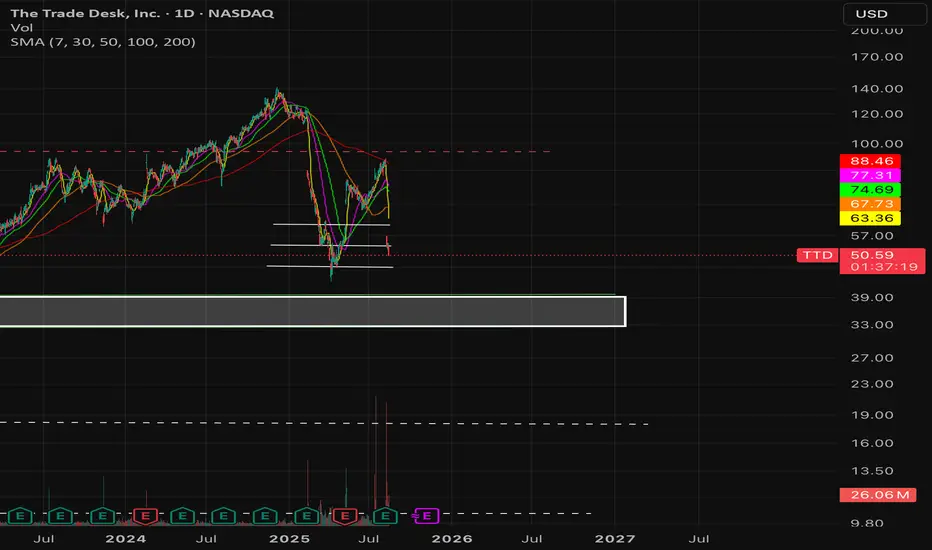
I'm ready to size up TTDIf you've been following me you know i've got TTD at a good price. I'm ready to size up position if we get a sell off in the next few weeks. The 9 take profit is coming up, sell could come sooner, but i'm looking for a test of previous levels (green horizontals) before the next leg up. I also continue to passively DCA into this.

Multiple Compression of $TTD- NASDAQ:TTD is no longer the high flying market darling
- Growth has been coming down from high 30s to 20s and now to high teens. This calls for lowering multiple
Fundamentally,
Year | 2025 | 2026 | 2027 | 2028
EPS | 0.82 | 1.09 | 1.41 | 1.89
eps% | -49.61% | 32.28% | 29.08% | 34.47%
- This year eps is negative and in the future it's growing again therefore 2025 is a good year to accumulate NASDAQ:TTD at or close to fair value.
- A company growing eps 30%+ deserves a forward p/e of 30 as a base case
- Fair stock value (base case) with forward p/e of 30
Year | 2025 | 2026 | 2027 | 2028
fair value | 24.6 | 32.7 | 42.3 | 56
- Fair stock value (bull case) with forward p/e of 40
Year | 2025 | 2026 | 2027 | 2028
fair value | 32 | 43 | 56 | 75
- Fair stock value (bear case) with forward p/e of 20
Year | 2025 | 2026 | 2027 | 2028
fair value | 16 | 21 | 28 | 37.8
- Personally, I have started accumulating but ideally want to add significantly in that accumulation box I have highlighted in the chart.
- Note: I have linked my old posts where I shorted NASDAQ:TTD and went long NASDAQ:TTD
Breakout in process?Have been ranging, slight pullback and curl up at close.
If we break im looking for a test of the red line.
If that happens stop loss set.
Would like to close with profit and enter again at a retest of range top.
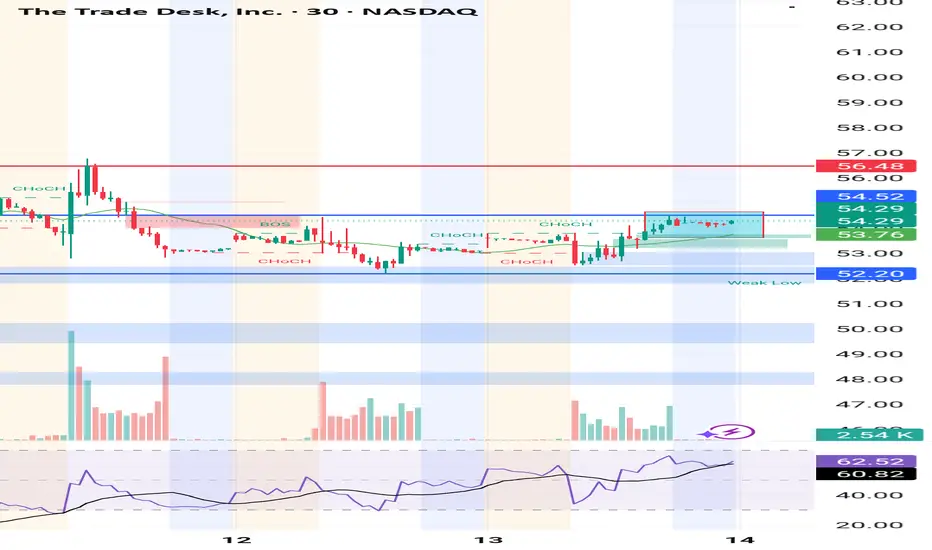
TTD is giving a second chance A few days ago, we mentioned that NASDAQ:TTD could have reached a great buying level around the $44 area. After a recent rally, we’re now seeing a typical bullish continuation pattern. If the flag breaks to the upside, you’ll have a new opportunity to join the upward move.
Once again, a tight stop loss (SL) of 3–4% gives you the potential for a 30% rally. It’s important to consider taking profits before the $100 level, where we see major resistance.

TTD Oversold Bounce Play — Call Option for Next Week🔥 TTD Oversold Bounce Play — Call Option for Next Week**
The Trade Desk (TTD) is deep in oversold territory (RSI daily 19.6, weekly 33.4) with 3.7x volume surge last week — signaling heavy institutional activity. While the macro bias leans bearish, a speculative bullish flow (call/put ratio 1.42) hints at a potential short-term rebound.
**🛠 Trade Setup:**
* **Instrument:** TTD
* **Direction:** CALL (LONG)
* **Strike:** \$59.00
* **Expiry:** 2025-08-15
* **Entry Price:** \$0.60
* **Profit Target:** \$1.20 (2x gain)
* **Stop Loss:** \$0.36
* **Size:** 1 contract
* **Entry Timing:** Market open
* **Confidence:** 65%
**📊 Key Factors:**
* Extreme oversold conditions
* Surge in weekly volume
* Speculative bullish options flow
* Risk of counter-trend move against broader bearish trend
**⚠ Risks:**
* Strong longer-term bearish momentum
* Low open interest = high volatility in premiums
---
**#TTD #TheTradeDesk #OptionsTrading #CallOptions #WeeklyOptions #OversoldBounce #BullishSetup #RSI #TechnicalAnalysis #TradingView #VolatilityPlay #SwingTrade #OptionsStrategy**

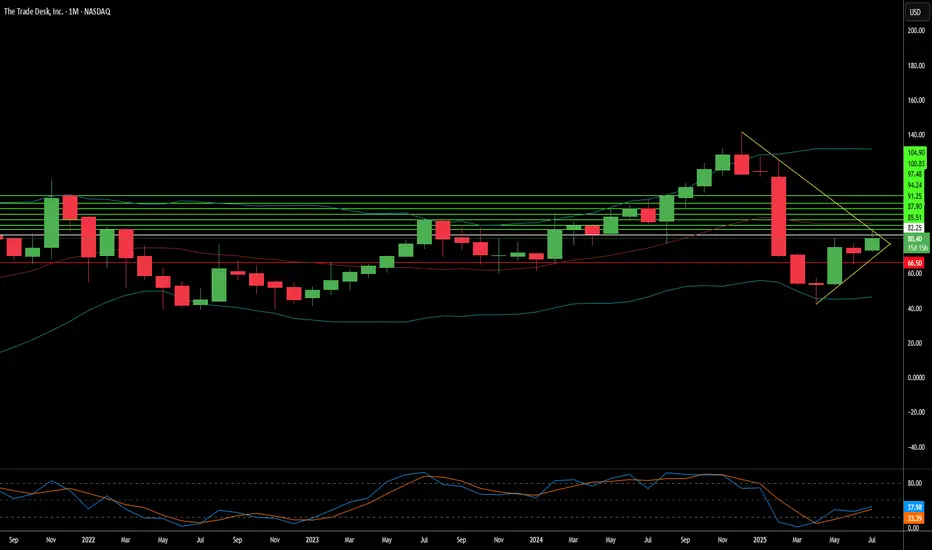
breakdown of TTD monthly chartPotential Target Levels
If bullish momentum continues:
First target: $60.09 (minor resistance before 0.382 Fib)
Second target: $64.51 (Fib 0.382 + close to SMA 20)
Third target: $74.89 (Fib 0.5, major resistance zone)
Extended target: $86.93 (Fib 0.618)
If bearish reversal occurs:
Support 1: $53.64 (Fib 0.236 + SMA 100)
Support 2: $50.70–$49.99 (SMA 50 zone)
Support 3: $41.20 (recent swing low)
Given the monthly chart setup, a close above $60.09 with volume could open the door for $64.50+ as the next leg up. But if it fails to hold $53.60, downside pressure may retest the $50 area.

TTD Dropping HaRd / NoT DonE!Because the universe said so... We must be patient, unless executing B Wave for profit.
Note:
40% in oNe DaY!

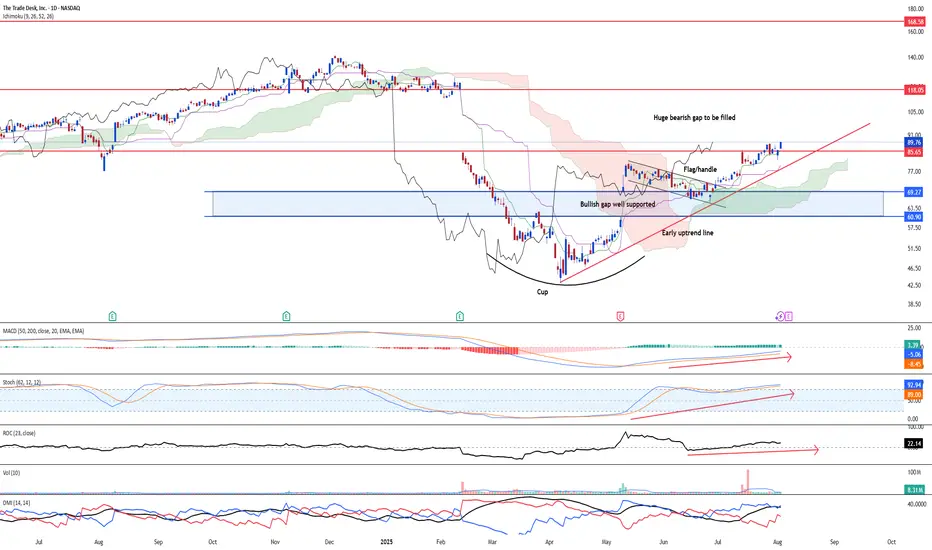
Attempting to fill up the huge bearish gap - TTD USNASDAQ:TTD has formed a bullish cup and handle and it is confirmed after the stock has broken above the flag/handle. Currently, the stock has closed above the first gap resistance line at US$85.65. Ichimoku shows a clear three bullish golden cross.
Momentum is strong over the long-term after MACD histogram remain positive. Stochastic oscillator has also risen steadily. Directional movement index is strong on the bulls.
Target is at 180.00 over the longer-term period.
The 5 different types of Professional TradersLearn what each professional trader group trades, how they trade, when they trade and why they trade.
There are:
Sell Side Institution Floor Traders
Buy Side Institution Floor Traders
Proprietary Desk Traders (prop)
Specialist Professional Traders
Independent Professional traders.
Each type of professional trades differently. Each has a different agenda for trading a particular stock.
Sell Side Floor Traders trade short term to generate income for the big Money Center Banks.
Buy Side Floor Traders are long term investors for mutual funds and ETFs and other derivatives and manage the quantity of shares held for all of the 4000 -6000 stocks their Buy Side company is holding.
Specialists usually are trading one stock or an industry.
Independent Professional Traders trade at home for themselves. Most are former Sell Side floor traders. This group is growing in numbers as more floor traders opt to go rouge and trade for themselves.
You need to learn how to identify which professionals are in a stock with tells you the intent of the trade and the probable hold time.
Learn to trade with the professionals rather than against them.

The Trade Desk: Why the Sudden Surge?The Trade Desk (TTD) recently experienced a significant stock surge. This rise stems from both immediate market catalysts and robust underlying business fundamentals. A primary driver was its inclusion in the prestigious S&P 500 index, replacing Ansys Inc. This move, effective July 18, immediately triggered mandated buying from index funds and ETFs. Such inclusion validates TTD's market importance and enhances its visibility and liquidity. This artificial demand floor, coupled with TTD's $37 billion market capitalization, underscores its growing influence within the financial landscape.
Beyond index inclusion, TTD benefits from a significant structural shift in advertising. Programmatic advertising is rapidly replacing traditional media buying, expected to account for nearly 90% of digital display ad spending by 2025. This growth is driven by advertisers' need for transparent ROI, publishers avoiding "walled gardens" through platforms like TTD's OpenPath, and AI-driven innovation. TTD's AI platform, Kokai, greatly lowers acquisition costs and enhances reach, resulting in over 95% client retention. Strategic partnerships in high-growth areas like Connected TV (CTV) further reinforce TTD's leadership.
Financially, The Trade Desk demonstrates remarkable resilience and growth. Its Q2 2025 revenue growth of 17% outpaces the broader programmatic market. Adjusted EBITDA margins hit 38%, reflecting strong operational efficiency. While TTD trades at a premium valuation - over 13x 2025 sales targets-its high profitability, substantial cash flow, and historical investor returns support this. Despite intense competition and regulatory scrutiny, TTD's consistent market share gains and strategic positioning in an expanding digital ad market make it a compelling long-term investment.