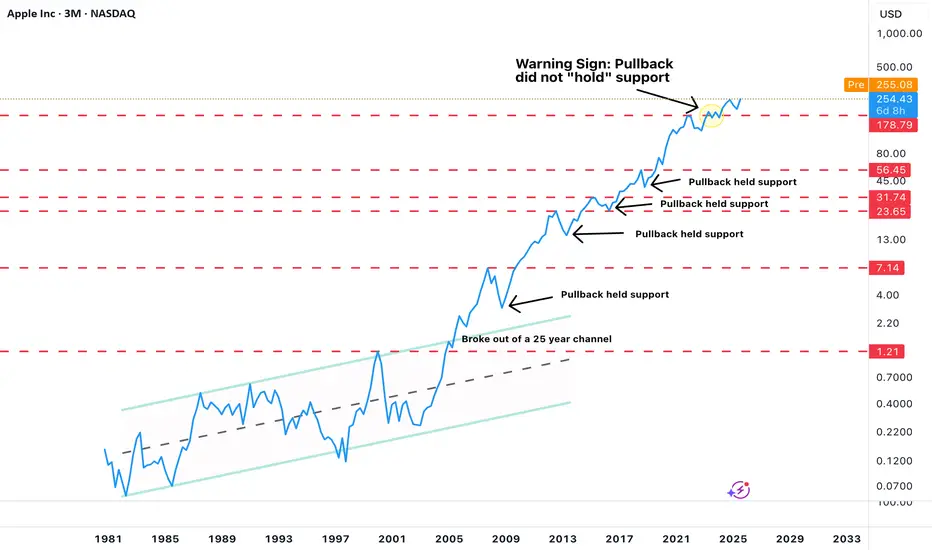
Apple Shares (AAPL) Close to Reaching Record HighApple Shares (AAPL) Close to Reaching Record High
On 10 September, we noted that following the launch of new products — including the iPhone 17 — AAPL shares had fallen by approximately 1.5%, as analysts considered the model lacked the breakthrough appeal necessary to drive further growth.
However, two weeks on, media reports point to strong demand for the new product range, highlighting that:
→ orders for the new devices exceed those for last year’s iPhone 16 series;
→ Apple has asked suppliers to increase production;
→ the base model, featuring the long‑awaited 120Hz display and the powerful A19 chip, is in especially high demand.
Positive reports of long queues at Apple Stores worldwide, along with extended delivery times — which Bank of America estimates at an average of 18 days compared to 10 days for last year’s model — have only bolstered bullish sentiment. AAPL shares are rising this week, even as broader market indices are falling.
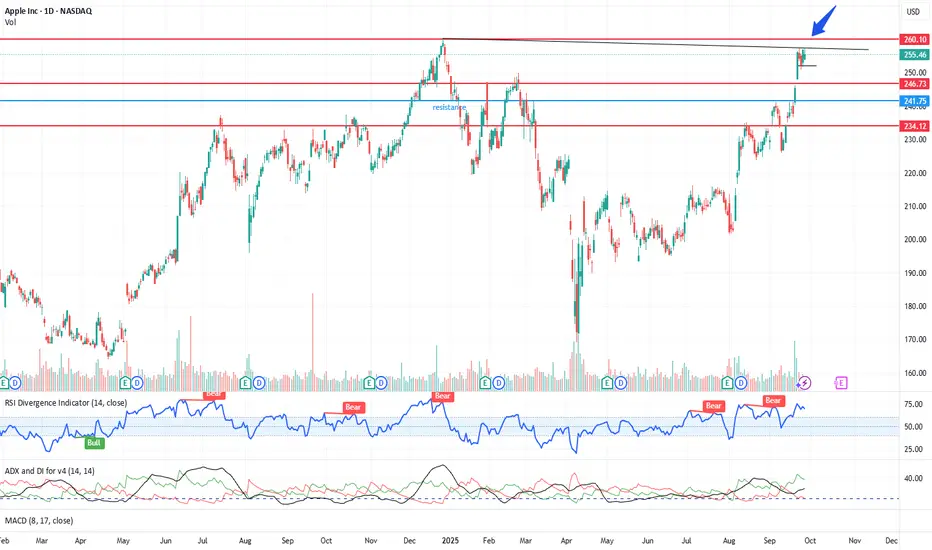
Technical Analysis of Apple (AAPL) Shares
AAPL stock price movements in 2025 form a broad ascending channel (shown in blue). In this context:
→ Until early August, the price remained in a consolidation phase (shown by black lines) below the channel’s median;
→ Since then, the balance has shifted in favour of buyers — the price has demonstrated bullish momentum, forming a steep growth channel (shown in orange), with the median providing support (indicated by an arrow).
The strength of demand is confirmed by AAPL’s price action rising from $240 to $250:
→ bullish candlesticks were wide;
→ closing prices were close to the highs;
→ a bullish gap is visible on the chart.
This points to a buyers’ imbalance, giving grounds to regard this area as support in terms of a Fair Value Gap pattern.
From a bearish perspective:
→ the RSI indicator is in overbought territory;
→ shareholders may wish to take some profits.
Nevertheless, it cannot be ruled out that AAPL’s price growth will continue, driven by expectations that strong demand for the iPhone 17, as well as the updated Apple Watch Series 11 and AirPods Pro 3 with new AI features, will deliver record quarterly revenue for the company, covering the upcoming holiday season. In this scenario, bulls may target the upper boundary of the blue channel.
This article represents the opinion of the Companies operating under the FXOpen brand only. It is not to be construed as an offer, solicitation, or recommendation with respect to products and services provided by the Companies operating under the FXOpen brand, nor is it to be considered financial advice.
AAPL trade ideas
Apple Stock Supported by Earnings Strength and New ProductsApple Inc. (AAPL) is currently trading around $256.93, up 1.35% in the latest session. Following a strong rally, AAPL remains supported by both technical signals and macro factors. On the technical side, $257 is acting as a key resistance; a breakout above this level could open the way toward $260 and even $270. Meanwhile, the $250 zone continues to serve as strong support, providing a solid base for the uptrend. Ichimoku Cloud shows AAPL holding above the Kumo, reinforcing the bullish outlook, while Fair Value Gaps (FVG) from previous price action also offer potential support areas during pullbacks. Trading volume has increased notably, reflecting positive inflows into the stock.
On the news front, Apple has delivered robust financial results, with revenue and profit growth driven by iPhone, MacBook, Apple Music, and the App Store. Growth prospects are further supported by continuous innovation, particularly the launch of Apple Vision Pro and developments in AR/VR, which are expected to drive future revenue. Additionally, with the Fed likely to maintain or lower interest rates, tech stocks continue to benefit, with Apple standing out due to its strong financial foundation and relatively lower risk compared to peers.
With global demand for high-tech products rising, AAPL continues to act as a blue-chip safe haven for many investors. Overall, its uptrend remains intact. In the short term, the stock is likely to retest $260, and if surpassed, the next target would be $270 as market sentiment stays optimistic.
Hope The Apple Doesn't Rot The Fall of The Big Apple
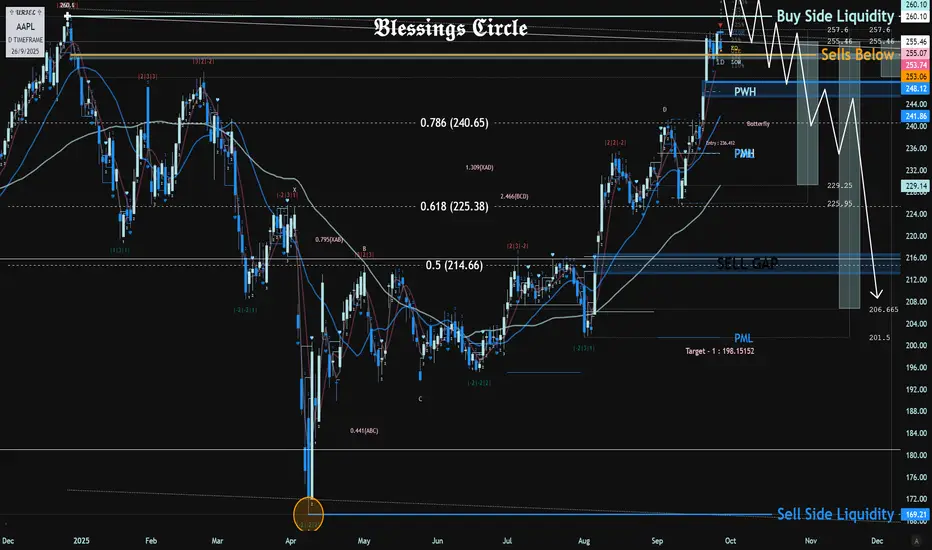
Watching For AAPL to Potentially Trade into 260.10 This Week.
If 260.10 Does Trade I Will Be Looking To Short & Actively Scale into Sells Up Until 265.
If AAPL Were To Squeeze Above 265, The Sells Thesis Would Be Null.
First Sells Target Would Be Into The Sell Gap @ 248-245.
Second Sells Target Would Be The Second Sell Gap @ 216-212.
Third Sells Target Would Be The April Wick Low @ 169.21.
We Can Fall Potentially Fall As Low As 100 or Maybe Even Lower, but Majority If Not 100% of My Sells Positions Will Be Scaled Out Into The Above Sells Targets.
Good Luck To All Traders Going Into The Month Of October & Start of Q4.
With NFP on Friday to Finish off The Week Make Sure To DE Risk If Long.
Watching for an opportunity to short AAPLI don't short often because (for me and most traders) it's a rather hard trade to execute properly and hold for a little bit.
I was going through quarterly stock charts for long ideas and couldn't help but see that in 2023 & 2024 AAPL could not hold "closing" support after what would have been considered a "normal" pullback in 2022. Throw in Berkshire Hathaway selling 69% of it's total AAPL position to date. Plus, it seems to have become a stagnant company...it just hasn't produced anything amazing/cool for a while now. Needless to say, it's got me putting AAPL on my short ideas.
I'll try and remember to post my set-up when I take on the trade but as of this moment the set up is not there.
Sell-off Incoming In my last idea, I forecasted that the price would rise to the resistance level of $255–$260. Now I’m expecting it to reject that level and continue downwards.

$AAPl - all time highs break possible soon.AAPL = stock having a fakeout breakout movement today after being in a tight channel. Stock has all time highs at $259.18 . rejecting close to that level today. looking for bigger breakout if that level breaks.
Apple + The 3 Step Rocket Booster StrategyI know i said i would stop talking about
stocks but i thought about you..
Maybe you are still in the making it stage
Maybe you only have access to forex options
but remember if thats the case dont
trade above x4 margin
Especially if you are dealing with stock
options.
Its because of you i fought hard to
design the Rocket booster
strategy.
This is the strategy i started with
its beginner friendly and
very easy to understand
it has 3 steps. i think the reason it become
so popular is because its very simple
so here are the following 3 steps:
1-The price has to be above the 50 EMA
2-The price has to be above the 200 EMA
3-The price should gap up
The last step is very important for you
to understand because it filters out
the noise in the trading.
How?
Because it has to be trending upwards
on the week and the day to signal
a beginner friendly entry for you.
Look at NASDAQ:AAPL
you can clearly see that its gapped up.
Rocket boost this content to learn more.
Disclaimer: Trading is risky
please use a simulation trading account
before you trade with real money.
APPLE Technical Analysis! SELL!
My dear friends,
Please, find my technical outlook for APPLE below:
The price is coiling around a solid key level - 255.42
Bias - Bearish
Technical Indicators: Pivot Points Low anticipates a potential price reversal.
Super trend shows a clear sell, giving a perfect indicators' convergence.
Goal - 244.04
About Used Indicators:
The pivot point itself is simply the average of the high, low and closing prices from the previous trading day.
Disclosure: I am part of Trade Nation's Influencer program and receive a monthly fee for using their TradingView charts in my analysis.
———————————
WISH YOU ALL LUCK

APPLE: Bears Will Push Lower
Remember that we can not, and should not impose our will on the market but rather listen to its whims and make profit by following it. And thus shall be done today on the APPLE pair which is likely to be pushed down by the bears so we will sell!
Disclosure: I am part of Trade Nation's Influencer program and receive a monthly fee for using their TradingView charts in my analysis.
❤️ Please, support our work with like & comment! ❤️
Time to pluck the Apple?Apple has made a slanted double top and showing resistance around $257. An hourly closing below $250 will create more weakness and opportunity for shorting, while if it gives a daily closing above $260, then we may see more upside and a new ATH. The chances of downside are a bit more given the current scenario. In nutshell, expect a good move on either side (more chances of lower side) Keep an eye. (For educational purpose only)
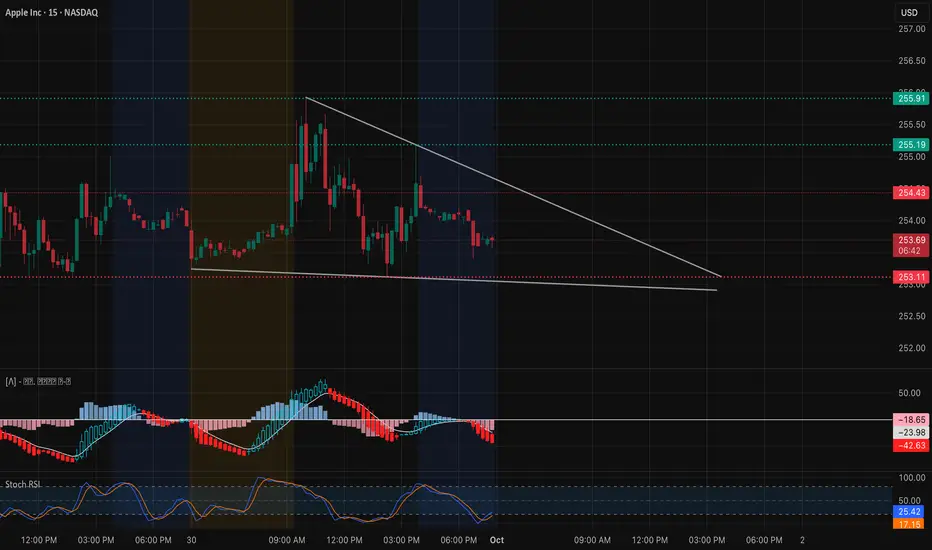
AAPL Oct. 1 – Coiling Below Resistance, Next Big Move Loading!Intraday View (15-Min Chart)
AAPL traded choppy with a clear descending trendline pressing price lower. It’s holding around $253–$254, but momentum is fading as MACD stays red and Stoch RSI remains weak.
* Support Levels: $253.11, $253.58, $254.43
* Resistance Levels: $255.19, $255.91
* Indicators: MACD firmly negative, showing sellers still in control. Stoch RSI hovering near lows, suggesting potential for a small bounce.
📌 Intraday Thought (Oct. 1): If $253 holds, AAPL could bounce back to $255+. A breakdown under $253 risks a slide toward $250. Scalpers can lean long on $253 support with tight stops, or fade into $255.9 resistance if price rejects.
Options & Swing View (1H + GEX)
Gamma exposure provides a wide setup:
* Upside: Heavy call walls at $257–$262.5, with a gamma cluster stretching toward $265–$270.
* Downside: Put support around $247.5–$242.5, deeper wall at $237.5.
This keeps AAPL boxed between $250–$257 in the short term. A break over $257 could trigger a push into $262–$265, while losing $250 risks deeper tests toward $247.
* Bullish Play (Oct. 1): Calls targeting $262.5–$265 if $257 breaks on volume.
* Bearish Hedge: Short puts toward $250 → $247.5 if support fails.
* Neutral Play: Iron condor between $247.5–$257 while AAPL consolidates.
My Thoughts (Oct. 1)
AAPL is stuck under a descending trendline, and momentum looks weak into the close. The $253 level is key—hold it and we could see a bounce back to $255+, but a break lower risks sliding toward $250. For options, I’d wait for a confirmed move through $257 breakout or $250 breakdown before sizing up.
Disclaimer: This analysis is for educational purposes only and does not constitute financial advice. Always do your own research and manage risk before trading.
AAPL Bullish Swing Setup – Buy the Dip for $289 Target1. Chart Type & Timeframe
Symbol: Apple Inc. (AAPL)
Timeframe: 4H (4-hour candles)
Platform: TradingView
This is a short- to medium-term analysis, not a long-term forecast.
2. Trend Analysis
The price is in a rising channel (marked in red), meaning the overall trend is bullish.
Currently, the price is near the upper boundary of the channel, showing a possible short-term pullback before resuming upward momentum.
3. Entry & Stop-Loss
Entry Point: Around $244.32 – $244.54
This is near the lower boundary of the channel, a support zone.
Suggests waiting for a pullback before entering.
Stop Loss: Around $233.72 – $234.37
Positioned below the channel, so if price breaks this, it may signal a trend reversal (protects capital).
4. Target
Target Price: Around $288.91 – $289.13
This is significantly higher than the entry, showing a risk/reward ratio of ~4:1, which is favorable.
It aligns with projecting the channel’s trend upward.
5. Price Action Expectation
The black zig-zag line shows a pullback first, then a bounce back up from the support area (entry zone).
If price respects support, a bullish rally toward $289 can follow.
6. Key Observations
✅ Bullish Setup: Good reward potential if the price bounces at support.
✅ Clear Risk Management: Stop loss is properly placed below structure.
⚠ Caution: If price breaks below $234, trend could reverse — no trade should be held below stop loss.
Summary
This is a bullish swing trade plan for Apple:
Wait for pullback near $244 before buying.
Stop-loss below $234 to manage risk.
Target $289, giving a strong risk/reward ratio.
This plan assumes that the uptrend channel will hold and price will respect support before moving higher.

AAPLApple (AAPL) price is in a strong uptrend, there is a chance that the price will test the $261-$265 level. In this zone, if the price cannot break above $265, the short-term price is likely to go down, consider selling the red zone.
🔥Trading futures, forex, CFDs and stocks carries a risk of loss.
Please consider carefully whether such trading is suitable for you.
>>GooD Luck 😊
❤️ Like and subscribe to never miss a new idea!
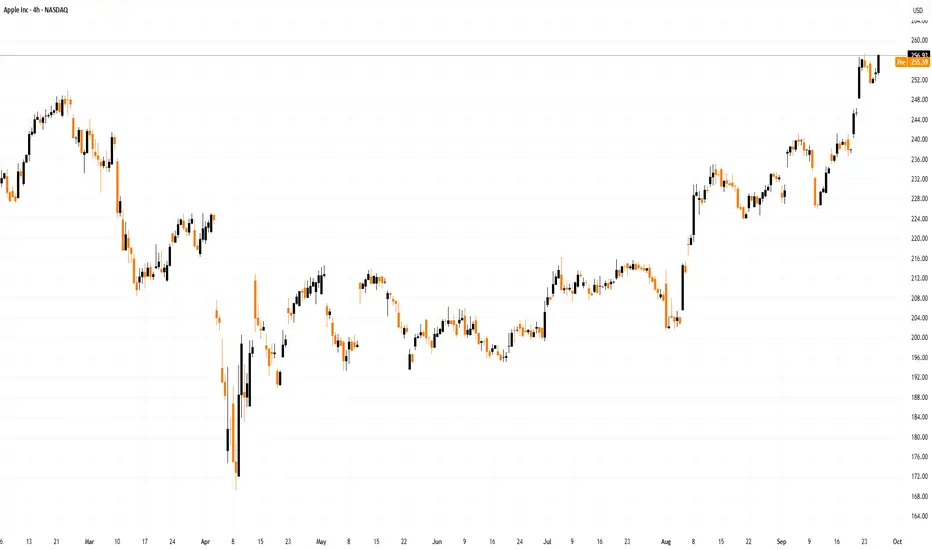
market update 9-29SPY needs to get under 654 for any substantial break to occur, otherwise it will test and likely exceed it's highs. Gold may be running out of steam soon. Bitcoin needs to hold 109k. AAPL testing it's highs but could we see a down move next? Worth watching....

Learn What a VOID is and how it Impacts Your Trading A void is a trading condition that occurs when small lot buyers and Odd Lot investors run out of capital to invest. These two retail groups tend to have very little savings to invest so they buy Odd Lots (under 100 shares for one transaction) or Fractional Shares, which is a fraction of ONE single share of stock of a company.
These groups are the LAST buyers in during a Velocity or Speculative Trading Condition which happens often during highly emotional trading activity in a Moderately Up Trending Market Condition.
When the Odd lot and low capital base NEW retail day traders run out of money they stop buying and a VOID of BUYERS occurs.
The Sell Side Institutions, Giant Hedge Funds, Professional Independent Traders all recognize the volume and price patterns that form due to a VOID of BUYERS on the retail side.
Volume bars are the number of ORDERS that are rapidly moving through the huge and very complex stock market systems. Volume, therefore is a primary indicator that warns of an impending VOID of BUYERS. When that occurs, the professionals mentioned above start to prepare to sell short and determined how low they can place a buy-to-cover order to maximize their profits when selling short. Thus, with a surge of HFT sell short orders, the market would gap down at open. HFTS use very small lot orders to fill the queues ahead of the market open and thus force the computers that run the market to lower the price of the stock to where the buy to covers are waiting. So that is WHY there is a sudden collapse of price after a speculative run up as we have had recently and will have again.

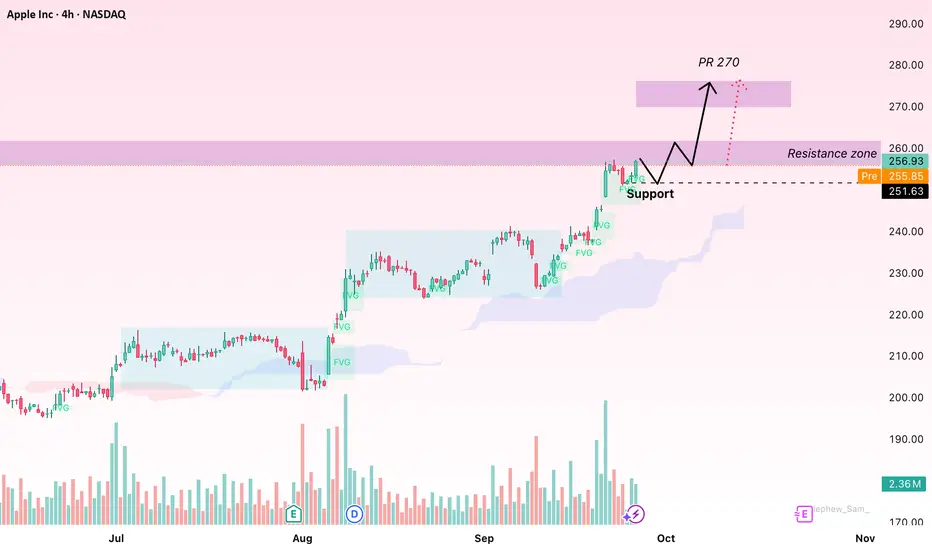
AAPL watch $256-257: Double Golden fib zone that caused last TOPAPPL has been confidently climbing the wall of worries.
Now testing the Double Golden zone at $256.75-257.41
Look for a Break-n-Retest (likely) or a Dip-to-Fib for entry.
.
Previous Analysis that caught the EXACT TOP:
Hit BOOST and FOLLOW for more such PRECISE and TIMELY charts.
========================================================
.

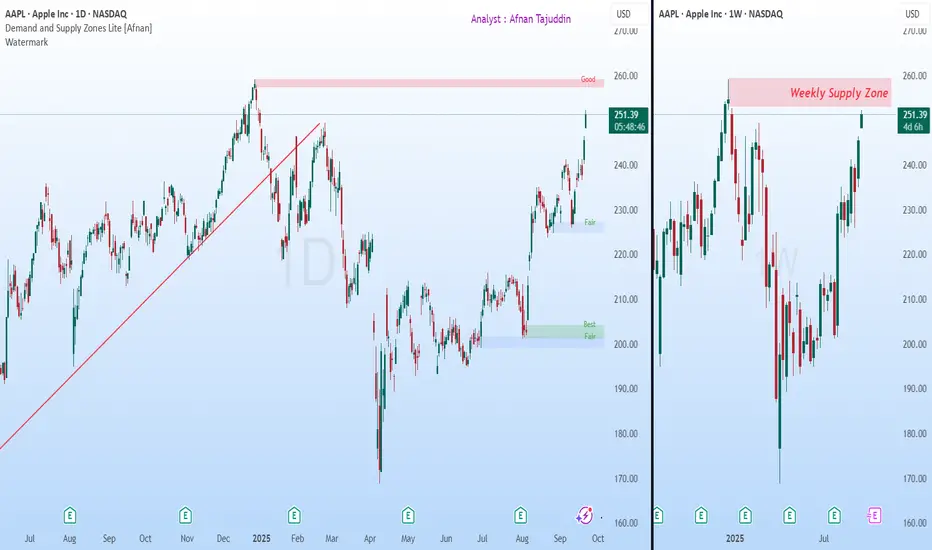
Apple (AAPL): Price Nears Critical Supply Zone at All-Time HighsApple’s chart is currently showing signs of caution as the price climbs into a significant supply area. Both the weekly and daily timeframes highlight strong supply zones that traders should carefully observe.
Weekly Supply Zone
On the weekly chart , Apple is approaching a very strong supply zone
The supply area coincides with all-time highs , making it even more significant.
🔎 Daily Supply Zone Confluence 🔎
The daily chart adds further weight to this setup:
The current daily supply zone is nested inside the weekly supply zone .
This supply zone is powerful because its follow-through candle not only rejected higher prices but also broke the uptrend trendline .
In simple terms, this supply zone has already shown its strength once by shifting the trend from up to down .The fact that this zone caused a trend change earlier makes it a major obstacle for bulls.
Now that price is revisiting this zone again, it signals a possible area for profit booking.
With Apple near its all-time highs and supply confluence in place, risk-reward favors caution.
🎯 Trading Perspective
Traders should keep an eye on this zone, Consider booking profits as price approaches this heavy supply area.
“Strong supply zones often act like brick walls — they don’t break easily without significant force.”
⚡ At these levels, patience and discipline are key — don’t let greed take over when charts are signaling caution. 📉🍏
💡 Trading is not about catching every move — it’s about protecting capital and letting opportunities come to you. 🚀📊
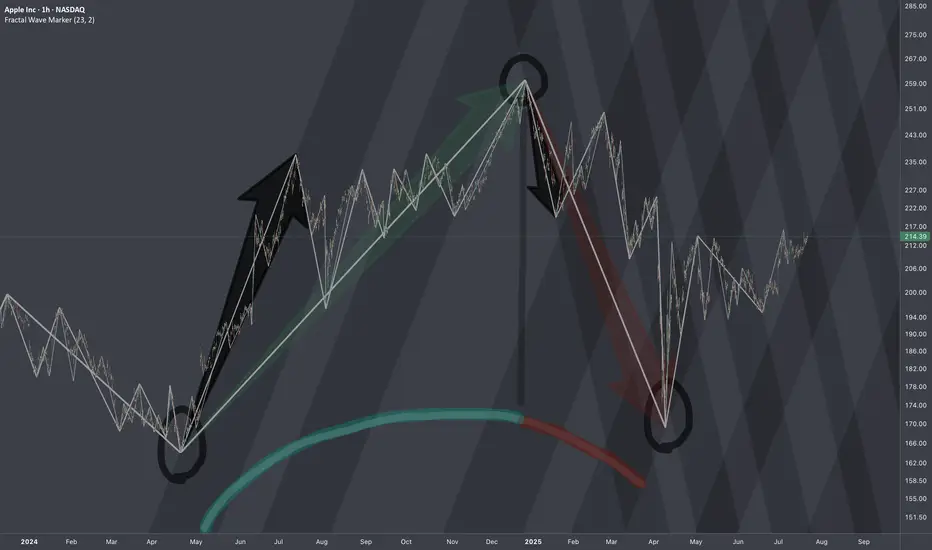
$AAPL: Structure SurgeryResearch Notes
Original Structure:
Altering structure for experimental purposes
Angle of fib channels that rises from cycle low, has been pushed into the past to the top of first major reaction. blue area resembles the change
Reason
The the angle of Fibonacci channels which cover the general decline (from perspective of ATH to end of cycle), are adjusted to the angle of the first bear wave of smaller scale.
Therefore, when it comes to measurements of opposing forces for working out interference pattern, having this symmetric approach of mapping interconnections is fair.
AAPL at Dynamic Support: Trade the Bounce!🍎 AAPL Swing/Day Trade: The Great Apple Heist Plan 🚨
Asset: AAPL (Apple Inc. Stock)
Market: US Stock
MarketVibe: Bullish, sneaky, and ready to loot some profits! 💰
📜 The Master Plan: Bullish EMA Pullback Heist
🎯 Strategy: We're pulling off a slick Double Exponential Moving Average (DEMA) pullback plan, targeting a breakout at dynamic support levels. Think of it as a high-stakes caper where we sneak in, grab the profits, and escape before the market knows what hit it! 😎
🔑 Key Setup Details:
Chart Setup: AAPL is showing a bullish setup with a DEMA pullback, signaling a potential swing or day trade opportunity.
Dynamic Line: We’re eyeing the DEMA as our guiding star 🌟 for entries and exits.
🚪 Entry: The Sneaky Thief Layering Strategy
🔍 How to Enter: Deploy the Thief Layering Strategy with multiple buy limit orders to maximize your entry precision:
🤑 Buy Limit Layers: Place orders at $227, $228, $229, $230 (or add more layers based on your risk appetite — you’re the mastermind here!).
💡 Pro Tip: Feel free to adjust entry levels to suit your style. The market’s your playground, so pick your spot!
🛑 Stop Loss: Protect Your Loot!
⚠️ Thief SL: Set your stop loss at $224 post-breakout to guard your stash.
Note: Dear Ladies & Gentlemen (Thief OGs 🕵️♂️), this SL is a suggestion. Adjust it based on your strategy and risk tolerance. You’re in charge of your heist, so protect your loot your way!
🎯 Target: Hit the Jackpot & Escape!
💥 Profit Target: Aim for $248, where a high-voltage resistance wall ⚡️ awaits, potentially paired with overbought conditions and a sneaky trap. Grab your profits and vanish before the market catches on!
Note: Dear Thief OGs, this target is a suggestion. Set your TP based on your goals and risk management. Take the money and run at your own discretion! 😏
👀 Related Pairs to Watch (Correlations & Opportunities)
To boost your heist, keep an eye on these correlated assets:
NASDAQ:MSFT (Microsoft): Tech giant with similar market moves to AAPL. If AAPL’s bullish, MSFT might follow suit. Watch for parallel DEMA pullbacks.
NASDAQ:QQQ (Invesco QQQ ETF): Tracks the Nasdaq-100, where AAPL is a heavy hitter. QQQ’s trend can confirm AAPL’s bullish momentum.
AMEX:SPY (SPDR S&P 500 ETF): Broad market index. If SPY’s trending up, it supports AAPL’s bullish case.
Key Correlation Insight: AAPL often moves in tandem with tech-heavy indices like QQQ. A bullish QQQ or MSFT can reinforce confidence in this trade setup.
⚡ Why This Setup Rock
Bullish Momentum: DEMA pullback signals a strong continuation pattern.
Layered Entries: Multiple limit orders reduce risk and increase flexibility.
Clear Risk Management: Defined SL and TP keep your heist disciplined.
Market Context: Tech sector strength (check QQQ/MSFT) supports AAPL’s upward move.
⚠️ Risk Disclaimer
Dear Thief OGs, this is not financial advice. The market’s a wild place, and you’re the master of your trades. Set your SL and TP based on your own risk tolerance and strategy. Steal profits wisely! 😎
✨ “If you find value in my analysis, a 👍 and 🚀 boost is much appreciated — it helps me share more setups with the community!”
#Hashtags: #AAPL #SwingTrading #DayTrading #StockMarket #ThiefStrategy #TechnicalAnalysis #Bullish #TradingView
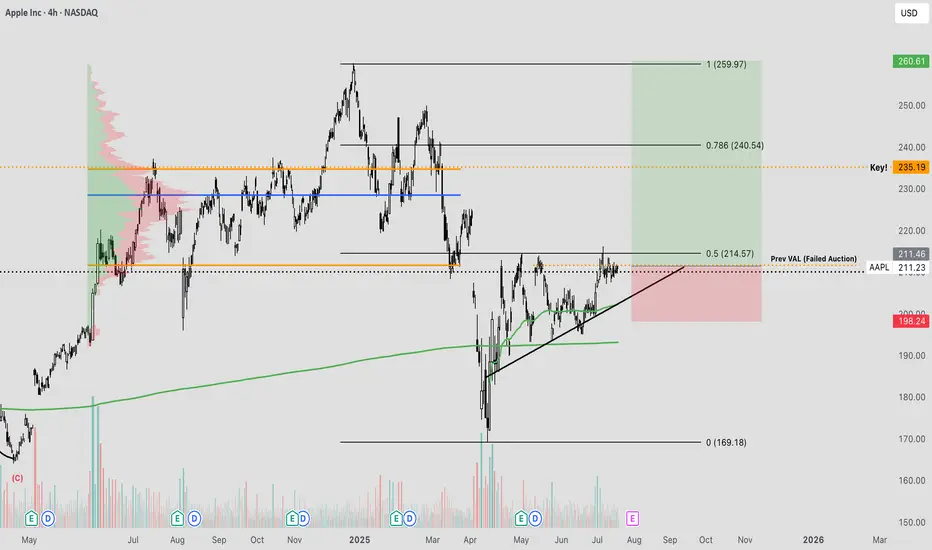
APPLE Lagging BehindApple remains a key component on my watchlist, having experienced a significant pullback amid recent market volatility driven by tariff-related macroeconomic tensions. A primary concern contributing to this weakness appears to be the company's delayed integration of AI technologies within its operating systems and hardware. There's a growing narrative among investors that Apple is beginning to resemble a legacy titan — respected but perhaps lagging behind in innovation.
That said, I believe Apple is actively developing AI capabilities behind the scenes, and any formal announcement or rollout could serve as a catalyst for a meaningful revaluation of the stock. Historically, Apple has demonstrated an ability to quietly build, then scale innovation at a massive level — and I suspect AI will be no different.
Interestingly, Apple has also exhibited characteristics of a defensive equity, often rallying even as broader global indices falter. This reinforces the notion that investors still view Apple as a relative safe haven. Given its valuation relative to long-term growth potential, Apple may be increasingly seen as an undervalued mega-cap poised for a strong rebound.
From a technical standpoint, we're beginning to see signs of accumulation, with buyers stepping in around key levels. The prior value area low around $211 has historically acted as a fair value zone. If price action successfully reclaims this level, auction market theory would imply a potential move back toward the upper end of the range — approximately $230 to $235.
Moreover, the current market structure is forming a constructive ascending pattern, with price pressing into higher zones. Should this structure hold and break through resistance, it could trigger accelerated upside momentum. This setup offers a compelling longer-term swing opportunity, particularly with clearly defined risk. The invalidation point lies just below the ascending trendline and the anchored VWAP from the lows — a key trend confirmation tool used to gauge average positioning of market participants.
All considered, this is a technically sound and fundamentally interesting level to consider an entry. Let’s see how this one unfolds.
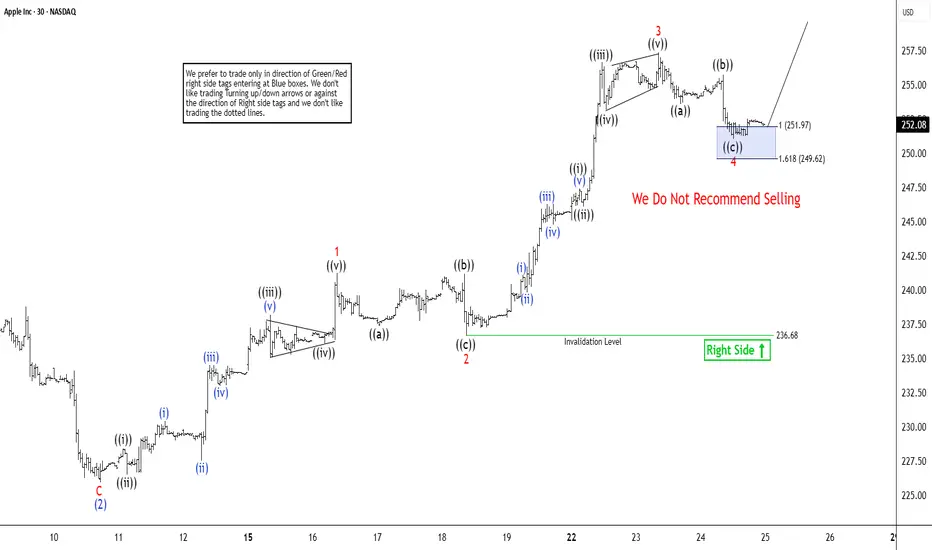
Apple (AAPL) Targets Higher to Finish Wave 5The short-term Elliott Wave analysis for Apple (AAPL) indicates that a rally from the September 11, 2025 low is unfolding as a five-wave impulse structure. Starting from that low, wave ((i)) concluded at $228.40, followed by a pullback in wave ((ii)) that ended at $226.50. The subsequent advance in wave ((iii)) reached $238.19, with a brief dip in wave ((iv)) closing at $236.10. The final leg, wave ((v)), peaked at $241.22, completing wave 1 of a higher degree. A corrective wave 2 followed, concluding at $236.68, exhibiting an internal zigzag structure with segments ((a)), ((b)), and ((c)).
The stock has since resumed its upward trajectory in wave 3. From the wave 2 low, wave ((i)) advanced to $247.42, and a minor pullback in wave ((ii)) settled at $244.39. The rally in wave ((iii)) climbed to $256.64, followed by a dip in wave ((iv)) to $253.16. The final push in wave ((v)) reached $257.34, completing wave 3 of a larger degree. A corrective wave 4 appears to have concluded at $251.04, aligning with the 100%–161.8% Fibonacci extension of the zigzag structure. As long as the pivot at $236.68 holds, any near-term pullback should find support in a 3, 7, or 11 swing, setting the stage for further upside momentum in AAPL’s price action.
AAPL: The Rally Might Not Be OverWhile many tech giants have already reached new all-time highs, Apple is still lagging behind — NASDAQ:AAPL hasn’t yet broken out. This may represent both a risk and an opportunity for latecomers.
Investor caution remains due to potential tariffs on Apple products from China, with the decision now postponed until August.
This uncertainty may be holding the price back, but could also lead to a strong accumulation phase if no negative headlines emerge in the near term.
Technicals:
• A breakout above $215 could open the way toward $249 (previous high).
• Support at $197 remains strong.
• Stochastic is in overbought, but MACD confirms bullish momentum.
NASDAQ:AAPL may start catching up with the broader market — especially if tariff fears subside. Watch closely for a confirmed breakout above $215.

$AAPL: The Market's Breath | A Contrarian Perspective at a Point"My capital is finite, but opportunity is infinite. I will not risk my finite capital on an 'okay' setup when a perfect one is inevitable. I can miss this move and feel nothing, because the next one is already forming."
This is a core tenet for those of us who aim to trade without limits—not financial limits, but the mental and emotional ones that chain us to fear and greed. We missed the last long entry on Apple. This is a fact, neither good nor bad. It is simply a piece of the puzzle that has been laid. Now, a new piece presents itself.
The Technical Landscape
The market has a rhythm, a breath of expansion and contraction. After a powerful inhalation—a strong move up—Apple now finds itself at a critical juncture.
Channel Resistance: Price is approaching the upper boundary of a potential ascending channel. These boundaries are often where the market pauses to exhale.
High-Volume Node: This area of resistance aligns with a previous high that was accompanied by significant volume. This tells us that a great deal of business was done here before, and participants may be looking to take profits or initiate shorts, creating supply.
Overbought Condition: From a broader view, indicators like the RSI are showing the stock as technically overbought. This doesn't guarantee a reversal, but it does suggest the bullish momentum may be stretched thin, like a rubber band pulled taut.
The setup is based on this confluence. We are not predicting a crash; we are simply observing that this is a logical place for the bears to test the strength of the bulls.
The Philosophy: Don't Be a Salmon
A salmon fights with all its might to swim upstream, an admirable but exhausting journey. As traders, we must be wiser. While the prevailing news on Apple is a torrent of bullishness—strong iPhone 17 demand, analyst upgrades—the price has arrived at a technical waterfall. To blindly buy here is to swim against a potential counter-current of profit-taking.
Our approach is to go short at resistance not because we are bearish on the company, but because it offers us a statistically favorable risk-to-reward ratio. We know precisely where our thesis is invalidated (the stop loss), and the potential reward for being correct is multiples of our potential loss. This is not about being right or wrong about the stock's long-term future; it is about sound risk management in the present moment. The bears may be fattening up for a brief winter at this specific altitude.
A Balanced Perspective: The Forest for the Trees
To truly understand our trade (the tree), we must look at the market (the forest).
The Bull Case: The narrative is powerful. The launch of the iPhone 17 is being met with stronger-than-expected demand. Analysts are raising price targets, with some calling for a move above $300. The underlying trend is undeniably strong, and a breakout through this resistance could lead to another significant leg up, fueled by those who capitulate on their shorts.
The Bear Case: The recent surge has been parabolic. From a technical standpoint, the stock is overextended and trading at a premium valuation. This resistance level is the perfect psychological point for early buyers to take profits. Any broader market weakness or a simple exhaustion of the current buying frenzy could easily trigger the exhale we are anticipating.
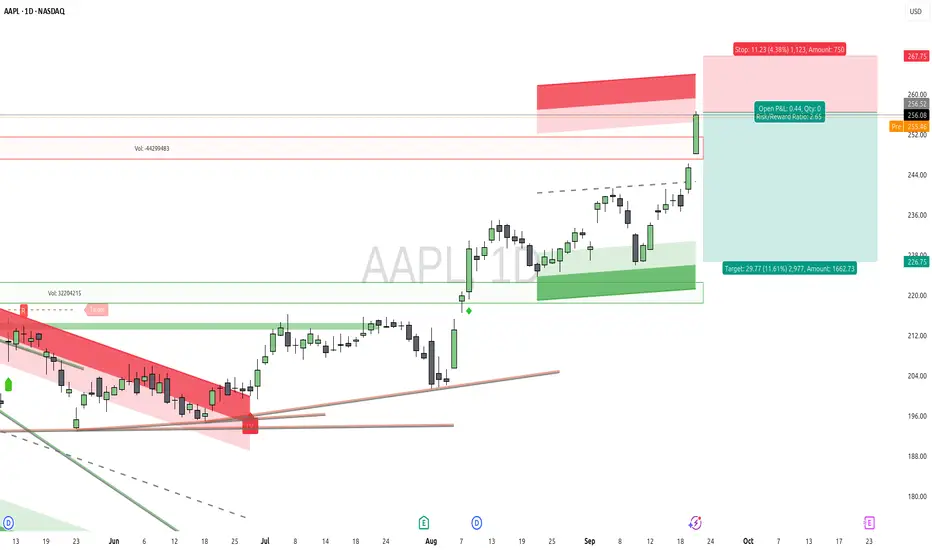
An Illustrative Setup
This is a hypothetical setup for educational purposes, based on the principles discussed.
Entry: 256.52
Stop Loss: 267.75 (This is our point of invalidation)
Profit Target: 226.75 (A logical point of reversion)
Risk/Reward Ratio: 2.65
We act on our setup. If the market proves us wrong, we accept the feedback with gratitude, preserve our capital, and await the next opportunity, which is already forming.
Disclaimer: This is not financial advice. It is for educational and informational purposes only. Please conduct your own research and manage your risk accordingly.