Has GE Vernova Peaked?GE Vernova appreciated more than 400 percent since getting spun off in April 2024. Now some traders may see a peak in the maker of power-generation equipment such as turbines and windmills.
The first pattern on today’s chart is $664.55, the record closing high from August 6. GEV peaked at the same level on October 15, resulting in a potential double-top.
Second, MACD is falling and the 8-day exponential moving average (EMA) is below the 21-day EMA. That may suggest its short-term trend is turning bearish.
Third, prices are under the falling 50-day simple moving average. That may suggest its intermediate-term trend has turned bearish.
Finally, you have the September 3 low of $565.43. GEV probed that level after the last earnings report. It stayed above it for the next several sessions, but yesterday it closed below it. Is support breaking?
TradeStation has, for decades, advanced the trading industry, providing access to stocks, options and futures. If you're born to trade, we could be for you. See our Overview for more.
Past performance, whether actual or indicated by historical tests of strategies, is no guarantee of future performance or success. There is a possibility that you may sustain a loss equal to or greater than your entire investment regardless of which asset class you trade (equities, options or futures); therefore, you should not invest or risk money that you cannot afford to lose. Online trading is not suitable for all investors. View the document titled Characteristics and Risks of Standardized Options at www.TradeStation.com . Before trading any asset class, customers must read the relevant risk disclosure statements on www.TradeStation.com . System access and trade placement and execution may be delayed or fail due to market volatility and volume, quote delays, system and software errors, Internet traffic, outages and other factors.
Securities and futures trading is offered to self-directed customers by TradeStation Securities, Inc., a broker-dealer registered with the Securities and Exchange Commission and a futures commission merchant licensed with the Commodity Futures Trading Commission). TradeStation Securities is a member of the Financial Industry Regulatory Authority, the National Futures Association, and a number of exchanges.
TradeStation Securities, Inc. and TradeStation Technologies, Inc. are each wholly owned subsidiaries of TradeStation Group, Inc., both operating, and providing products and services, under the TradeStation brand and trademark. When applying for, or purchasing, accounts, subscriptions, products and services, it is important that you know which company you will be dealing with. Visit www.TradeStation.com for further important information explaining what this means.
Trade ideas

$GEV Technical and Position UpdateNYSE:GEV Support and Trading Strategy Overview
Earnings and Revenue Performance
On October 22nd, NYSE:GEV missed earnings expectations. However, despite the miss, the company's earnings still grew by 368%. Additionally, revenue rose by 11.8% during the same period.
Support Area and Technical Indicators
An important area of support has been identified in the current price action for $GEV. The stock has remained above this support level for the past two trading days. Technically, NYSE:GEV has also regained its 5-day and 10-day moving averages (DMA) and is presently trading just below the 20-day exponential moving average (EMA).
Position Initiation and Risk Management
A half-size position was initiated at $587. A price alert is set on the horizontal support area, which is being monitored as a potential point to close the position if necessary. The actual stop is placed below the most recent low recorded on October 28th, at $565.00. Both the horizontal support area and the recent low represent attractive risk-reward levels aligned with the trading style being used.
Potential Position Additions
If the price manages to move above the 20-day EMA, there are plans to add to the existing position.
Important Disclaimer
Readers are encouraged to independently analyze this trading idea and strictly follow their own trading rules. It is important to remember that all investments carry risk. Making informed decisions with your own capital is essential.

480 soon, then 900?It's a buy if it hits 480. Most likely it will reach 900.
Happy trading!!
Not a financial advice.

GEV | Long Earning Setup + DZ Rejection +TL Breackout
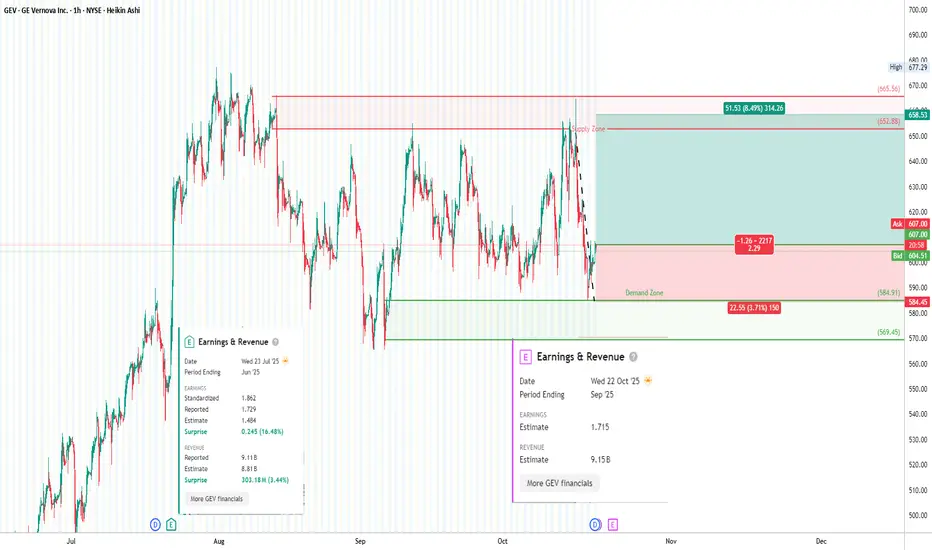
GEV has been chopping sideways in a high-volatility consolidation after a major uptrend. The current drop into a clear Demand Zone around $584–$570 was met with an immediate reaction, suggesting institutional absorption and a potential base forming.
Price has wicked into this Demand Zone, The reaction looks impulsive and we may be setting up for a leg higher targeting the previous Supply Zone.
🧾 Earnings
Last Earnings (Jul 23): EPS $1.862 (beat by 16.48%), Revenue $9.11B (beat by 3.44%)
Next Earnings (Oct 22): EPS Est. $1.715, Revenue Est. $9.15B
Watch for pre-earnings run-up or volatility spike around Oct 22.
Supply Zone: $652–$665 (key resistance for sellers)
Demand Zone: $570–$584 (institutional bid zone)
RSI: Bullish divergence forming – lower lows on price, higher lows on RSI
🎯 Trade Idea: Long Setup
Entry: $607.00 (confirmation bounce off Demand)
Stop Loss: $584.45(below Demand zone)
Take Profit: $658.53 (prior Supply)
Risk/Reward: 1:2.3
💼 Risk Management
Max Risk: 1–3% of capital per position
Adjust position size accordingly based on SL distance (~$15 risk per share)
📊 Trade Management
At 1:1 RR (~$600.25): Consider moving SL to Breakeven
Trail SL on 1H higher lows if momentum builds
Partial profits around $640 zone if needed
"Amateurs focus on rewards. Professionals focus on risk." – Jack Schwager
⚠️ Disclaimer
This is not financial advice. Always do your own research. Trade based on your personal risk tolerance and trading plan.
#GEV #SupplyDemand #LongSetup #EarningsPlay #Wave3 #RSIDivergence #RiskManagement #TradingViewIdea
Bullish pennant Ge vernova. A electricity stock thats riding the ai hype.
Even if AI does not pay off or it slows down the electricity demand will stay.
Ge vernova is forming a bullish penannt on the dayli chart getting close to breaking out.

GE Vernova GEV STRONG BUYA spinoff from General Electric, GE Vernova focuses on renewables and low-carbon technology. Increased investor interest centers on its role in the global energy transition and ability to scale green infrastructure.

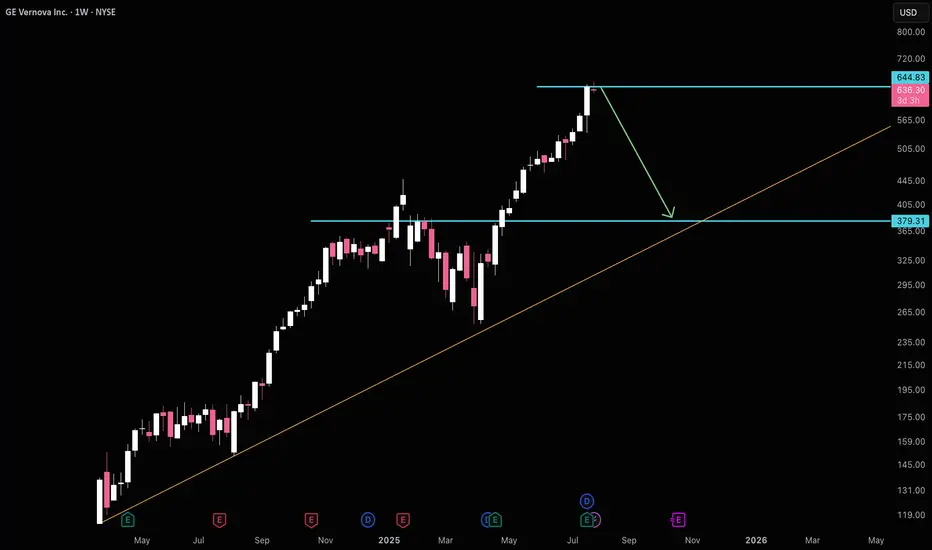
GEV High Risk $380GEV has a high risk of $380 at the moment. Obviously don't bet against the trend, especially while the S&P still has a lot of room to run, but it's an easy area to open some insurance for a potential fall to $380.
Good luck!
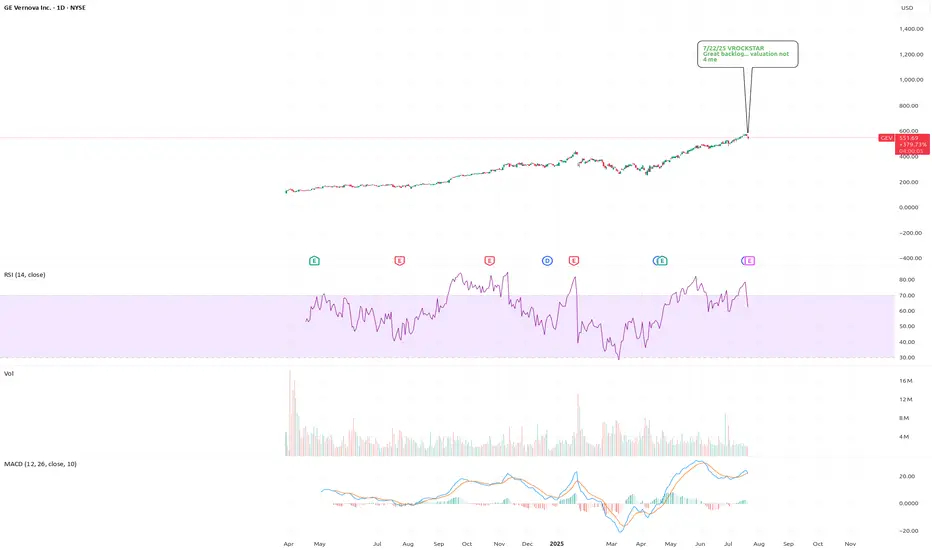
7/22/25 - $gev - Great backlog... valuation not 4 me7/22/25 :: VROCKSTAR :: NYSE:GEV
Great backlog... valuation not 4 me
- literally demand for as long as the eye can see
- is that worth 2% fcf yield? probably
- 50x next year PE? probably
- i'd dip buy this. but honestly i think results/ comms are +ve and stock all else equal goes higher. i just don't care b/c that valuation in this toppy (ST) tape is just too much. if there's anything -ve you'd see this down 10-20%, up maybe is 5-10% max... so that's not good r/r
- i'd also point out here you can dip buy this w conviction, so i'd rather sideline and if/does dip, it will get bid and so that's a risk free look
- gl to the longs. amazing story/ spin
V
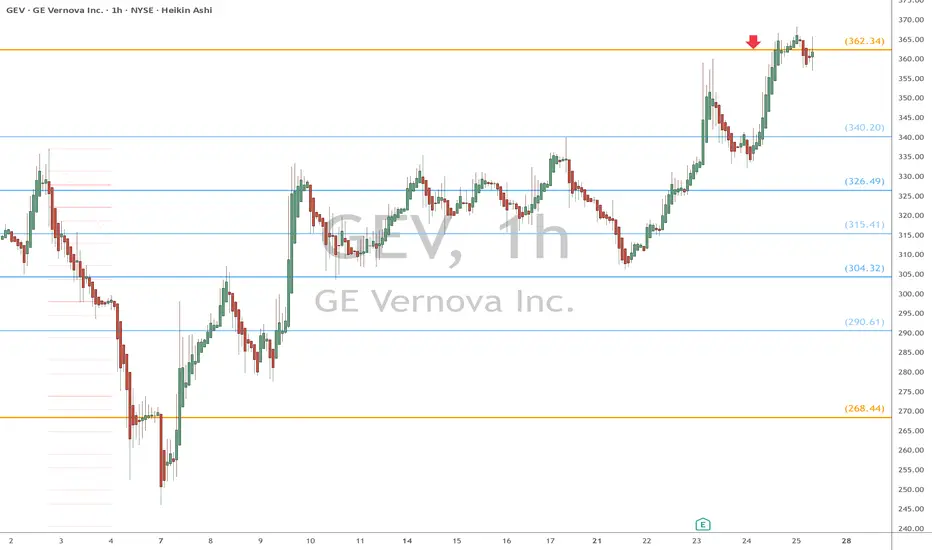
GEV eyes on $362.34: Golden Genesis Fib that may End BounceGEV trying to recover with the general market.
Currently testing a Golden Genesis Fib at $362.34
Looking for a Dip here, or Break-and-Retest entry.
GE Vernova Inc. (GEV) – Powering the Global Energy TransitionCompany Overview:
GE Vernova NYSE:GEV is becoming a cornerstone of the global clean energy shift, providing advanced power generation, transmission, and renewable energy technologies that are now mission-critical for national energy strategies.
Key Catalysts:
Explosive Electrification Growth ⚡
Grid Solutions backlog tripled YoY, driven by demand for modern, resilient, and clean grids.
HVDC & FACTS technologies place GEV at the forefront of a global multi-decade grid overhaul.
Recurring Revenue from Wind Repowering 🌬️
1 GW of upgraded capacity in 2024 under the Repower program.
GEV operates the most widely installed wind platform in the U.S., giving it dominance in the high-margin retrofit market.
Strategic Manufacturing Expansion 🏭
$600M+ in investments across Florida and India expand capacity and de-risk the supply chain.
Supports global demand from infrastructure stimulus and decarbonization mandates.
Investment Outlook:
Bullish Case: We are bullish on GEV above $410.00–$415.00, as clean energy investment accelerates.
Upside Potential: Price target of $600.00–$610.00, backed by order momentum, retrofit leadership, and global energy reform.
🔋 GE Vernova – Electrifying the Future. #GEV #CleanEnergy #GridModernization #WindPower

Weekly candles all greenThe stock is following a steady climb. Trendline shows the climb. These are weekly candles. The stock is moving in one direction so far and that is up !

GE Vernova, Inc. - A Leading Electric Power IndustryGE Vernova, Inc. is a company making waves in the electric power industry. Here's a brief overview:
* Founded on November 09, 2021
* Headquartered in Cambridge, Massachusetts
* Segments:
1. **Power**: Designs, manufactures, and services gas, nuclear, hydro, and steam technologies for dispatchable, flexible, stable, and reliable power.
2. **Wind**: Develops onshore and offshore wind turbines and blades.
3. **Electrification**: Offers grid solutions, power conversion, electrification software, and solar and storage solutions for electricity transmission, distribution, conversion, storage, and orchestration.
Their mission is to generate, transfer, orchestrate, convert, and store electricity, making them a key player in the electric power industry.

1/28/2025 GEV longHello traders,
I noticed a bullish signal on GEV, as well as across energy and chip stocks today. Yesterday’s market breakdown, caused by DeepSeek, led to panic selling and significantly impacted these sectors. However, the diversified AI model will likely expand the overall market opportunity, meaning energy companies aren’t necessarily facing decreased revenue.
The chart also shows a very bullish signal. The stock bounced off the 21-week moving average and formed a large wick on the daily chart, indicating that the sell-off may be over. I’m planning to sell when the gap is filled, with a target price of $417.
Good luck, everyone. May the trend be with you.
AP

GEV Strong In A Weak Tape And Setting Up A Pullback BuyI drew a couple lines to show what I'd like to see over the next couple trading sessions. Not only would that be a pullback to the top of a long base but it would be a pullback to the 20sma. As it turns up from there could be a good opportunity for a low risk pullback buy entry.
The market might keep me from pulling the trigger, but if I decide to go in I won't put much capital at risk.

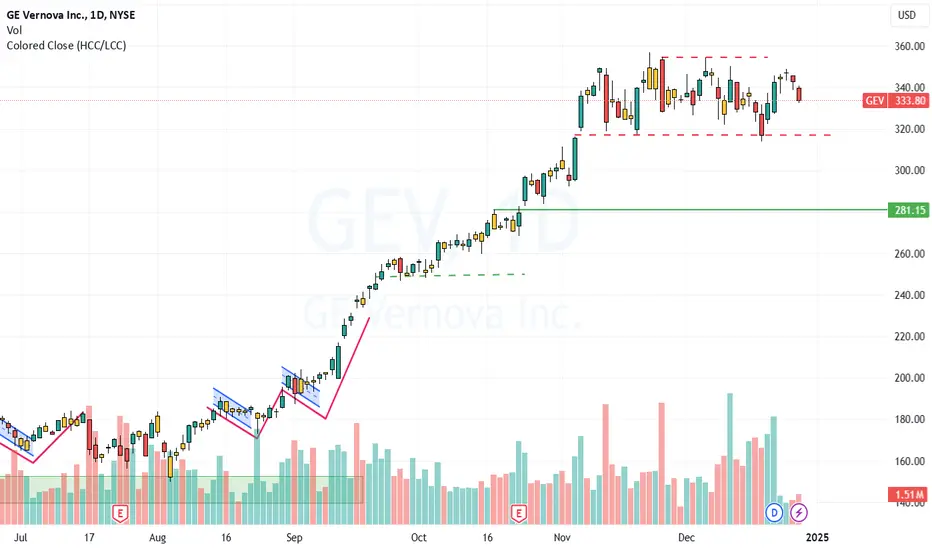
GEV moving out of long consolidation boxI like what I see, lower end of consolidation box validated by last earnings AVWAP, loads of accumulation, healthy price action and a move out of the box, which needs to be confirmed this coming week. Overall very bullish.

326 is a very solid area of support on the sidewayIf you look closely at the sideway movement, it has already begun, even though the indicators have started to sell off. It could pose the question of whether a retracement of around 1.5% may be warranted or if a full correction occurs at this time where the second foundation of support stands.
consolidation breakout on the horizon all indicators pointingThe flow of sideway in a channel movement has been the bull trend analysis; in a nutshell, this has happened in the past few months, and it is looking to do it again with everything curling up and looking to race toward the top again after a brief breather. It could see a 10% or more move, especially if it passes the 350 area.

334 to 360 this has been a basic rule of trendAs sweet as the moving average is, it shows an uptrend retrace and continuation. The pattern seems to be formulating a pattern with continuous movement to the upside, which is why I await the next retrace and then continue to my target price.

FLAG PATTERN BULLISH BUT bearish on other indicatorsMACD death cross, but stochastic crossover bearish continuation, but flag pattern from center Bollinger also at the same level for correction before continuation. 310 then moves northwards.

Moving sideways as it consolidates before next breakoutMACD going sideways stochastics has been hovering around at the top in a flat line and has slowed down; I could see a sideway between a few points before the next breakout right now, so I could see a few points shaved off at this area.

I can see a clear push for 250The two diagrams represent W shaped breakouts, and another simply on the horizon. The candles are acting the same, and the continuing sentiment has me cautious but okay for continuation.
